. 2018 Jan 9;115(2):E124-E133.
doi: 10.1073/pnas.1713832115. Epub 2017 Dec 28.

Interplay of structure, elasticity, and dynamics in actin-based nematic materials

Affiliations

Interplay of structure, elasticity, and dynamics in actin-based nematic materials

Rui Zhang et al. Proc Natl Acad Sci U S A. .

Abstract

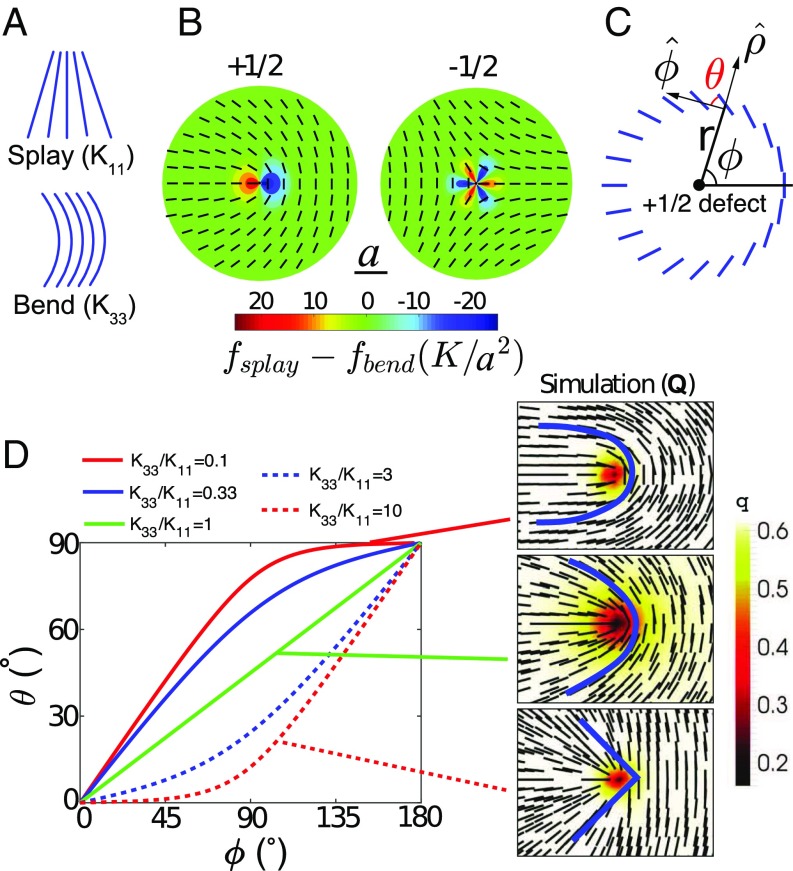
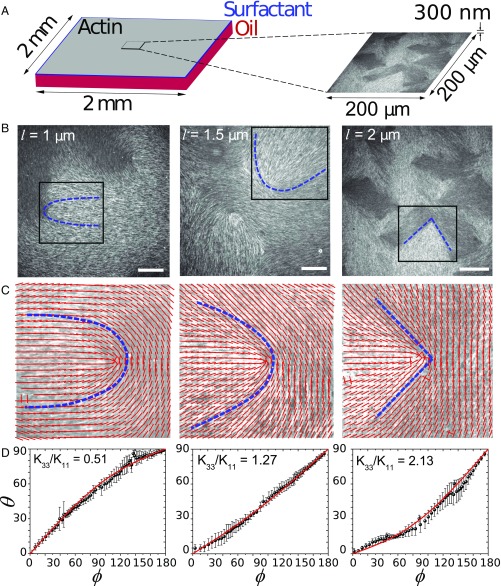
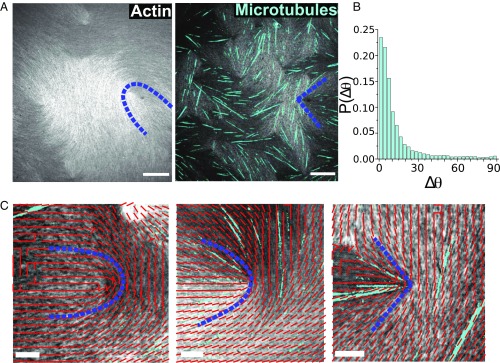
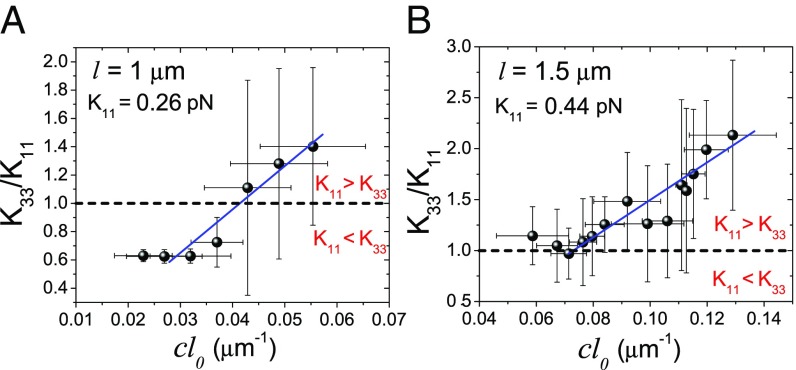
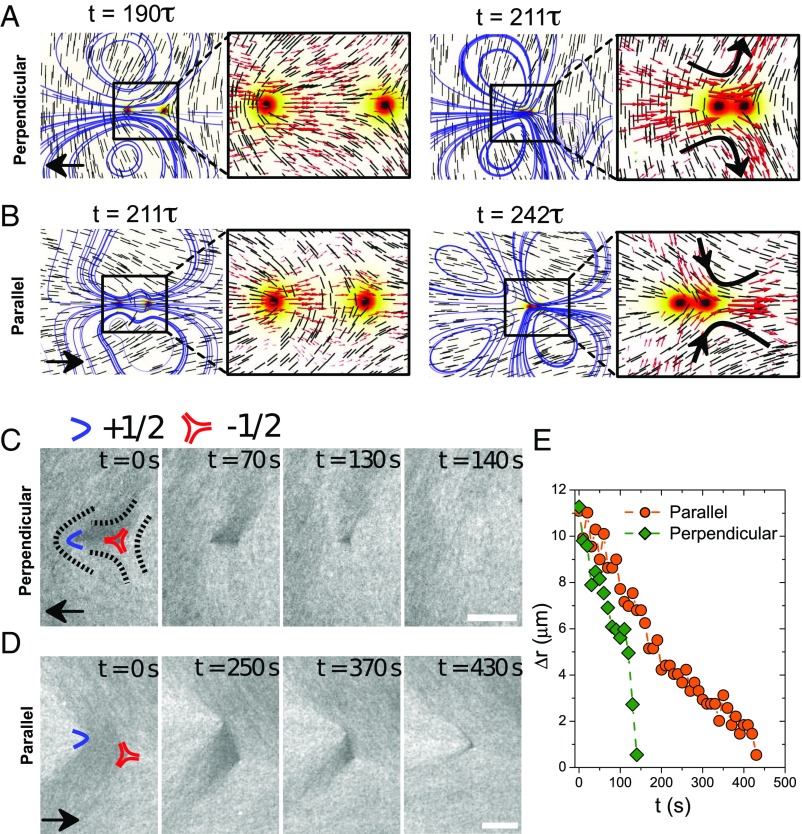
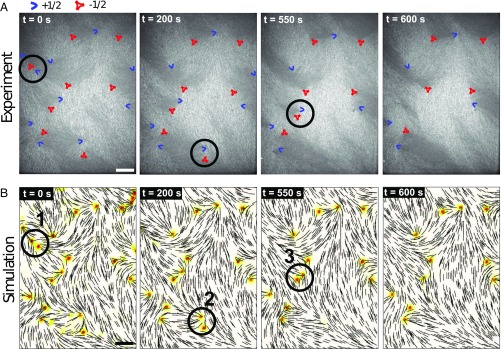
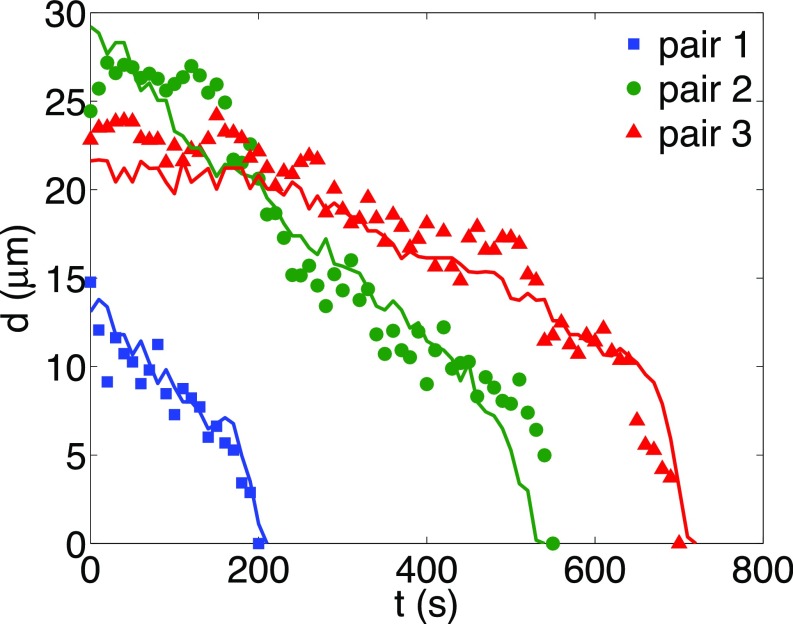
Achieving control and tunability of lyotropic materials has been a long-standing goal of liquid crystal research. Here we show that the elasticity of a liquid crystal system consisting of a dense suspension of semiflexible biopolymers can be manipulated over a relatively wide range of elastic moduli. Specifically, thin films of actin filaments are assembled at an oil-water interface. At sufficiently high concentrations, one observes the formation of a nematic phase riddled with [Formula: see text] topological defects, characteristic of a two-dimensional nematic system. As the average filament length increases, the defect morphology transitions from a U shape into a V shape, indicating the relative increase of the material's bend over splay modulus. Furthermore, through the sparse addition of rigid microtubule filaments, one can gain additional control over the liquid crystal's elasticity. We show how the material's bend constant can be raised linearly as a function of microtubule filament density, and present a simple means to extract absolute values of the elastic moduli from purely optical observations. Finally, we demonstrate that it is possible to predict not only the static structure of the material, including its topological defects, but also the evolution of the system into dynamically arrested states. Despite the nonequilibrium nature of the system, our continuum model, which couples structure and hydrodynamics, is able to capture the annihilation and movement of defects over long time scales. Thus, we have experimentally realized a lyotropic liquid crystal system that can be truly engineered, with tunable mechanical properties, and a theoretical framework to capture its structure, mechanics, and dynamics.

Keywords: actin; elasticity; lyotropic liquid crystal; microtubule; topological defects.


Conflict of interest statement

The authors declare no conflict of interest.

Figures

Fig. 1.
Fig. 1.
Morphology of +1/2 defects. (A) Illustration of splay and bend distortion in nematic LC. (B) The director fields of +1/2 and 1/2 defect under one-elastic-constant approximation. The color indicates the difference in splay and bend energy density; a is the unit length scale. (C) Quantitative description of defect morphology: ϕ is the polar coordinate; θ is the angle between the director and the angular vector ϕ^. (D) The morphology of +1/2 defects as a function of elastic constant ratio κK33/K11. Right images are the Q-tensor–based simulation results. Blue curves following the local director field are added to guide the eye.
Fig. 2.
Fig. 2.
Experiments on changing and visualizing actin-based LC’s elasticity by varying filament length. (A) Schematic illustration of experimental setup. Short F-actin is crowded to the oil–water interface supported by a layer of surfactant molecules. The small region in the middle represents the camera’s field of view used to image actin LC. (B) Fluorescent images of F-actin nematic LC on an oil–water interface. Filament length l increases from left to right. Dashed lines highlight the shape of the +1/2 defects. (Scale bar, 30 μm.) The director field within the black box is shown in C. (C) Red lines indicate the local director fields near +1/2 defects highlighted in A. (D) Quantitative measurements of the director fields for the above defects in terms of θ(ϕ) plots.
Fig. 3.
Fig. 3.
Experiments on changing actin-based LC’s elasticity by adding rigid microtubules. (A) Optical images of actin LC without and with microtubules. Blue dashed lines highlight the change in defect shape from U to V. (Scale bar, 30 μm.) (B) Probability distribution of the angle between microtubule orientations and the local F-actin director fields. (C) Optical images of +1/2 defects overlaid with the corresponding director field. Microtubule number density increases from left to right followed by the defect shape change from U to V. (Scale bar, 10 μm.)
Fig. 4.
Fig. 4.
Experiments on changing actin-based LC’s elasticity by adding rigid microtubules. The two plots are two independent experimental sets, each of which plots the fitted elastic constant ratio κ as a function of cl0 for (A) l =1 μm for 15 defects and (B) l = 1.5 μm for 20 defects. The slope gives the direct measure of the splay elastic constant K11. The error bars correspond to the SD.
Fig. 5.
Fig. 5.
Two scenarios of defect annihilation events. (A and B) Simulations of defect annihilation with two different defect configurations; black arrows indicate the orientations of +1/2 defects approaching −1/2 defect from left, short lines show the director field, and curves are the streamlines. Background color corresponds to the order parameter, using the same colorbar as in Fig. 1D. In zoom-in frames, black arrows indicate the inward/outward flows upon annihilation, and red arrows represent the velocity field. (C and D) Time sequence of annihilation as seen in the experiments for perpendicular and parallel case, respectively. Blue boomerangs and red triangles represent +1/2 and −1/2 defects, respectively. (Scale bar, 10 μm.) (E) Defect separation, measured in experiment, Δr, plotted as function of time.
Fig. 6.
Fig. 6.
Actin-based LC “weather map.” (A) Consecutive optical images from actin LC equilibration process; blue boomerangs represent +1/2 defects, and red triangles indicate 1/2 defects. (B) Consecutive simulation images corresponding to the experiments; black lines depict the local director field, and the background color indicates scalar order parameter (adopting the same colorbar as in Fig. 1). The circled defects annihilate in the next frame. (Scale bars, 30μm.)
Fig. 7.
Fig. 7.
Metric of the weather map. Defect separation as a function of time for three annihilating defect pairs marked by numbers in Fig. 6. Symbols are experimental measurements, and curves are from simulation.

References

    1. Chen RH. Liquid Crystal Displays: Fundamental Physics and Technology. Wiley; New York: 2011.
    1. Warner M, Terentjev EM. Liquid Crystal Elastomers. Vol 120 Oxford Univ Press; Oxford: 2003.
    1. Camacho-Lopez M, Finkelmann H, Palffy-Muhoray P, Shelley M. Fast liquid-crystal elastomer swims into the dark. Nat Mater. 2004;3:307–310. - PubMed
    1. Muševič I, Škarabot M, Tkalec U, Ravnik M, Žumer S. Two-dimensional nematic colloidal crystals self-assembled by topological defects. Science. 2006;313:954–958. - PubMed
    1. Rahimi M, et al. Nanoparticle self-assembly at the interface of liquid crystal droplets. Proc Natl Acad Sci USA. 2015;112:5297–5302. - PMC - PubMed

Publication types

LinkOut - more resources