. 2017 Aug 24;8(62):104877-104893.
doi: 10.18632/oncotarget.20501. eCollection 2017 Dec 1.

Dietary polyphenols influence antimetabolite agents: methotrexate, 6-mercaptopurine and 5-fluorouracil in leukemia cell lines

Affiliations

Dietary polyphenols influence antimetabolite agents: methotrexate, 6-mercaptopurine and 5-fluorouracil in leukemia cell lines

Amani Mahbub et al. Oncotarget. .

Abstract

Polyphenols have been previously shown to sensitize leukemia cell lines to topoisomerase inhibitors. Here, we assess the effects of five polyphenols when used alone and in combination with antimetabolites: methotrexate, 6-mercaptopurine and 5-fluorouracil; in lymphoid and myeloid leukemia cells lines, and non-tumor control cells. The effects of combined treatments were investigated on ATP and glutathione levels, cell-cycle progression, DNA damage and apoptosis. Polyphenols antagonized methotrexate and 6-mercaptopurine induced cell-cycle arrest and apoptosis in most leukemia cell lines. This was associated with reduced DNA damage and increased glutathione levels, greater than that seen following individual treatments alone. In contrast, 5-fluorouracil when combined with quercetin, apigenin and rhein caused synergistic decrease in ATP levels, induction of cell-cycle arrest and apoptosis in some leukemia cell lines. However, antagonistic effects were observed when 5-fluorouracil was combined with rhein and cis-stilbene in myeloid cell lines. The effects were dependant on polyphenol type and chemotherapy agent investigated, and cell type treated. Interestingly treatment of non-tumor control cells with polyphenols protected cells from antimetabolite treatments. This suggests that polyphenols modulate the action of antimetabolite agents; more importantly they antagonized methotrexate and 6-mercaptopurine actions, thus suggesting the requirement of polyphenol-exclusion during their use.

Keywords: 5-fluorouracil; 6-mercaptopurine; leukemia; methotrexate; polyphenols.


Conflict of interest statement

CONFLICTS OF INTEREST The authors declare no conflicts of interest for this submission.

Figures
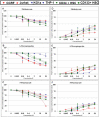
Figure 1
Figure 1
Effect of methotrexate, 6-mercaptopurine and 5-fluorouracil alone on ATP levels (A, B & C) and caspase 3 activity (D, E & F) in two lymphoid (CCRF-CEM and Jurkat), two myeloid (THP-1 and KG-1a) leukemia cell lines, and two non-tumor control cells (CD133+ HSC and CD34+ HSC). The lowest significant doses (LSD): which caused a significant reduction on ATP levels and induction of caspase 3 activity when compared to the vehicle control were determined for each anti-metabolite agent in each cell lines. The * indicated for LSD in each cell line.
Figure 2
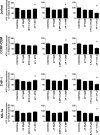
Figure 2. The effect of methotrexate (MTX), 6-mercaptopurine (6-MP) and 5-fluorouracil (5-FLU) when used in combination with apigenin (AP) on ATP levels: in two lymphoid (Jurkat and CCRF-CEM) and two myeloid (THP-1 and KG-1a) leukemia cell lines, evaluated by CellTiter-Glo® assay
Cells were treated with MTX, 6-MP or 5-FLU and apigenin alone and in combination for 24 hr using their lowest-significant doses (LSD); together with a vehicle control. All data was normalised to the vehicle control which was assigned 100% cell viability. The data was expressed as medians and ranges (n=4). Effects of combination treatments were statistically classified as synergistic (*) causing a decrease in ATP levels or antagonistic (#) causing an increase in ATP levels; when compared to vehicle control, drugs alone and expected values of combination treatments. Statistical significant was set at P≤0.05.
Figure 3
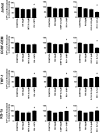
Figure 3. The effect of methotrexate (MTX), 6-mercaptopurine (6-MP) and 5-fluorouracil (5-FLU) when used in combination with rhein (RH) on ATP levels: in two lymphoid (Jurkat and CCRF-CEM) and two myeloid (THP-1 and KG-1a) leukemia cell lines
This was evaluated by CellTiter-Glo® assay. Cells were treated with MTX, 6-MP or 5-FLU and rhein alone and in combination for 24 hr using their lowest-significant doses (LSD); together with a vehicle control. All data was normalised to the vehicle control which was assigned 100% cell viability. The data was expressed as medians and ranges (n=4). Effects of combination treatments were statistically classified as synergistic (*) causing a decrease in ATP levels or antagonistic (#) causing an increase in ATP levels; when compared to vehicle control, drugs alone and expected values of combination treatments. Statistical significant was set at P≤0.05.
Figure 4
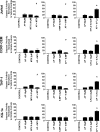
Figure 4. The effect of methotrexate (MTX), 6-mercaptopurine (6-MP) and 5-fluorouracil (5-FLU) when used in combination with apigenin (AP) on caspase 3 activity: in two lymphoid (Jurkat and CCRF-CEM) and two myeloid (THP-1 and KG-1a) leukemia cell lines
This was evaluated by NucView caspase 3 activity assay. Cells were treated with MTX, 6-MP or 5-FLU and apigenin alone and in combination for 24 hr using their lowest-significant doses (LSD); together with a vehicle control. All data was normalised to the vehicle control which was assigned 0% apoptosis. The data was expressed as medians and ranges (n=4). Effects of combination treatments were statistically classified as synergistic (*) causing an increase in caspase 3 activity or antagonistic (#) causing an decrease in caspase 3 activity; when compared to vehicle control, drugs alone and expected values of combination treatments. Statistical significant was set at P≤0.05.
Figure 5
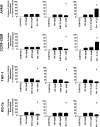
Figure 5. The effect of methotrexate (MTX), 6-mercaptopurine (6-MP) and 5-fluorouracil (5-FLU) when used in combination with rhein (RH) on caspase 3 activity: in two lymphoid (Jurkat and CCRF-CEM) and two myeloid (THP-1 and KG-1a) leukemia cell lines
This was evaluated by NucView caspase 3 activity assay. Cells were treated with MTX, 6-MP or 5-FLU and rhein alone and in combination for 24 hr using their lowest-significant doses (LSD); together with a vehicle control. All data was normalised to the vehicle control which was assigned 0% apoptosis. The data was expressed as medians and ranges (n=4). Effects of combination treatments were statistically classified as synergistic (*) causing an increase in caspase 3 activity or antagonistic (#) causing an decrease in caspase 3 activity; when compared to vehicle control, drugs alone and expected values of combination treatments. Statistical significant was set at P≤0.05.
Figure 6
Figure 6. The effect of methotrexate (MTX), 6-mercaptopurine (6-MP) and 5-fluorouracil (5-FLU) on cell cycle progression, when used in combination with apigenin (AP): in two lymphoid leukemia cell lines (Jurkat and CCRF-CEM) and two myeloid leukemia cell lines (THP-1 and KG-1a)
This was analysed by flow cytometry following propidium iodide staining. Cells were treated with MTX, 6-MP or 5-FLU and apigenin alone and in combination for 24 hrs using their lowest-significant doses (LSD) as determined by CellTiter-Glo assay, together with a vehicle control. The percentage of cells in each phase was analysed with FlowJo software using Waston pragmatic model. The data was expressed as medians with ranges (n=4). Statistical significance of combination treatments were determined and compared with the vehicle control and the individual treatments alone. The green asterisk (*) represents significant increase in cell accumulation in a phase of the cell cycle; whilst the black asterisk (*) indicates a significant decrease in cell accumulation in a phase of the cell cycle. Statistical significant was set at P≤0.05.
Figure 7
Figure 7. The effect of methotrexate (MTX), 6-mercaptopurine (6-MP) and 5-fluorouracil (5-FLU) on cell cycle progression, when used in combination with rhein (RH): in two lymphoid leukemia cell lines (Jurkat and CCRF-CEM) and two myeloid leukemia cell lines (THP-1 and KG-1a)
This was analysed by flow cytometry following propidium iodide staining. Cells were treated with MTX, 6-MP or 5-FLU and rhein alone and in combination for 24 hrs using their lowest-significant doses (LSD) as determined by CellTiter-Glo assay, together with a vehicle control. The percentage of cells in each phase was analysed with FlowJo software using Waston pragmatic model. The data was expressed as medians with ranges (n=4). Statistical significance of combination treatments were determined and compared with the vehicle control and the individual treatments alone. The green asterisk (*) represents significant increase in cell accumulation in a phase of the cell cycle; whilst the black asterisk (*) indicates a significant decrease in cell accumulation in a phase of the cell cycle. Statistical significant was set at P≤0.05.
Figure 8
Figure 8. The effect of methotrexate (MTX) and 6-mercaptopurine (6-MP) when used in combination with quercetin (QUE), apigenin (AP), emodin (EMO), rhein, (RH) or cis-stilbene (CIS) on glutathione (GSH) levels: in two lymphoid (Jurkat and CCRF-CEM) and two myeloid (THP-1 and KG-1a) leukemia cell lines
GSH levels were evaluated by the GSH-Glo™ Glutathione. Cells were treated with MTX or 6-MP and polyphenols alone and in combination for 24 hrs using their lowest-significant doses (LSD). Data was normalised to the vehicle control which was assigned 100% of GSH levels. The data was expressed as medians and ranges (n=4). Effects of combination treatments were statistically classified as synergistic (*) causing a decrease in GSH levels or antagonistic (#) causing an increase in GSH levels; when compared to vehicle control, drugs alone and expected values of combination treatments. Statistical significant was set at P≤0.05.
Figure 9
Figure 9. The effect of methotrexate (MTX) and 6-mercaptopurine (6-MP) when used in combination with quercetin (QUE), apigenin (AP), emodin (EMO), rhein, (RH) or cis-stilbene (CIS) on γ-H2AX foci formation (DNA damage marker): in two lymphoid (Jurkat and CCRF-CEM) and two myeloid (THP-1 and KG-1a) leukemia cell lines
This was evaluated by the immunofluorescent staining using Alexa Fluor® 647 Mouse anti-H2AX (pS139). Cells were treated with MTX or 6-MP and polyphenols alone and in combination for 24 hrs using their lowest-significant doses (LSD). The data was expressed as medians and ranges (n=4). Data was normalised to the vehicle control which was assigned 0% of γ-H2AX foci formation (DNA damage marker). Effects of combination treatments were statistically classified as synergistic (*) causing an increase in the percentage of cells with γ-H2AX foci or antagonistic (#) causing an decrease in the percentage of cells with γ-H2AX foci; when compared to vehicle control, drugs alone and expected values of combination treatments. Statistical significant was set at P≤0.05.

Similar articles

Cited by

References

    1. Leukemia and lymphoma Research Last accessed January 01 2017 at: http://leukemialymphomaresearch.org.uk/
    1. National Institute for Health Care Excellence (NICE) Last accessed March 06 2017 at: https://www.evidence.nhs.uk/Search?q=Antimetabolites.
    1. Food U.S, Drug Administration FDA. Last accessed March 2017 at: https://www.fda.gov/Drugs/default.htm.
    1. American Cancer Society Last accessed January 2017 at: https://www.cancer.org/treatment.
    1. Cancer Research UK Last accessed January 01 2017 at: http://www.cancerresearchuk.org/about-cancer/type/all/treatment.

LinkOut - more resources