. 2017 Oct 27;8(62):105284-105298.
doi: 10.18632/oncotarget.22168. eCollection 2017 Dec 1.

Abnormally glycosylated MUC1 establishes a positive feedback circuit of inflammatory cytokines, mediated by NF-κB p65 and EzH2, in colitis-associated cancer

Affiliations

Abnormally glycosylated MUC1 establishes a positive feedback circuit of inflammatory cytokines, mediated by NF-κB p65 and EzH2, in colitis-associated cancer

Sandra Cascio et al. Oncotarget. .

Abstract

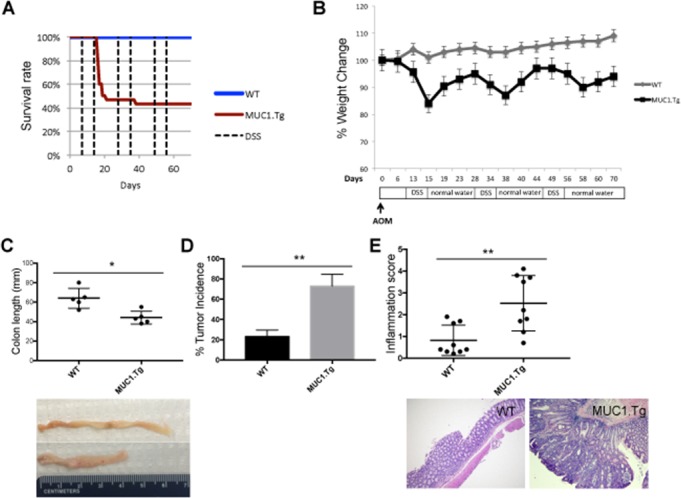
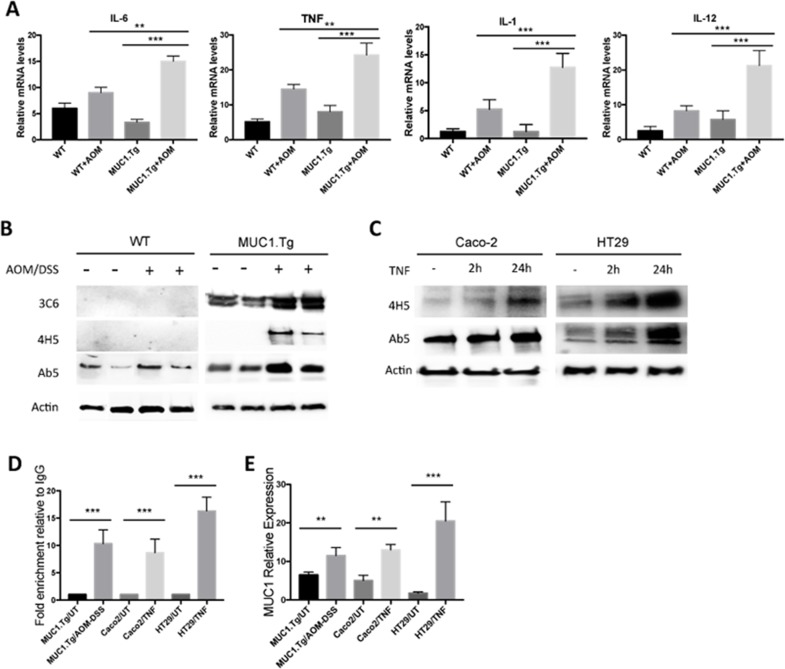
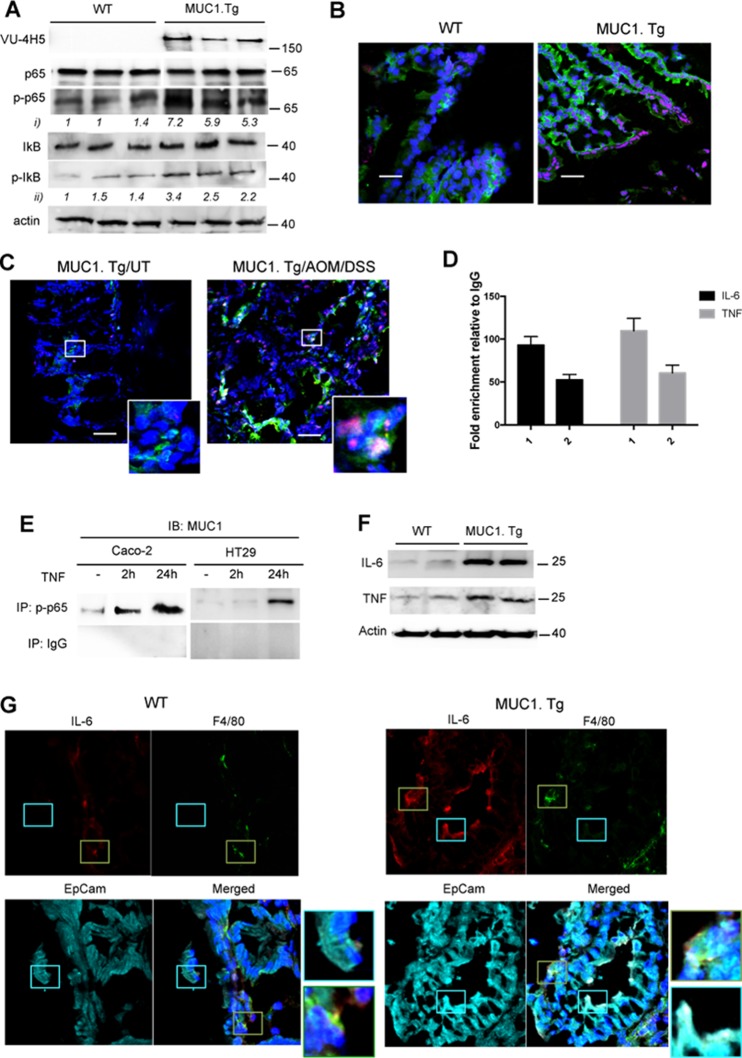
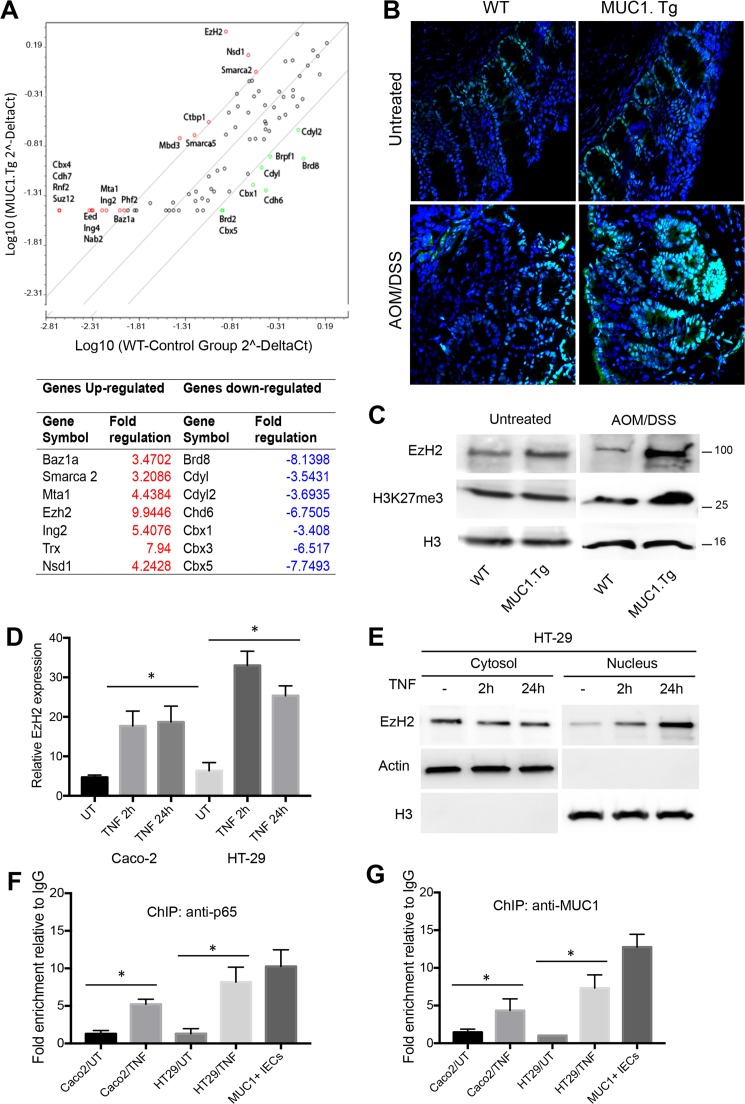
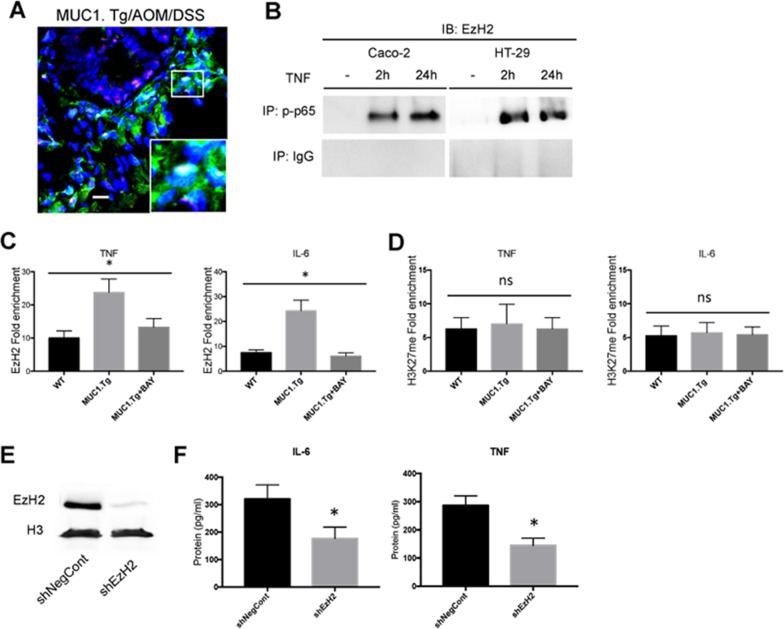
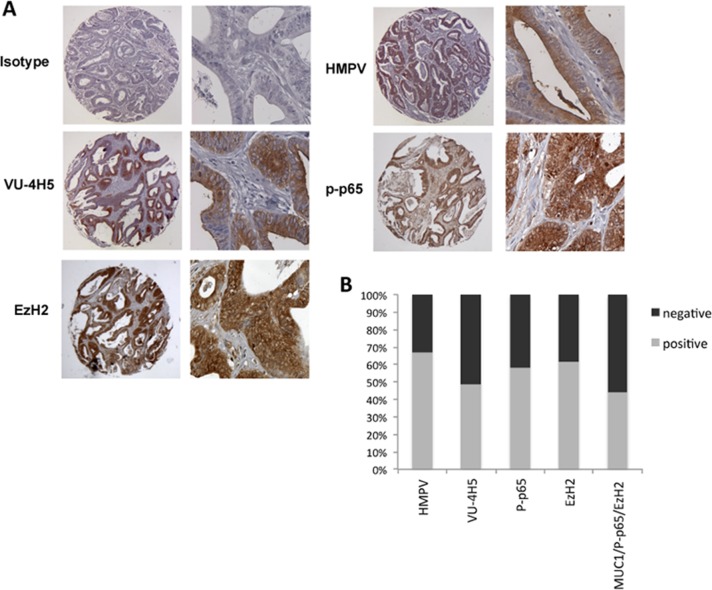
The abnormal hypoglycosylated form of the epithelial mucin MUC1 is over-expressed in chronic inflammation and on human adenocarcinomas, suggesting its potential role in inflammation-driven tumorigenesis. The presence of human MUC1 aggravates colonic inflammation and increases tumor initiation and progression in an in vivo AOM/DSS mouse model of colitis-associated cancer (CAC). High expression levels of pro-inflammatory cytokines, including TNF-α and IL-6, were found in MUC1+ inflamed colon tissues. Exogenous TNF-α promoted the transcriptional activity of MUC1 as well as over-expression of its hypoglycosylated form in intestinal epithelial cells (IECs). In turn, hypoglycosylated MUC1 in IECs associated with p65 and up-regulated the expression of NF-κB-target genes encoding pro-inflammatory cytokines. Intestinal chronic inflammation also increased the expression of histone methyltransferase Enhancer of Zeste protein-2 (EzH2) and its interaction with cytokine promoters. Consequently, EzH2 was a positive regulator of MUC1 and p65-mediated IL-6 and TNF-α gene expression, and this function was not dependent on its canonical histone H3K27 methyltransferase activity. Our findings provide a mechanistic basis for already known tumorigenic role of the hypoglycosylated MUC1 in CAC, involving a transcriptional positive feedback loop of pro-inflammatory cytokines.

Keywords: EzH2; Mucin 1; altered glycosylation; colitis-associated cancer; pro-inflammatory cytokines.


Conflict of interest statement

CONFLICTS OF INTEREST The authors declare no conflicts of interest.

Figures

Figure 1
Figure 1. MUC1 promotes inflammation and tumorigenesis in AOM/DSS-treated mice
WT and MUC1.Tg mice were given an AOM i.p. injection followed by three cycles of 1.2% DSS in drinking water, as described in Materials and Methods. (A) Kaplan-Meier survival curves of WT (n = 24) and MUC1.Tg (n = 31) mice during AOM/DSS treatment. (B) Body weight of WT and MUC1.Tg following AOM/DSS treatment. (C) Colon length of WT (n= 9) and MUC1.Tg (n=12) mice. Picture is an example of one WT and one MUC1.Tg mouse. Measurement of colon lengths in sacrificed mice at day 72. (D) Incidence of tumors in the colons. Statistical analysis was carried out with unpaired t test with Welch's correction ** indicates P<0.05. (E) Upper Panel: Results of histological scoring of sections from WT and MUC1.Tg mice. The data shown are representative of three independent experiments; Lower Panel: Hematoxylin and eosin staining. Histopathology of colon tissues of DSS/AOM treated mice. An example of a WT mouse showing colon inflammation while MUC1.Tg mice developed colon adenocarcinomas.
Figure 2
Figure 2. Chronic Inflammation promotes MUC1 expression via NF-κB activation
(A) Detection of mRNA levels by real-time PCR in the indicated colonic tissues. Gene expression of each target molecule was normalized to GAPDH. Statistical analysis was carried out with One-way Anova. ** or *** indicate P<0.05 or P < 0.001 respectively. (B) Western blotting of whole cell lysates from IECs isolated from untreated or AOM/DSS-treated WT and MUC1.Tg mice with anti-MUC1 VU-3C6, VU-4H5 or Ab5 antibodies. Actin was used as loading control. (C) SDS-PAGE gel of Caco-2 and HT-29 cells treated with TNF-α or left untreated and then blotted with indicated antibodies. (D) ChIP assay. Soluble chromatin was immunoprecipitated with anti-NF-κB p65 antibody and analyzed by qPCR for NF-κB consensus sites on MUC1 promoter. ChIP was performed on IECs isolated from colon tissues of MUC1.Tg mice treated with AOM/DSS or on TNF-treated Caco-2 and HT-29 cells. Quantification of binding was represented as fold-enrichment relative to IgG. *** indicates P < 0.001. (E) Detection of mRNA levels of MUC1 by real-time PCR. Gene expression was normalized to GAPDH. Statistical analysis was carried out with One-way Anova. ** or *** indicate P<0.05 or P < 0.001 respectively.
Figure 3
Figure 3. MUC1 promotes expression of NF-κB-dependent pro-inflammatory cytokines in IECs after AOM/DSS administration
(A) Western blotting of whole cell lysates from IECs isolated from WT and MUC1.Tg mice with anti-MUC1 VU-4H5, anti-phospho-p65, total p65, total IκB and anti-phospho-IκB antibodies. Actin was used as loading control. Densitometry analyses were performed with ImageJ software and anti-pp65 (i) or anti-pIκB (ii). Band intensities were normalized to β-actin and quantified with respect to one control mouse set to 1.0. Note: the blotting representing anti-MUC1-VU4H5 Ab staining was partially used in Figure 2B. (B) Confocal double-stainingimmunofluorescence microscopy analysis of phospho-p65 (red) and phospho-IκB (green) expression in colons of AOM/DSS-treated WT and MUC1.Tg mice. Nuclei were stained with DAPI (blue); Bar: 100 μm. (C) Confocal double-stainingimmunofluorescence microscopy analysis of phospho-p65 (red) and hypoglycosylated MUC1 (green) expression in colons of AOM/DSS-treated MUC1.Tg mice or left untreated. (UT). Nuclei were stained with DAPI (blue); Bar: 100 μm. (D) ChIP assay. Soluble chromatin from MUC1+IECs was immunoprecipitated with anti-p65 (1) and anti-MUC1 Ab5 (2) antibodies and then analyzed for the proximal region of IL-6 and TNF-α promoters. Quantification of binding was represented as fold-enrichment relative to IgG. (E) Co-Immunoprecipitation Assay. Immunoprecipitatetd NF-κB p65 nuclear proteins from indicated cells were immunoblotted with anti-MUC1 Ab5 antibody. (F) IECs lysates immunoblotted with anti-IL-6 and anti-TNF-α antibodies. (G) Confocal immunofluorescence microscopy of frozen colon tissue samples, fixed and stained with F4/80 (green), EpCAM (cyan) and anti-IL-6 antibody (red). Magnification 80X.
Figure 4
Figure 4. AOM/DSS-treatment up-regulated EzH2 expression via NF-κB pathway activation in IECs of MUC1.Tg
(A) Eighty-four cancer related genes were analyzed using RT2 Profiler™ PCR Array. Scatter plot of the hybridization intensity of each gene in the two groups: WT (x-axis-group 1) and MUC1.Tg (y-axis- group 2). The middle line indicates a fold-change (2-ΔCt) of 1. The top and the bottom lines indicate the fold-change in gene expression threshold. The two points under the bottom line represent downregulated genes. Significant genes with fold change <±3.2 and p-values <0.05. (B) Confocal immunofluorescence microscopy of frozen colon tissue fixed and stained with anti-EzH2 antibody (green); Nuclei were stained with DAPI (blue). (C) Nuclear proteins were immunoblotted with anti-EzH2, anti-H3K27m3 antibodies. Histone H3 was used as loading control. (D) EzH2 mRNA levels and (E) cytosolic and nuclear protein expression were analyzed by Real-Time PCR or by Western blotting in indicated cells stimulated with TNF for 2h or 24 hours or left untreated. (F-G) ChIP assay was performed in TNF-stimulated or unstimulated Caco-2 or HT-29 cells and in IECs isolated from AOM/DSS-treated MUC1.Tg mice. Soluble chromatin was immunoprecipitated with NF-κB p65 (F) and MUC1 Ab5 (G) antibodies and then analyzed by qPCR for kB1 consensus site on promoters of EzH2. Quantification of binding was represented as fold-enrichment relative to IgG. Statistical analysis was carried out with unpaired One-way ANOVA. * indicates P<0.05.
Figure 5
Figure 5. EzH2 regulates inflammatory cytokines expression in MUC1+ IECs from AOM/DSS-treated mice
(A) Confocal immunofluorescence microscopy of frozen colon tissue samples, fixed and stained with anti-NF-κB p65 (red) or EzH2 (green) antibodies. Bar: 100 μm. (B) Co-Immunoprecipitation Assay. NF-kB, p65 immunoprecipitated nuclear proteins from indicated cells were immunoblotted with anti-EzH2 antibody. (C-D) ChIP assay: soluble chromatin was immunoprecipitated with indicated antibodies and analyzed for κB consensus sites of IL-6 and TNF-α promoters. Quantification of binding was represented as fold-enrichment relative to IgG. (E) Western blotting of whole cell lysates of IECs transfected with an shRNA targeting EzH2 (shEzH2) or a target control (shNegCont), as described in Material and Methods, with anti-EzH2 antibody. Actin was used as loading control. (F) Indicated cytokine production by IECs transfected with shEzH2 RNA or target control (shNegCont). N=6 per group. Statistical analysis was carried out with one-way ANOVA, * indicates P < 0.05, ns= not significantly different.
Figure 6
Figure 6. Co-expression of hypoglycosylated MUC1 with p-p65 and EzH2 in colon adenocarcinoma
(A) Immunohistochemistry staining of the indicated proteins in colon adenocarcinoma. Original magnification is 200X. (B) Quantification of the percent of colon adenocarcinoma expressing total MUC1 (HMPV), hypoglycosylated MUC1 (VU-4H5), p-p65 (276) and EzH2 in colon adenocarcinoma (n=70).

Similar articles

Cited by

References

    1. Feagins LA, Souza RF, Spechler SJ. Carcinogenesis in IBD: potential targets for the prevention of colorectal cancer. Nat Rev Gastroenterol Hepatol. 2009;6:297–305. doi: 10.1038/nrgastro.2009.44. - DOI - PubMed
    1. Terzic J, Grivennikov S, Karin E, Karin M. Inflammation and colon cancer. Gastroenterology. 2010;138:2101–14. doi: 10.1053/j.gastro.2010.01.058. e5. - DOI - PubMed
    1. Greten FR, Eckmann L, Greten TF, Park JM, Li ZW, Egan LJ, Kagnoff MF, Karin M. IKKbeta links inflammation and tumorigenesis in a mouse model of colitis-associated cancer. Cell. 2004;118:285–96. doi: 10.1016/j.cell.2004.07.013. - DOI - PubMed
    1. Dmitrieva OS, Shilovskiy IP, Khaitov MR, Grivennikov SI. Interleukins 1 and 6 as Main Mediators of Inflammation and Cancer. Biochemistry (Mosc) 2016;81:80–90. doi: 10.1134/S0006297916020024. - DOI - PubMed
    1. Ajioka Y, Allison LJ, Jass JR. Significance of MUC1 and MUC2 mucin expression in colorectal cancer. J Clin Pathol. 1996;49:560–4. - PMC - PubMed