. 2018 Mar;31(3):10.1002/nbm.3864.
doi: 10.1002/nbm.3864. Epub 2017 Dec 29.

Investigation of the BOLD and CBV fMRI responses to somatosensory stimulation in awake marmosets (Callithrix jacchus)

Affiliations

Investigation of the BOLD and CBV fMRI responses to somatosensory stimulation in awake marmosets (Callithrix jacchus)

Yoshiyuki Hirano et al. NMR Biomed. 2018 Mar.

Abstract

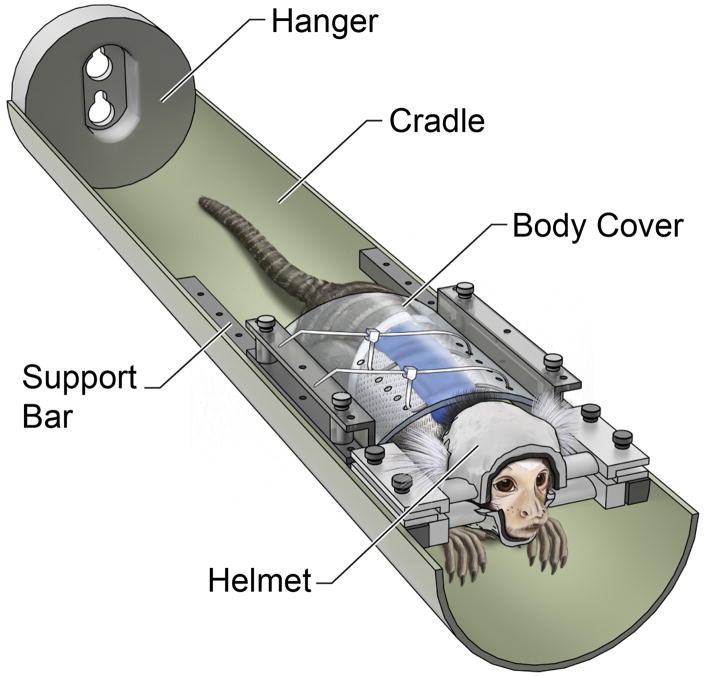
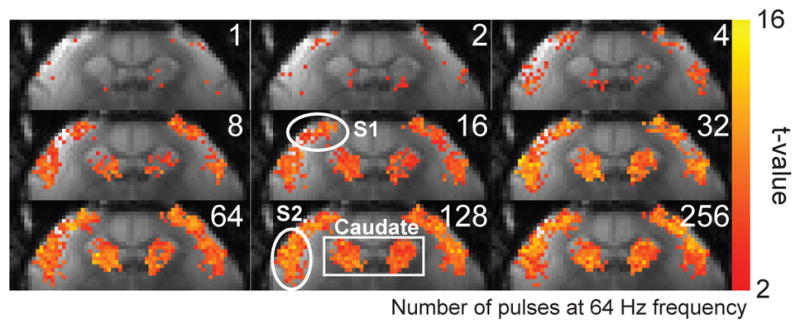
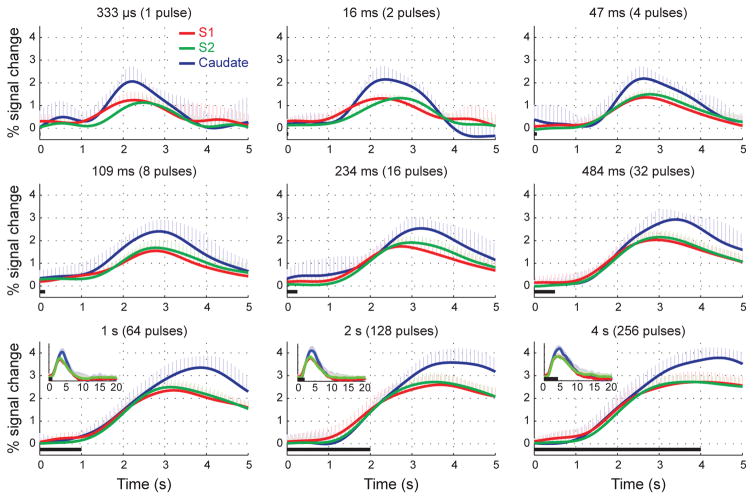
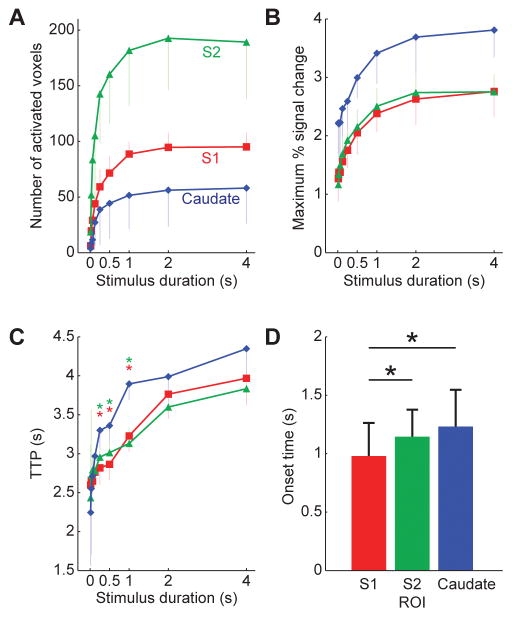
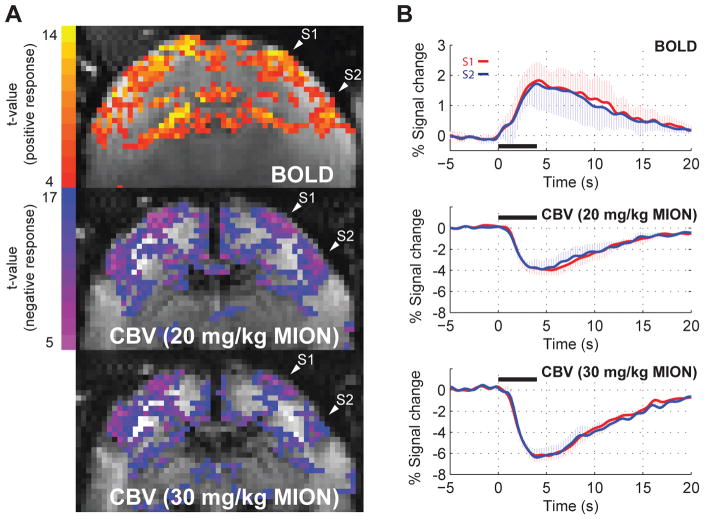
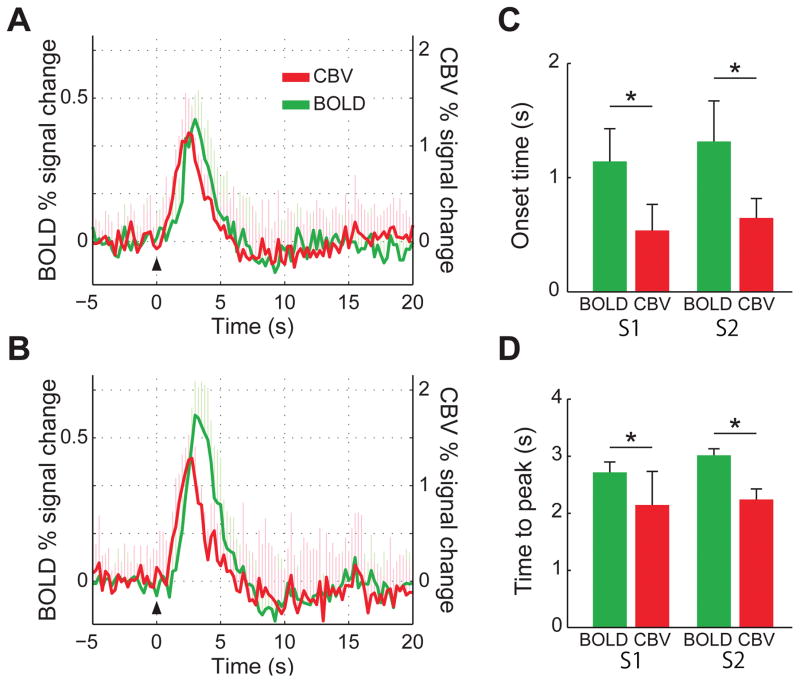
Understanding the spatiotemporal features of the hemodynamic response function (HRF) to brain stimulation is essential for the correct application of neuroimaging methods to study brain function. Here, we investigated the spatiotemporal evolution of the blood oxygen level-dependent (BOLD) and cerebral blood volume (CBV) HRF in conscious, awake marmosets (Callithrix jacchus), a New World non-human primate with a lissencephalic brain and with growing use in biomedical research. The marmosets were acclimatized to head fixation and placed in a 7-T magnetic resonance imaging (MRI) scanner. Somatosensory stimulation (333-μs pulses; amplitude, 2 mA; 64 Hz) was delivered bilaterally via pairs of contact electrodes. A block design paradigm was used in which the stimulus duration increased in pseudo-random order from a single pulse up to 256 electrical pulses (4 s). For CBV measurements, 30 mg/kg of ultrasmall superparamagnetic ironoxide particles (USPIO) injected intravenously, were used. Robust BOLD and CBV HRFs were obtained in the primary somatosensory cortex (S1), secondary somatosensory cortex (S2) and caudate at all stimulus conditions. In particular, BOLD and CBV responses to a single 333-μs-long stimulus were reliably measured, and the CBV HRF presented shorter onset time and time to peak than the BOLD HRF. Both the size of the regions of activation and the peak amplitude of the HRFs grew quickly with increasing stimulus duration, and saturated for stimulus durations greater than 1 s. Onset times in S1 and S2 were faster than in caudate. Finally, the fine spatiotemporal features of the HRF in awake marmosets were similar to those obtained in humans, indicating that the continued refinement of awake non-human primate models is essential to maximize the applicability of animal functional MRI studies to the investigation of human brain function.

Keywords: bold; cerebral blood volume; functional neuroimaging; neurovascular coupling; non-human primate; somatosensory cortex.


Figures

Figure 1
Figure 1
(A) Illustration of the restraint setup used to train and to image marmosets. The animal wears a sleeveless jacket which is attached to a plastic back cover. The back cover is fastened to the sidebars on the cradle, preventing the animal from sliding out. At all times, the arms, legs, and tail of the animal are free to move. The head of the marmoset is secured by a two-piece, custom-built helmet made specifically for that individual. The chin piece on the bottom supports the chin of the animal, and the head piece on the top prevents head motion. Both helmet pieces are lined up with foam on the inside to provide a comfortable support to the entire head. The animal sits in the sphinx position looking out towards the back of the magnet. The bed is secured to the bed sliding mechanism on one end via the hanger.
Figure 2
Figure 2
(A) BOLD activation maps from a representative marmoset at different stimulus durations. Robust activation in response to bilateral somatosensory stimulation (2 mA amplitude, 333 μs pulses, 64 Hz) was observed in S1, S2 and caudate. The regions of activation in S1 and S2 grew with stimulus durations of up to 64 pulses (1 s). In caudate, the region of activation grew with stimulus durations of up to 32 pulses (0.5 s).
Figure 3
Figure 3
Time-courses of the BOLD HRF to stimuli of increasing durations, averaged across subjects. Robust BOLD HRFs were obtained in S1, S2 and Caudate for all stimulus durations. The caudate region presented the strongest BOLD response, while S1 and S2 presented equivalent peak amplitudes. In all regions, the amplitude of the BOLD HRF grew with stimulus durations up to 1 s, and saturated in response to stimuli of longer durations. Error bars = 1 std. dev.
Figure 4
Figure 4
(A) Plot of the mean growth in the size of the regions of activation in S1, S2, and caudate with stimulus duration, averaged across all five subjects. (B) Plot of the peak amplitude of the BOLD HRF in S1, S2, and caudate with stimulus duration, averaged across all five subjects. There was a monotonic increase of the number of active voxels and peak amplitude with stimulus durations up to 1s, and saturation for longer stimuli. (C) Plot of the time-to-peak (TTP) in S1, S2 and caudate with stimulus duration, averaged across subjects. The caudate region presented the highest BOLD amplitude and the longest TTPs at all stimulus durations. (D) The mean onset-time (OT) for each of the 3 regions, averaged across subjects. *P < 0.05, one-way ANOVA followed by Scheffe post hoc test.
Figure 5
Figure 5
(A) BOLD (top) and CBV t-score functional maps obtained at two different doses of MION (middle: 20 mg/kg; bottom: 30 mg/kg) in response to a 4 s stimulus duration. Robust BOLD and CBV activations were observed in S1, S2 and caudate. However, caudate showed no CBV activation at either dosage of MION. (B) Mean BOLD HRF (top graph) and mean CBV HRFs obtained with the lower dose (middle graph) and the higher dose of USPIO (bottom graph), in response to a 4 s stimulus, averaged across all five subjects. A stronger CBV response was observed at the higher dose of 30 mg/kg. Error bars = 1 std. dev. *P < 0.05.
Figure 6
Figure 6
(A) Mean BOLD (green) and CBV (red) HRF to a single 333 μs-long stimulus, measured in S1 and averaged across all five subjects. (B) Mean BOLD (green) and CBV (red) HRF to a single 333 μs-long stimulus, measured in S2 and averaged across all five subjects. (C) Mean onset times (OT) for BOLD (green) and CBV (red) in S1 and S2, averaged across all five subjects. (D) Mean times-to-peak (TTP) for BOLD (green) and CBV (red) in S1 and S2, averaged across all five subjects. In both regions, CBV had significantly shorter OT and TTP than BOLD. Error bars = 1 std. dev. *P < 0.05.

Similar articles

Cited by

References

    1. Bandettini PA, Jesmanowicz A, Wong EC, Hyde JS. Processing strategies for time-course data sets in functional MRI of the human brain. Magnetic resonance in medicine : official journal of the Society of Magnetic Resonance in Medicine/Society of Magnetic Resonance in Medicine. 1993;30(2):161–173. - PubMed
    1. Friston KJ, Holmes AP, Poline JB, et al. Analysis of fMRI time-series revisited. NeuroImage. 1995;2(1):45–53. - PubMed
    1. Duvernoy HM, Delon S, Vannson JL. Cortical blood vessels of the human brain. Brain research bulletin. 1981;7(5):519–579. - PubMed
    1. Stefanovic B, Hutchinson E, Yakovleva V, et al. Functional reactivity of cerebral capillaries. Journal of cerebral blood flow and metabolism : official journal of the International Society of Cerebral Blood Flow and Metabolism. 2008;28(5):961–972. - PMC - PubMed
    1. Tian P, Teng IC, May LD, et al. Cortical depth-specific microvascular dilation underlies laminar differences in blood oxygenation level-dependent functional MRI signal. Proceedings of the National Academy of Sciences of the United States of America. 2010;107(34):15246–15251. - PMC - PubMed

Publication types

LinkOut - more resources