Clinical Trial
. 2018 Mar;52(3):656-678.
doi: 10.3892/ijo.2017.4233. Epub 2017 Dec 28.

Gene expression profiling of acute myeloid leukemia samples from adult patients with AML-M1 and -M2 through boutique microarrays, real-time PCR and droplet digital PCR

Affiliations
Clinical Trial

Gene expression profiling of acute myeloid leukemia samples from adult patients with AML-M1 and -M2 through boutique microarrays, real-time PCR and droplet digital PCR

Luiza Handschuh et al. Int J Oncol. 2018 Mar.

Abstract

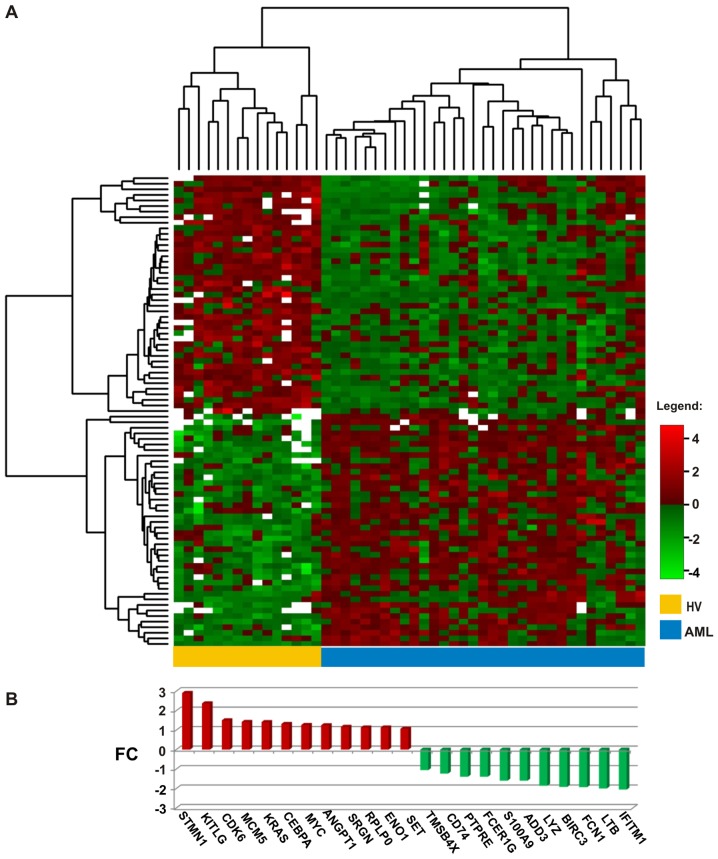
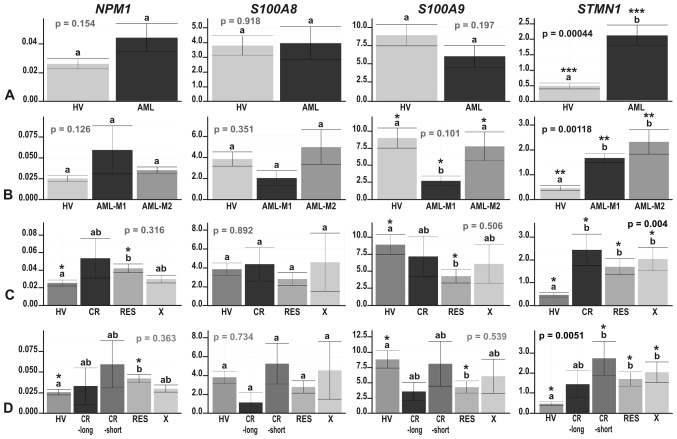
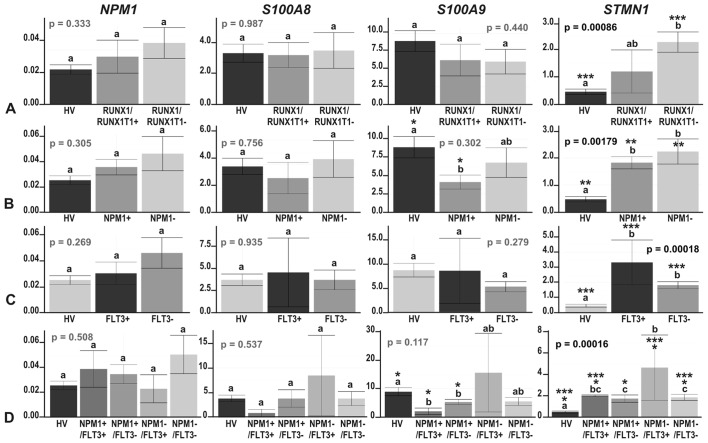
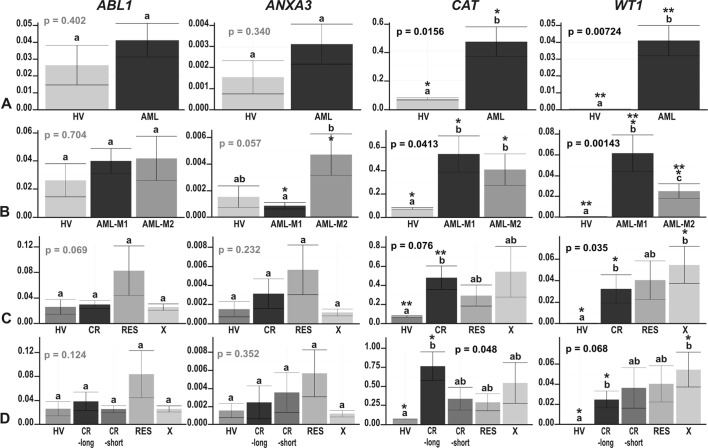
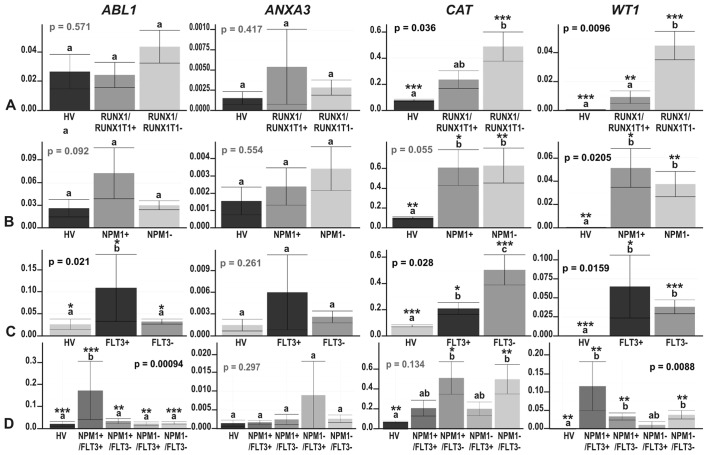
Acute myeloid leukemia (AML) is the most common and severe form of acute leukemia diagnosed in adults. Owing to its heterogeneity, AML is divided into classes associated with different treatment outcomes and specific gene expression profiles. Based on previous studies on AML, in this study, we designed and generated an AML-array containing 900 oligonucleotide probes complementary to human genes implicated in hematopoietic cell differentiation and maturation, proliferation, apoptosis and leukemic transformation. The AML-array was used to hybridize 118 samples from 33 patients with AML of the M1 and M2 subtypes of the French-American‑British (FAB) classification and 15 healthy volunteers (HV). Rigorous analysis of the microarray data revealed that 83 genes were differentially expressed between the patients with AML and the HV, including genes not yet discussed in the context of AML pathogenesis. The most overexpressed genes in AML were STMN1, KITLG, CDK6, MCM5, KRAS, CEBPA, MYC, ANGPT1, SRGN, RPLP0, ENO1 and SET, whereas the most underexpressed genes were IFITM1, LTB, FCN1, BIRC3, LYZ, ADD3, S100A9, FCER1G, PTRPE, CD74 and TMSB4X. The overexpression of the CPA3 gene was specific for AML with mutated NPM1 and FLT3. Although the microarray-based method was insufficient to differentiate between any other AML subgroups, quantitative PCR approaches enabled us to identify 3 genes (ANXA3, S100A9 and WT1) whose expression can be used to discriminate between the 2 studied AML FAB subtypes. The expression levels of the ANXA3 and S100A9 genes were increased, whereas those of WT1 were decreased in the AML-M2 compared to the AML-M1 group. We also examined the association between the STMN1, CAT and ABL1 genes, and the FLT3 and NPM1 mutation status. FLT3+/NPM1- AML was associated with the highest expression of STMN1, and ABL1 was upregulated in FLT3+ AML and CAT in FLT3- AML, irrespectively of the NPM1 mutation status. Moreover, our results indicated that CAT and WT1 gene expression levels correlated with the response to therapy. CAT expression was highest in patients who remained longer under complete remission, whereas WT1 expression increased with treatment resistance. On the whole, this study demonstrates that the AML-array can potentially serve as a first-line screening tool, and may be helpful for the diagnosis of AML, whereas the differentiation between AML subgroups can be more successfully performed with PCR-based analysis of a few marker genes.


Conflict of interest statement

Competing interests

The authors declare that they have no competing interests.

Figures

Figure 1
Figure 1
(A) Heatmap presenting the normalized log2 expression values of 83 genes (horizontally) selected as being over- or underexpressed in acute myeloid leukemia (AML) when compared with healthy volunteers (HV) samples (vertically) with the adjusted p-value threshold of 0.01. Two dendrograms represent the results of clustering: Genes (left side of the heatmap) and samples (above the heatmap). White points mean missing values, referring to the probes with weight 0 that were excluded from the analysis because of poor quality. (B) Changes in the expression (log2FC values) of 23 genes selected as the most overexpressed (red) or underexpressed (green) in AML compared with the HV samples. The genes are ranked according to the log2FC value.
Figure 2
Figure 2
Heatmaps presenting the normalized log2 expression values of all acute myeloid leukemia (AML)-array genes (horizontally) in all studied samples, (A) AML and healthy volunteers (HV), and (B) only in AML samples, excluding HV. Dendrograms represent the results of clustering: Genes (left side of the heatmap) and samples (above the heatmap). White points indicate missing values, referring to the probes with weight 0 that were excluded from the analysis because of poor quality. (A) Reveals the existence of outlier samples (first sample from the right and three samples from the left) and two major clusters (in the middle), with all HV samples collected at the left side of a heatmap. (B) Shows general homogeneity of AML samples. No clear sample clusters cannot be distinguished.
Figure 3
Figure 3
The results of real-time PCR-based expression analysis of 4 genes (NPM1, S100A8, S100A9 and STMN1) in (A) acute myeloid leukemia (AML) compared with healthy volunteers (HV) samples; (B) in the context of the AML French-American-British (FAB) subtypes, M1 and M2; and in the context of the response to therapy, with the AML divided into (C) 3 (CR, RES, X) subgroups or (D) 4 subgroups (CR_long, CR_short, RES, X). The y-axes show relative expression values of a studied gene compared to the reference genes. Each plot contains the ANOVA p-value obtained for a whole test. Pair-wise comparisons with statistically significant differences, verified with a t-test and HSD Tukey test, are indicated by letters and asterisk symbols above each bar. Bars showing the same letter indicate no significant difference (p>0.05). The numbers of asterisks denote the level of statistical significance: *p≤0.05, **p≤0.01 and ***p≤0.001.
Figure 4
Figure 4
The results of real-time PCR-based expression analysis of 4 genes (NPM1, S100A8, S100A9 and STMN1) in acute myeloid leukemia (AML) compared with healthy volunteers (HV) samples, with the AML divided according to the mutation status of (A) RUNX1/RUNX1T1; (B) NPM1; (C) FLT3; and (D) NPM1 and FLT3 together. The y-axes show relative expression values of a studied gene compared to the reference genes. Each plot contains the ANOVA p-value obtained for a whole test. Pair-wise comparisons with statistically significant differences, verified with a t-test and HSD Tukey test, are indicated by letters and asterisk symbols above each bar. Bars showing the same letter indicate no significant difference (p>0.05). The numbers of asterisks denote the level of statistical significance: *p≤0.05, **p≤0.01 and ***p≤0.001.
Figure 5
Figure 5
The results of ddPCR-based expression analysis of 4 genes (ABL1, ANXA3, CAT and WT1) in (A) acute myeloid leukemia (AML) compared with healthy volunteers (HV) samples; (B) in the context of the AML French-American-British (FAB) subtypes, M1 and M2; and in the context of the response to therapy, with the AML divided into (C) 3 (CR, RES, X) subgroups or (D) 4 subgroups (CR_long, CR_short, RES, X). The y-axes show relative expression values of a studied gene compared to a reference gene. Each plot contains the ANOVA p-value obtained for a whole test. Pair-wise comparisons with statistically significant differences, verified with a t-test and HSD Tukey test, are indicated by letters and asterisk symbols above each bar. Bars showing the same letter indicate no significant difference (p>0.05). The numbers of asterisks denote the level of statistical significance: *p≤0.05 and **p≤0.01.
Figure 6
Figure 6
The results of ddPCR-based expression analysis of 4 genes (ABL1, ANXA3, CAT and WT1) in acute myeloid leukemia (AML) compared with healthy volunteers (HV) samples, with the AML divided according to the mutation status of (A) RUNX1/RUNX1T1; (B) NPM1; (C) FLT3; and (D) NPM1 and FLT3 together. The y-axes show relative expression values of a studied gene compared to a reference gene. Each plot contains the ANOVA p-value obtained for a whole test. Pair-wise comparisons with statistically significant differences, verified with a t-test and HSD Tukey test, are indicated by letters and asterisk symbols above each bar. Bars showing the same letter indicate no significant difference (p>0.05). The numbers of asterisks denote the level of statistical significance: *p≤0.05, **p≤0.01 and ***p≤0.001.

Similar articles

Cited by

References

    1. Estey E, Döhner H. Acute myeloid leukaemia. Lancet. 2006;368:1894–1907. doi: 10.1016/S0140-6736(06)69780-8. - DOI - PubMed
    1. Döhner H, Estey EH, Amadori S, Appelbaum FR, Büchner T, Burnett AK, Dombret H, Fenaux P, Grimwade D, Larson RA, et al. European LeukemiaNet Diagnosis and management of acute myeloid leukemia in adults: Recommendations from an international expert panel, on behalf of the European LeukemiaNet. Blood. 2010;115:453–474. doi: 10.1182/blood-2009-07-235358. - DOI - PubMed
    1. Bennett JM, Catovsky D, Daniel MT, Flandrin G, Galton DA, Gralnick HR, Sultan C. Proposed revised criteria for the classification of acute myeloid leukemia. A report of the French-American-British Cooperative Group. Ann Intern Med. 1985;103:620–625. doi: 10.7326/0003-4819-103-4-620. - DOI - PubMed
    1. Vardiman JW, Thiele J, Arber DA, Brunning RD, Borowitz MJ, Porwit A, Harris NL, Le Beau MM, Hellström-Lindberg E, Tefferi A, et al. The 2008 revision of the World Health Organization (WHO) classification of myeloid neoplasms and acute leukemia: Rationale and important changes. Blood. 2009;114:937–951. doi: 10.1182/blood-2009-03-209262. - DOI - PubMed
    1. Döhner H. Hematology Am Soc Hematol Educ Program. Washington, DC: 2007. Implication of the molecular characterization of acute myeloid leukemia; pp. 412–419. - PubMed

MeSH terms