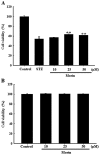
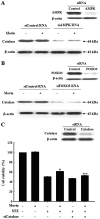
Amelioration of streptozotocin‑induced pancreatic β cell damage by morin: Involvement of the AMPK‑FOXO3‑catalase signaling pathway
- PMID: 29286118
- PMCID: PMC5819920
- DOI: 10.3892/ijmm.2017.3357
Amelioration of streptozotocin‑induced pancreatic β cell damage by morin: Involvement of the AMPK‑FOXO3‑catalase signaling pathway
Abstract
Pancreatic β cells are sensitive to oxidative stress, which is one of the predominant causes of cell damage and the emergence of diabetes. The identification of effective therapeutic strategies to protect pancreatic cells from oxidative stress has increased interest in the screening of antioxidants from natural products. The present study aimed to investigate the protective effects of morin against streptozotocin (STZ)‑induced cell damage in a rat insulinoma cell line (RINm5F pancreatic β cells) and to identify the underlying mechanisms. The results indicated that morin inhibited the increase in intracellular reactive oxygen species, attenuated the activity of poly (ADP‑ribose) polymerase, restored intracellular nicotinamide adenine dinucleotide levels and reduced the apoptotic cell death of STZ‑treated pancreatic β cells. Treatment with morin significantly upregulated catalase in pancreatic β cells, and ameliorated the STZ‑induced loss of catalase at the genetic, protein and enzymatic level. In further experiments, morin induced the phosphorylation of 5' adenosine monophosphate‑activated protein kinase (AMPK), which subsequently promoted the translocation of forkhead box O3 (FOXO3) to the nucleus. Specific small interfering RNAs (siRNAs) against AMPK and FOXO3 suppressed morin‑induced catalase expression. Furthermore, catalase‑specific siRNA abolished the protective effects of morin against STZ‑stimulated cell death. Taken together, these results indicated that morin protected RINm5F cells from STZ‑induced cell damage by triggering the phosphorylation of AMPK, thus resulting in subsequent activation of FOXO3 and induction of catalase.
Figures


Similar articles
-
Morin activates the Nrf2-ARE pathway and reduces oxidative stress-induced DNA damage in pancreatic beta cells.Eur J Pharmacol. 2017 Apr 15;801:9-18. doi: 10.1016/j.ejphar.2017.02.026. Epub 2017 Feb 16. Eur J Pharmacol. 2017. PMID: 28216051
-
Octaphlorethol A, a novel phenolic compound isolated from Ishige foliacea, protects against streptozotocin-induced pancreatic β cell damage by reducing oxidative stress and apoptosis.Food Chem Toxicol. 2013 Sep;59:643-9. doi: 10.1016/j.fct.2013.07.011. Epub 2013 Jul 16. Food Chem Toxicol. 2013. PMID: 23871829
-
Lentinan protects pancreatic β cells from STZ-induced damage.J Cell Mol Med. 2016 Oct;20(10):1803-12. doi: 10.1111/jcmm.12865. Epub 2016 Jul 22. J Cell Mol Med. 2016. PMID: 27444655 Free PMC article.
-
Diabetic complications within the context of aging: Nicotinamide adenine dinucleotide redox, insulin C-peptide, sirtuin 1-liver kinase B1-adenosine monophosphate-activated protein kinase positive feedback and forkhead box O3.J Diabetes Investig. 2016 Jul;7(4):448-58. doi: 10.1111/jdi.12485. Epub 2016 Mar 14. J Diabetes Investig. 2016. PMID: 27181414 Free PMC article. Review.
-
Streptozotocin-nicotinamide-induced diabetes in the rat. Characteristics of the experimental model.Exp Biol Med (Maywood). 2012 May;237(5):481-90. doi: 10.1258/ebm.2012.011372. Epub 2012 May 22. Exp Biol Med (Maywood). 2012. PMID: 22619373 Review.
Cited by
-
Age-related expression of prominent regulatory elements in mouse brain: catastrophic decline of FOXO3a.Geroscience. 2021 Aug;43(4):1935-1946. doi: 10.1007/s11357-021-00364-8. Epub 2021 Apr 17. Geroscience. 2021. PMID: 33864227 Free PMC article.
-
Evaluation of the Antidiabetic Potential of Extracts of Urtica dioica, Apium graveolens, and Zingiber officinale in Mice, Zebrafish, and Pancreatic β-Cell.Plants (Basel). 2021 Jul 14;10(7):1438. doi: 10.3390/plants10071438. Plants (Basel). 2021. PMID: 34371645 Free PMC article.
-
Pancreatic β-cell dysfunction in type 2 diabetes: Implications of inflammation and oxidative stress.World J Diabetes. 2023 Mar 15;14(3):130-146. doi: 10.4239/wjd.v14.i3.130. World J Diabetes. 2023. PMID: 37035220 Free PMC article. Review.
-
Effect of Oleanolic acid administration on hepatic AMPK, SIRT-1, IL-6 and NF-κB levels in experimental diabetes.J Diabetes Metab Disord. 2023 Jan 28;22(1):581-590. doi: 10.1007/s40200-022-01178-x. eCollection 2023 Jun. J Diabetes Metab Disord. 2023. PMID: 37255809 Free PMC article.
-
miR-629 targets FOXO3 to promote cell apoptosis in gastric cancer.Exp Ther Med. 2020 Jan;19(1):294-300. doi: 10.3892/etm.2019.8168. Epub 2019 Nov 6. Exp Ther Med. 2020. PMID: 31853302 Free PMC article.
References
-
- Mishra V. Oxidative stress and role of antioxidant supplementation in critical illness. Clin Lab. 2007;53:199–209. - PubMed
MeSH terms
Substances
LinkOut - more resources
Full Text Sources
Other Literature Sources
Research Materials

