Postnatal lethality and chondrodysplasia in mice lacking both chondroitin sulfate N-acetylgalactosaminyltransferase-1 and -2
- PMID: 29287114
- PMCID: PMC5747463
- DOI: 10.1371/journal.pone.0190333
Postnatal lethality and chondrodysplasia in mice lacking both chondroitin sulfate N-acetylgalactosaminyltransferase-1 and -2
Abstract
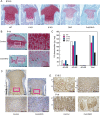
Chondroitin sulfate (CS) is a sulfated glycosaminoglycan (GAG) chain. In cartilage, CS plays important roles as the main component of the extracellular matrix (ECM), existing as side chains of the major cartilage proteoglycan, aggrecan. Six glycosyltransferases are known to coordinately synthesize the backbone structure of CS; however, their in vivo synthetic mechanism remains unknown. Previous studies have suggested that two glycosyltransferases, Csgalnact1 (t1) and Csgalnact2 (t2), are critical for initiation of CS synthesis in vitro. Indeed, t1 single knockout mice (t1 KO) exhibit slight dwarfism and a reduction in CS content in cartilage compared with wild-type (WT) mice. To reveal the synergetic roles of t1 and t2 in CS synthesis in vivo, we generated systemic single and double knockout (DKO) mice and cartilage-specific t1 and t2 double knockout (Col2-DKO) mice. DKO mice exhibited postnatal lethality, whereas t2 KO mice showed normal size and skeletal development. Col2-DKO mice survived to adulthood and showed severe dwarfism compared with t1 KO mice. Histological analysis of epiphyseal cartilage from Col2-DKO mice revealed disrupted endochondral ossification, characterized by drastic GAG reduction in the ECM. Moreover, DKO cartilage had reduced chondrocyte proliferation and an increased number of apoptotic chondrocytes compared with WT cartilage. Conversely, primary chondrocyte cultures from Col2-DKO knee cartilage had the same proliferation rate as WT chondrocytes and low GAG expression levels, indicating that the chondrocytes themselves had an intact proliferative ability. Quantitative RT-PCR analysis of E18.5 cartilage showed that the expression levels of Col2a1 and Ptch1 transcripts tended to decrease in DKO compared with those in WT mice. The CS content in DKO cartilage was decreased compared with that in t1 KO cartilage but was not completely absent. These results suggest that aberrant ECM caused by CS reduction disrupted endochondral ossification. Overall, we propose that both t1 and t2 are necessary for CS synthesis and normal chondrocyte differentiation but are not sufficient for all CS synthesis in cartilage.
Conflict of interest statement
Figures


Similar articles
-
Chondroitin sulfate N-acetylgalactosaminyltransferase 1 is necessary for normal endochondral ossification and aggrecan metabolism.J Biol Chem. 2011 Feb 18;286(7):5803-12. doi: 10.1074/jbc.M110.159244. Epub 2010 Dec 10. J Biol Chem. 2011. PMID: 21148564 Free PMC article.
-
Overexpression of Galnt3 in chondrocytes resulted in dwarfism due to the increase of mucin-type O-glycans and reduction of glycosaminoglycans.J Biol Chem. 2014 Sep 19;289(38):26584-26596. doi: 10.1074/jbc.M114.555987. Epub 2014 Aug 8. J Biol Chem. 2014. PMID: 25107907 Free PMC article.
-
Craniofacial abnormality with skeletal dysplasia in mice lacking chondroitin sulfate N-acetylgalactosaminyltransferase-1.Sci Rep. 2018 Nov 20;8(1):17134. doi: 10.1038/s41598-018-35412-5. Sci Rep. 2018. PMID: 30459452 Free PMC article.
-
Chondrodysplasia of gene knockout mice for aggrecan and link protein.Glycoconj J. 2002 May-Jun;19(4-5):269-73. doi: 10.1023/A:1025344332099. Glycoconj J. 2002. PMID: 12975605 Review.
-
Roles of CSGalNAcT1, a key enzyme in regulation of CS synthesis, in neuronal regeneration and plasticity.Neurochem Int. 2018 Oct;119:77-83. doi: 10.1016/j.neuint.2017.10.001. Epub 2017 Oct 5. Neurochem Int. 2018. PMID: 28987564 Review.
Cited by
-
An Overview of in vivo Functions of Chondroitin Sulfate and Dermatan Sulfate Revealed by Their Deficient Mice.Front Cell Dev Biol. 2021 Nov 24;9:764781. doi: 10.3389/fcell.2021.764781. eCollection 2021. Front Cell Dev Biol. 2021. PMID: 34901009 Free PMC article. Review.
-
Proteoglycans and Glycosaminoglycans in Stem Cell Homeostasis and Bone Tissue Regeneration.Front Cell Dev Biol. 2021 Nov 30;9:760532. doi: 10.3389/fcell.2021.760532. eCollection 2021. Front Cell Dev Biol. 2021. PMID: 34917612 Free PMC article. Review.
-
RNA-seq reveals downregulated osteochondral genes potentially related to tibia bacterial chondronecrosis with osteomyelitis in broilers.BMC Genet. 2020 Jun 3;21(1):58. doi: 10.1186/s12863-020-00862-2. BMC Genet. 2020. PMID: 32493207 Free PMC article.
-
Aggrecan and Hyaluronan: The Infamous Cartilage Polyelectrolytes - Then and Now.Adv Exp Med Biol. 2023;1402:3-29. doi: 10.1007/978-3-031-25588-5_1. Adv Exp Med Biol. 2023. PMID: 37052843
-
The Progress in Molecular Transport and Therapeutic Development in Human Blood-Brain Barrier Models in Neurological Disorders.Cell Mol Neurobiol. 2024 Apr 16;44(1):34. doi: 10.1007/s10571-024-01473-6. Cell Mol Neurobiol. 2024. PMID: 38627312 Free PMC article. Review.
References
-
- Watanabe H, Yamada Y, Kimata K. Roles of aggrecan, a large chondroitin sulfate proteoglycan, in cartilage structure and function. J Biochem. 1998; 124: 687–693. - PubMed
-
- Dityatev A, Bruckner G, Dityateva G, Grosche J, Kleene R, Schachner M. Activity-dependent formation and functions of chondroitin sulfate-rich extracellular matrix of perineuronal nets. Dev Neurobiol. 2007; 67: 570–588. doi: 10.1002/dneu.20361 - DOI - PubMed
-
- Karetko M, Skangiel-Kramska J. Diverse functions of perineuronal nets. Acta Neurobiol Exp (Wars). 200; 69: 564–577. - PubMed
-
- Beurdeley M, Spatazza J, Lee HH, Sugiyama S, Bernard C, Di Nardo AA, et al. Otx2 binding to perineuronal nets persistently regulates plasticity in the mature visual cortex. J Neurosci. 2012; 32: 9429–9437. doi: 10.1523/JNEUROSCI.0394-12.2012 - DOI - PMC - PubMed
-
- Kudo T, Sato T, Hagiwara K, Kozuma Y, Yamaguchi T, Ikehara Y, et al. C1galt1-deficient mice exhibit thrombocytopenia due to abnormal terminal differentiation of megakaryocytes. Blood. 2013; 122: 1649–1657. doi: 10.1182/blood-2012-12-471102 - DOI - PubMed
Publication types
MeSH terms
Substances
LinkOut - more resources
Full Text Sources
Other Literature Sources
Molecular Biology Databases
Research Materials

