. 2018 Feb 1:134-135:164-176.
doi: 10.1016/j.ymeth.2017.12.015. Epub 2017 Dec 27.

High throughput automated analysis of big flow cytometry data

Affiliations

High throughput automated analysis of big flow cytometry data

Albina Rahim et al. Methods. .

Abstract

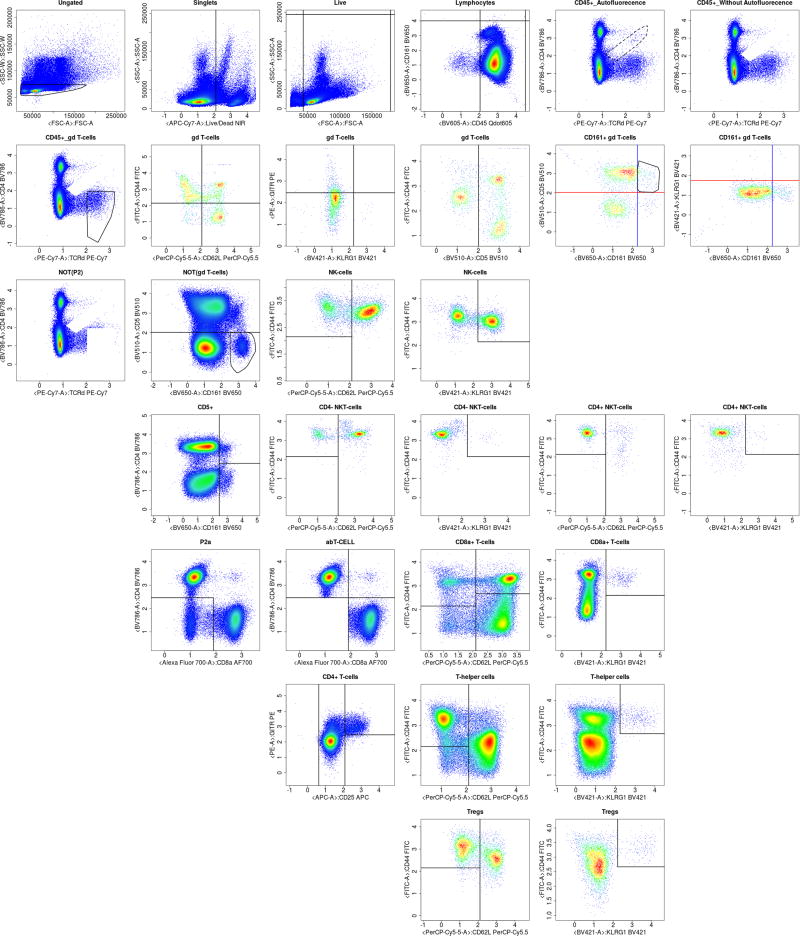
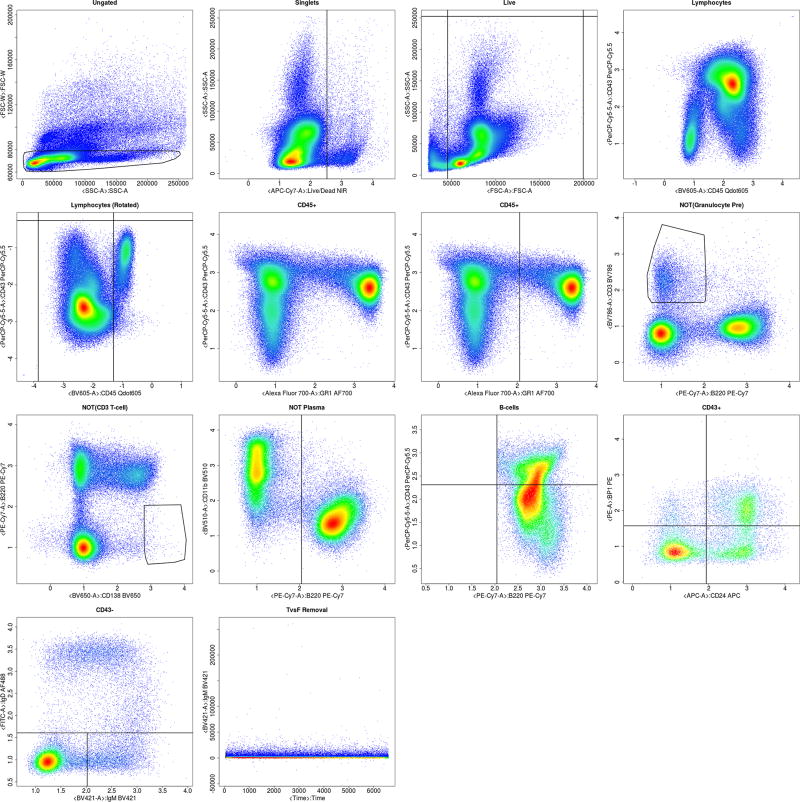
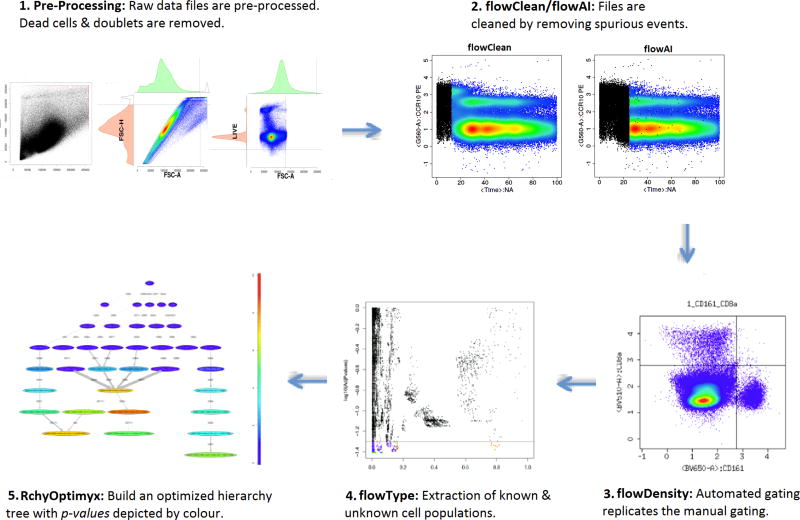
The rapid expansion of flow cytometry applications has outpaced the functionality of traditional manual analysis tools used to interpret flow cytometry data. Scientists are faced with the daunting prospect of manually identifying interesting cell populations in 50-dimensional datasets, equalling the complexity previously only reached in mass cytometry. Data can no longer be analyzed or interpreted fully by manual approaches. While automated gating has been the focus of intense efforts, there are many significant additional steps to the analytical pipeline (e.g., cleaning the raw files, event outlier detection, extracting immunophenotypes). We review the components of a customized automated analysis pipeline that can be generally applied to large scale flow cytometry data. We demonstrate these methodologies on data collected by the International Mouse Phenotyping Consortium (IMPC).

Keywords: Automated analysis; Bioinformatics; Flow cytometry.


Figures

Figure A.15
Figure A.15
Complete automated gating of a sample WTSI & KCL T cell spleen organ data.
Figure A.16
Figure A.16
Complete automated gating of a sample WTSI & KCL bone marrow data.
Figure A.17
Figure A.17
Automated gating compared to manual gating reduced variations seen over time. Hardy Fractions population from the WTSI & KCL bone marrow dataset.
Figure 1
Figure 1
A typical R based automated analysis pipeline. 1. Raw data files are pre-processed where dead cells and doublets are removed. 2. flowClean or flowAI is used to clean the data by removing spurious events. 3. Automated gating replicates the manual gating using flowDensity [6]. flowDensity identifies predefined cell subsets based on the density distribution of the parent cell population. It estimates the region around each cell population using characteristics of the marker density distribution. 4. Extraction of known and unknown cell populations uses flowType [7], where all channels are thresholded into positive, negative, and neutral populations. 5. In the last step once the significant immunophenotypes are extracted, RchyOptimyx [8] is used to build an optimized hierarchy tree showing only significant gating pathways with p-value depicted by colour.
Figure 2
Figure 2
The pre-processing of the FCS files removing dead cells and doublets. The step starts with raw and unprocessed cells (2A). Dead cells and doublets are next removed (2B), thus resulting in cells (2C) ready for processing in the next step in the pipeline (quality checking).
Figure 3
Figure 3
Quality check using flowClean to identify anomalous events clean the data. This is an FCS file downloaded from FlowRepository.org [14].
Figure 4
Figure 4
Quality check using flowAI to identify anomalous events and clean the data. This is the same FCS file shown in Figure 3 downloaded from FlowRepository.org.
Figure 5
Figure 5
Automated gating using flowDensity, which identifies predefined cell subsets based on the density distribution of the parent cell population.
Figure 6
Figure 6
2D plots generated after running Code Parts 01–03. deGate() of flowDensity is used to generate the gating thresholds which are used for gating the ungated population to extract the singlets population in 6A. Singlets are then further gated by using the gating threshold of the Live/Dead channel to obtain the Live population in 6B. In 6C, the Live population is gated by using the thresholds of the channels FSC-A and SSC-A, generated by deGate() to extract the lymphocyte population.
Figure 7
Figure 7
flowDensity automated gating of populations in bi-variate plots, similar to what is seen in manual gating. The gates of flowDensity move objectively as the population moves. The gating thresholds of the CD43 and CD45 markers changes as the distribution and density of the lymphocyte population changes from one sample to another, thus gating the correct CD45 population (6A). In addition, flowDensity can identify very rare cell populations (Plasma cells in 6B).
Figure 8
Figure 8
High dimensional biomarker discovery using flowType
Figure 9
Figure 9
A plot of log10(adjusted p-values) for a particular knockout vs the average proportion over all mice. The black horizontal line signifies the adjusted p-value of 0.05 (value of −log10(0.05) = 1.30) and any dots below this line colored as blue symbolizes significant cell populations, that is, populations with adjusted p-value < 0.05. The orange rings highlight the 15 populations with the largest effect size (that is, significant cell populations with the highest proportions). The green rings highlight the populations that have the lowest adjusted p-values.
Figure 10
Figure 10
Setting the threshold to a minimum of 200 cell counts for each population.
Figure 11
Figure 11
Optimized Cellular Hierarchy using RchyOptimix to visualize the most significant immunophenotypes.
Figure 12
Figure 12
High correlation between automated and manual results (aggregated spleen and bone marrow datasets of WTSI & KCL).
Figure 13
Figure 13
Comparison of coefficient of variations of automated versus manual results (WTSI & KCL bone marrow dataset).
Figure 14
Figure 14
Hit in an activated NK cell subset, identified by unsupervised analysis step and which has not been detected by manual analysis.

References

    1. Coppola M, Dolecki MN. [2017-09-27];BD Launches BD FACSymphony™ High-Speed Cell Analyzer to Enable Identification and Analysis of Rare Cell Types. 2016 http://www.bd.com/en-us/company/news-and-media/press-releases/feb-8-2016....
    1. Kvistborg P, Gouttefangeas C, Aghaeepour N, Cazaly A, Chattopadhyay PK, Chan C, Eckl J, Finak G, Hadrup SR, Maecker HT, et al. Thinking outside the gate: single-cell assessments in multiple dimensions. Immunity. 2015;42(4):591–592. - PMC - PubMed
    1. Bendall SC, Nolan GP, Roederer M, Chattopadhyay PK. A deep profiler’s guide to cytometry. Trends in immunology. 2012;33(7):323–332. - PMC - PubMed
    1. Roederer M, Brenchley J, Betts M, De Rosa S. Flow cytometric analysis of vaccine responses: how many colors are enough? Clinical Immunology. 2004;110(3):199–205. - PubMed
    1. [2017-09-11];The Adult and Embryonic Phenotype Pipeline. http://www.mousephenotype.org/impress.

Publication types