. 2018 Feb 1;200(3):1220-1226.
doi: 10.4049/jimmunol.1700886. Epub 2017 Dec 29.

Extracellular Lactate: A Novel Measure of T Cell Proliferation

Affiliations

Extracellular Lactate: A Novel Measure of T Cell Proliferation

James T Grist et al. J Immunol. .

Abstract

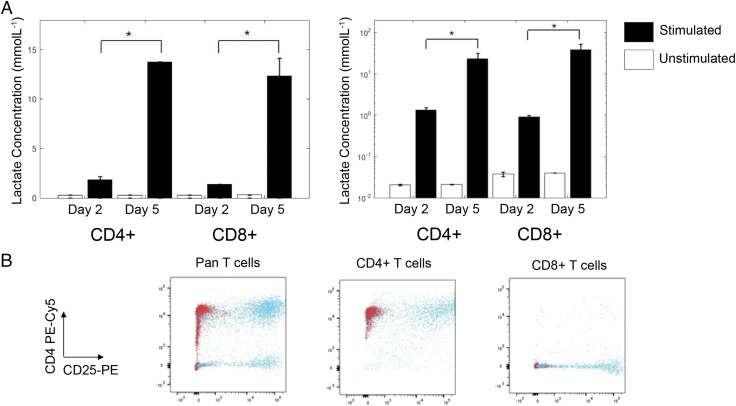
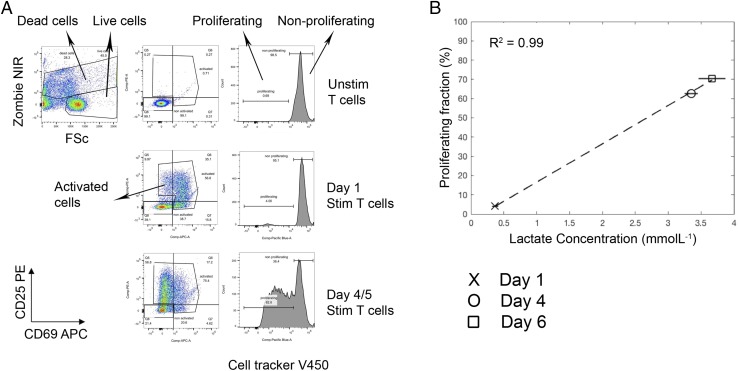
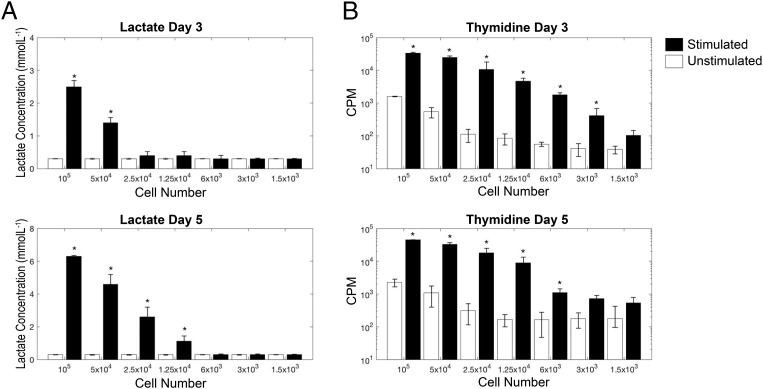
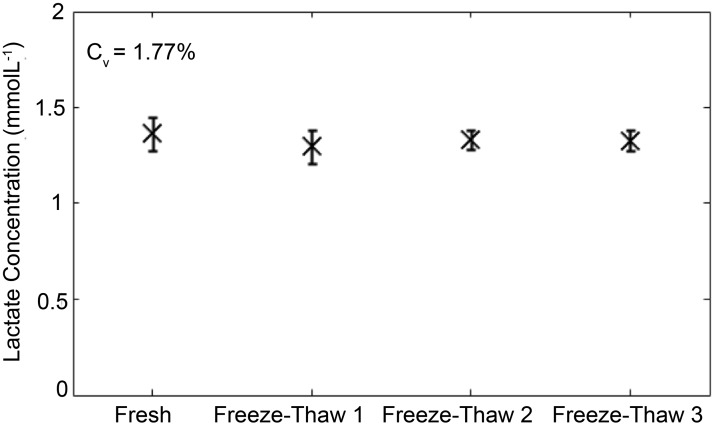
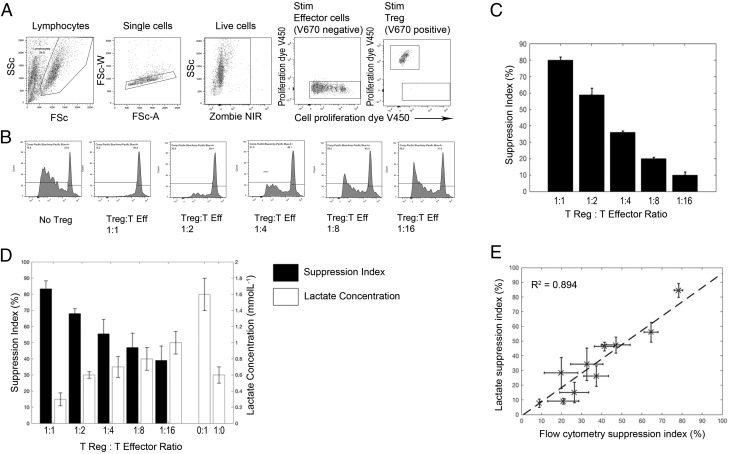
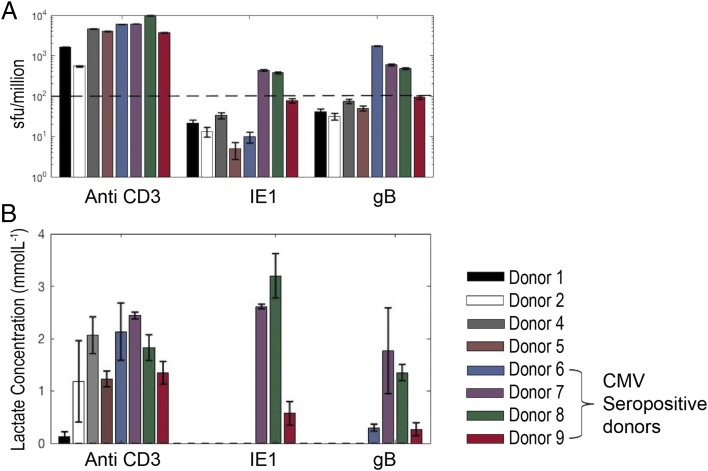
Following activation, T cells rapidly divide and acquire effector functions. This energetically demanding process depends upon the ability of T cells to undergo metabolic remodeling from oxidative phosphorylation to aerobic glycolysis, during which glucose is converted into lactate and released extracellularly. In this article, we demonstrate that extracellular lactate can be used to dynamically assess human T cell responses in vitro. Extracellular lactate levels strongly correlated with T cell proliferation, and measuring lactate compared favorably with traditional methods for determining T cell responses (i.e., [3H]thymidine incorporation and the use of cell proliferation dyes). Furthermore, we demonstrate the usefulness of measuring lactate as a read-out in conventional suppression assays and high-throughput peptide-screening assays. Extracellular lactate was stably produced over 7 d, and results were reproducibly performed over several freeze-thaw cycles. We conclude that the use of extracellular lactate measurements can be a sensitive, safe, stable, and easy-to-implement research tool for measuring T cell responses and cellular metabolic changes in vitro.


Figures

FIGURE 1.
FIGURE 1.
Extracellular lactate production by human T cells. (A) CD4+ and CD8+ T cells from two donors were cultured or not for 2 and 5 d with anti-CD3/CD28 Dynabeads, and supernatants were collected in triplicate for analysis of extracellular lactate. Lactate was normalized to viable cell number at each time point. (B) On day 5, the remaining cells were analyzed by flow cytometry for purity and activation status, as shown by CD4–PE–Cy5 versus CD25-PE staining. Red dots represent unstimulated cells, and blue dots represent stimulated cells. Unstimulated cell lactate output showed no change between days 2 and 5. *p < 0.01.
FIGURE 2.
FIGURE 2.
Increased total extracellular lactate correlates with increasing proliferation in stimulated T cell cultures. Cell proliferation dye V450–labeled T cells were cultured in the presence and absence of anti-CD3/CD28 Dynabeads for 6 d. At days 1, 4, and 6, cell culture supernatants were sampled for lactate analysis, and cells were analyzed by flow cytometry for proliferation status (cell proliferation dye dilution), as well as counterstained with dead cell marker (Zombie NIR) and Abs to CD69-allophycocyanin and CD25-PE. (A) The flow gating strategy: dead cells, activated cells, proliferating cells, and nonproliferating cells were gated. (B) Correlation of total extracellular lactate concentration with T cell proliferation.
FIGURE 3.
FIGURE 3.
Comparison of the extracellular lactate proliferation assay with the thymidine-incorporation proliferation assay. Whole PBMCs were stimulated, in triplicate, with plate-bound anti-CD3/soluble anti-CD28, and supernatants were collected for lactate analysis prior to pulsing cells with thymidine. To test for sensitivity of the assay, cell numbers were titrated from 105 cells per well to 500 cells per well. (A) Total lactate at days 3 and 5. (B) Incorporated thymidine (cpm) at days 3 and 5. Lactate data are shown on a linear scale, and thymidine data are shown on a log scale. *p < 0.05 versus unstimulated control.
FIGURE 4.
FIGURE 4.
Stability of lactate measurements. Extracellular lactate is stable over several freeze–thaw cycles. A total of 3 × 10⁶ Pan T cells was stimulated in a 24-well plate with anti-CD3/CD28 Dynabeads for 5 d, and 1 ml of supernatant was collected for analysis. Total lactate concentration is shown for the same cell culture supernatant that was repeatedly freeze–thawed.
FIGURE 5.
FIGURE 5.
Use of lactate in analyzing a Treg-suppression assay. Treg-suppression assays were performed by coculturing V450 cell proliferation dye–labeled CD4+ effector T cells with V670 cell proliferation–labeled CD4+CD25hiCD127low Tregs at a 1:1 ratio and doubling dilutions thereafter, in triplicate. (A) Flow gating strategy of this assay. Live V670 cells (non-Treg) were taken as effector cells. (B) V450 proliferation dye dilution of the effector T cells [gated in (A)], with and without Tregs. (C) Percentage suppression of the effector T cell response in the presence of Tregs was calculated (according to the given equation; see Materials and Methods); suppression by Tregs was titratable. (D) Amount of lactate produced by 104 effectors (0:1), 1 × 10⁴ Tregs (1:0), and 104 effectors cultured with various numbers of Tregs, corrected for the amount of lactate in the 1:0 well. The black bars represent the calculated lactate suppression index. (E) Combined data from three suppression assays, correlating the suppression index calculated by flow cytometry with that calculated by lactate.
FIGURE 6.
FIGURE 6.
Screening of blood donors for responses to CMV peptides. Data from PBMCs of eight healthy donors, cultured with soluble anti-CD3 or one of two different CMV peptide pools (IE1 and gB; 1 μg/ml). PBMCs were plated at 105 cells per well in triplicates in 96-well plates. (A) IFN-γ ELISPOT was performed at 48 h, and a mean spot-forming unit per million > 100 was taken as a positive response. Extracellular lactate was measured in cell culture supernatants at days 2 and 5. (B) Day-5 positive total lactate concentrations. All four seropositive donors were identified as responders to one or both peptides by both methods.

References

    1. Michalek R. D., Rathmell J. C. 2010. The metabolic life and times of a T-cell. Immunol. Rev. 236: 190–202. - PMC - PubMed
    1. Pearce E. L., Pearce E. J. 2014. Metabolic pathways in immune cell activation and quiescence. Immunity 38: 633–643. - PMC - PubMed
    1. Yang Z., Matteson E. L., Goronzy J. J., Weyand C. M. 2015. T-cell metabolism in autoimmune disease. Arthritis Res. Ther. 17: 29. - PMC - PubMed
    1. O’Neill L. A., Kishton R. J., Rathmell J. 2016. A guide to immunometabolism for immunologists. Nat. Rev. Immunol. 16: 553–565. - PMC - PubMed
    1. Chang C. H., Pearce E. L. 2016. Emerging concepts of T cell metabolism as a target of immunotherapy. Nat. Immunol. 17: 364–368. - PMC - PubMed

Publication types

MeSH terms