

doi: 10.1167/iovs.17-23544.
Macular Degeneration Epidemiology: Nature-Nurture, Lifestyle Factors, Genetic Risk, and Gene-Environment Interactions - The Weisenfeld Award Lecture
Affiliations
- PMID: 29288272
- PMCID: PMC5749242
- DOI: 10.1167/iovs.17-23544
Item in Clipboard
Macular Degeneration Epidemiology: Nature-Nurture, Lifestyle Factors, Genetic Risk, and Gene-Environment Interactions - The Weisenfeld Award Lecture
Invest Ophthalmol Vis Sci.
.
No abstract available
Figures
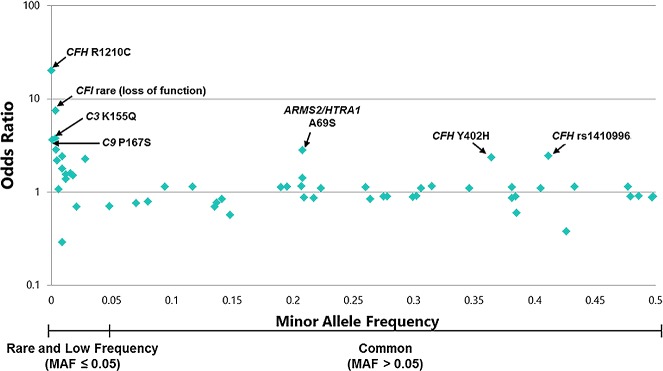
Display of genetic variants associated with AMD risk according to minor allele frequency and estimated OR. All ORs are calculated based on risk per effective allele and are on a logarithmic scale.
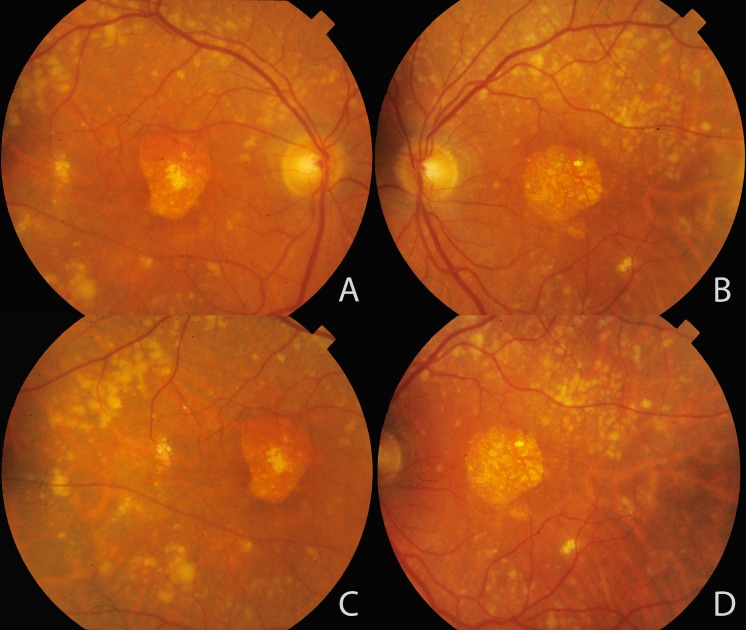
Extensive drusen accumulation throughout retinal vascular arcades associated with the complement factor H (CFH) R1210C rare variant. Color fundus photographs of a patient with the CFH R1210C rare variant and geographic atrophy in the right (A, C) and left (B, D) eyes are shown. Large confluent soft drusen are seen in the macular area and extending throughout the topography of retinal vascular arcades and beyond. Reprinted with permission from Ferrara D, Seddon JM. Phenotypic characterization of complement factor H R1210C rare genetic variant in age-related macular degeneration. JAMA Ophthalmol. 2015;133:785–791. Copyright 2015 American Medical Association.
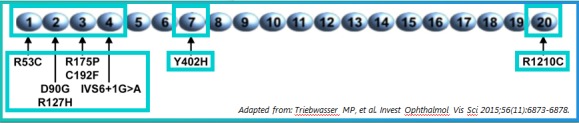
Factor H is a plasma protein (300 μg/mL) consisting entirely of 20 homologous complement control proteins (CCPs). Each CCP module contains approximately 60 amino acids, linked together (like beads on a string) by 3 to 8 amino acids in an extended head-to-tail fashion. Selected SNPs are shown, including the common Y402H polymorphism and several rare variants with high penetrance identified in familial AMD and independent cases. The three major functional sites of the rare variants are noted, including the complement regulatory site (CCPs 1–4) mediating cofactor activity and two regions that mediate transfer of this plasma protein to a surface, such as a drusen or a damaged RPE cell. Adapted from Triebwasser MP, Roberson EDO, Yu Y, et al. Rare variants in the functional domains of complement factor H are associated with age-related macular degeneration. Invest Ophthalmol Vis Sci. 2015;56:6873–6878. Copyright 2015 Association for Research in Vision and Ophthalmology.
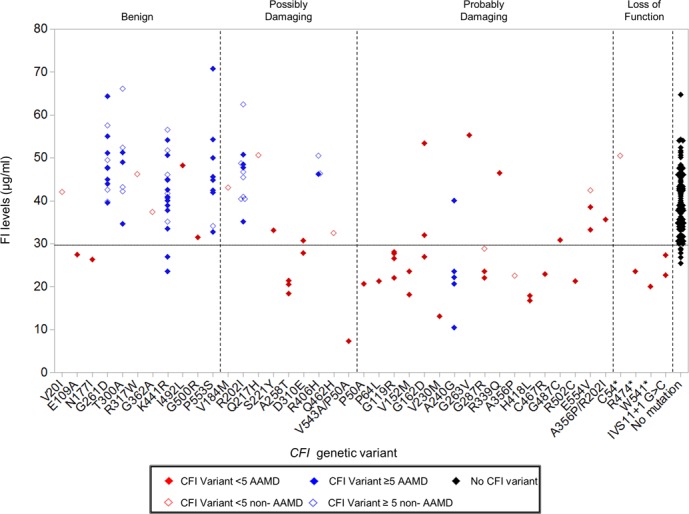
Serum FI levels of individuals stratified by CFI genetic variant. CFI variants with counts <5 in the sequencing panel are colored red. Variants with counts ≥5 are blue. Genetic variants in individuals with advanced age-related macular degeneration (AAMD) are represented by a filled diamond and comparison group without AAMD are shown with an unfilled diamond. Genetic variants are grouped into benign, possibly damaging, probably damaging, or loss of function as predicted by PolyPhen2. Two individuals were compound heterozygotes (p.V543A/p.P50A; p.A356P/p.R202I). p.R202I and p.V543Awere predicted to be possibly damaging, while A356P and P50A were predicted to be probably damaging. The black filled diamonds represent 95 individuals (47 non-AAMD, 48 AAMD) with no CFI variants. The lower limit of normal is demonstrated by a dotted line (29.3 μg/mL). Reprinted with permission from Kavanagh D, Yu Y, Schramm EC, et al. Rare genetic variants in the CFI gene are associated with advanced age-related macular degeneration and commonly result in reduced serum factor I levels. Hum Mol Genet. 2015;24:3861–3870. © The Author 2015. Published by Oxford University Press, under the Creative Commons Attribution License (http://creativecommons.org/licenses/by/4.0/ ).
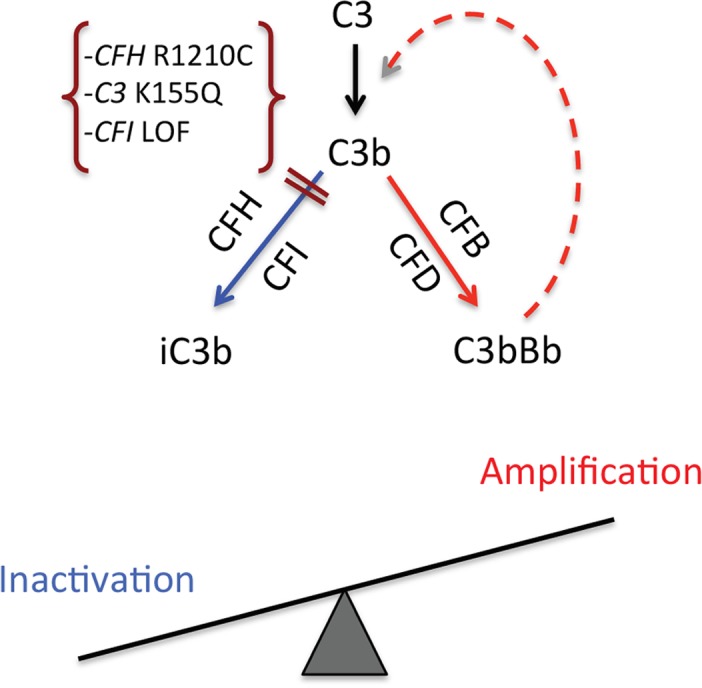
The two fates of C3b generated in the retina. On C3 activation, the resulting C3b may be either proteolytically cleaved (inactivated) or generate a C3 convertase (C3bBb) to produce more C3b (a feedback or amplification loop). On the left, the combined action of regulatory proteins factor H (CFH) and factor I (CFI) cleave and inactivate C3b, resulting in iC3b, which does not participate in the amplification process. On the right, C3b, together with factor B (FB) and factor D (FD), forms a C3 convertase, which, in turn, cleaves C3 and generates more active C3b. Thus, variants seen in AMD, such as a loss of function (LOF) in CFH (e.g., R1210C), LOF in CFI, or a gain of function in C3 (e.g., K155Q) (e.g., Refs. 65, 69, 73), would alter the balance toward excessive complement activation and thereby could enhance tissue damage. Not shown in this diagram is that properdin stabilizes (positive regulator) the alternative pathway C3 convertase, increasing its half-life up to 10-fold (20–30 seconds to 3–4 minutes). Reprinted with permission from Seddon JM, Yu Y, Miller EC, et al. Rare variants in CFI, C3 and C9 are associated with high risk of advanced age-related macular degeneration. Nat Genet. 2013;45:1366–1370. Copyright 2013 Nature America, Inc., part of Springer Nature.
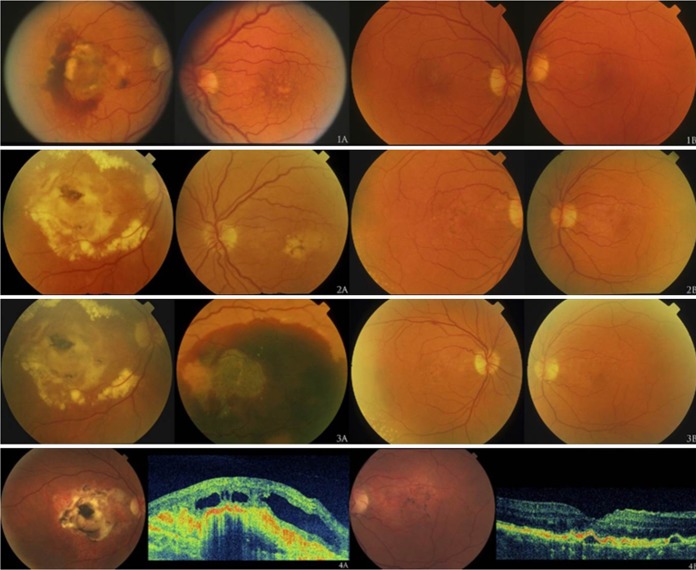
Discordant macular phenotypes within one monozygotic twin pair. The fundus appearance of twin A is represented in (1A) to (4A), and that of twin B is depicted in (1B) to (4B) on the right. Photos were taken at clinic visits when twins were age 64 (March 1997), 68 (April 2001), 68.5 (July 2001), and 74 (August 2007). (4A) and (4B) are representative ultra– high-resolution optical coherence tomography scans. Twin A had advanced neovascular disease and twin B had drusen and RPE irregularities. Reprinted with permission from Seddon JM, Reynolds R, Shah HR, Rosner B. Smoking, dietary betaine, methionine, and vitamin D in monozygotic twins with discordant macular degeneration: epigenetic implications. Ophthalmology. 2011;118:1386–1394. Copyright 2011 American Academy of Ophthalmology.
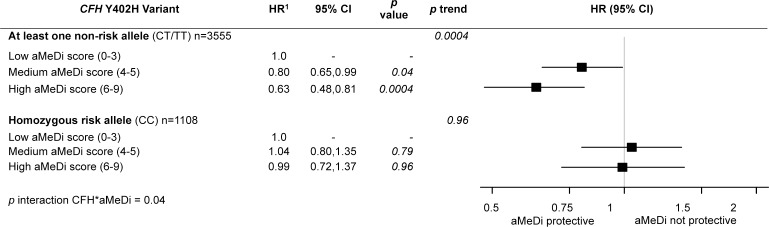
Effect of adherence to the alternate Mediterranean diet (aMeDi) on progression to advanced AMD according to CFH Y402H genotypes. HRs and 95% CIs were estimated by using Cox proportional hazards models with individual eye as the unit of analysis, adjusted for age, sex, AMD status at baseline for both eyes, AREDS treatment, total energy intake, educational level, smoking, BMI, supplement use, and the other nine genetic variants (CFH rs1410996, CFH rs121913059 [R1210C], ARMS2/HTRA1 rs10490924, C2 rs9332739 [E318D], CFB rs641153 [R32Q], C3 rs2230199 [R102G], C3 rs147859257 [K155Q], COL8A1 rs13095226, and RAD51B rs8017304). P trend was calculated by using median values within each category. Low aMeDi score (0–3) was the referent. Reprinted with permission from Merle BM, Silver RE, Rosner B, Seddon JM. Adherence to a Mediterranean diet, genetic susceptibility, and progression to advanced macular degeneration: a prospective cohort study. Am J Clin Nutr. 2015;102:1196–1206. Copyright 2015 American Society for Nutrition.
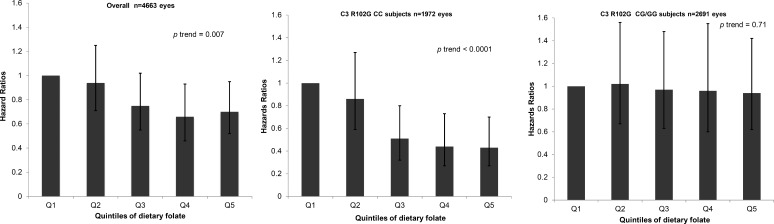
Effect of dietary folate on progression to geographic atrophy according to C3 R102G genotype. HRs, 95% CIs, and P trend were calculated by using Cox proportional hazards models adjusted for age, sex, education, smoking, BMI, AREDS treatment, multivitamin supplement use, AMD status at baseline in both eyes, total energy intake, and nine genetic variants (CFH: rs1061170 [Y402H], CFH: rs1410996, CFH: rs121913059 [R1210C], ARMS2/HTRA1: rs10490924, C2: rs9332739 [E318D], CFB: rs641153 [R32Q], C3: rs147859257 [K155Q], COL8A1: rs13095226, RAD51B: rs8017304). Reprinted with permission from Merle BM, Silver RE, Rosner B, Seddon JM. Dietary folate, B vitamins, genetic susceptibility and progression to advanced nonexudative age-related macular degeneration with geographic atrophy: a prospective cohort study. Am J Clin Nutr. 2016;103:1135–1144. Copyright 2016 American Society for Nutrition.
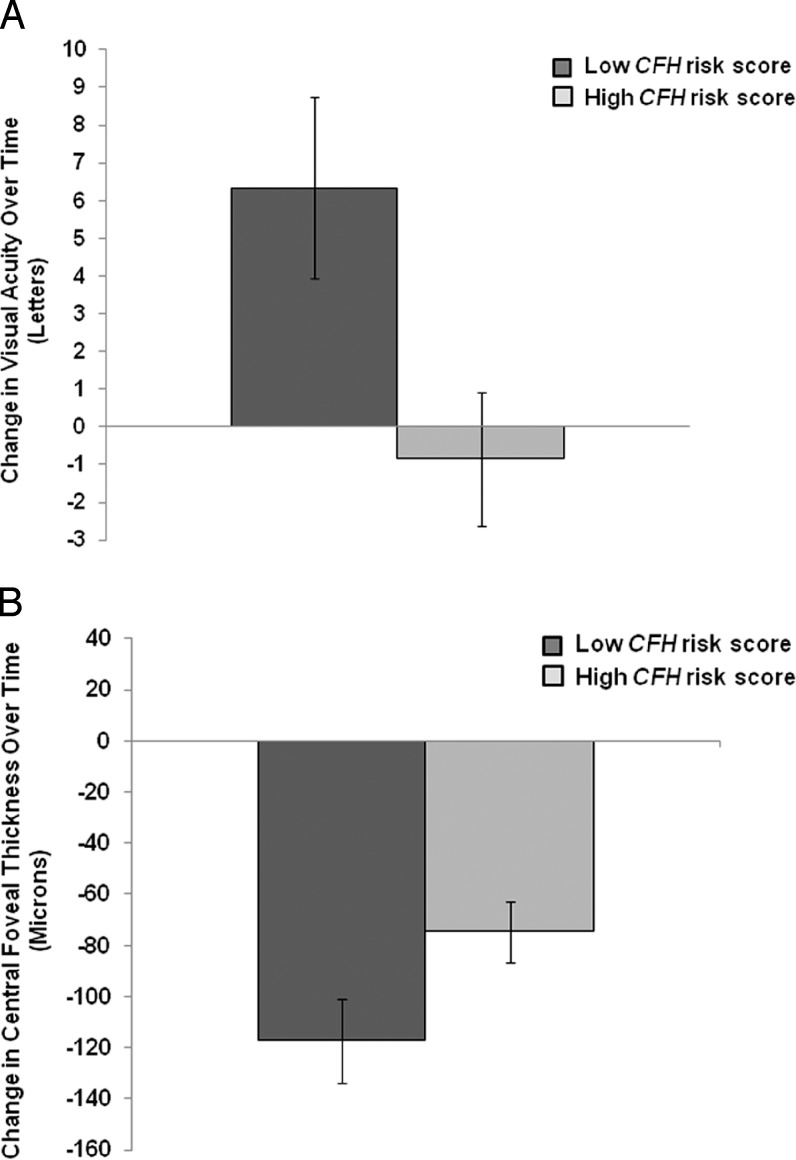
(A) Change in visual acuity (VA) over time for low versus high CFH risk scores after intravitreal anti-VEGF treatment for AMD. Among subjects with a low CFH risk score, there was a notable improvement in VA over time (6.33 ± 2.40 letters) compared with no demonstrable improvement for subjects in the high-risk group (Pheterogeneity = 0.019). VA is measured by Early Treatment Diabetic Retinopathy Study acuity in letters. Standard error (SE) is illustrated by vertical error bars. (B) Change in central foveal thickness as measured by optical coherence tomography for low versus high CFH risk scores after intravitreal anti-VEGF treatment for AMD. Among subjects with a low CFH risk score, there was greater reduction in central foveal thickness over time compared with the high-risk group (Pheterogeneity = 0.033). SE is illustrated by vertical error bars. Reprinted with permission from Shah AR, Williams S, Baumal CR, Rosner B, Duker JS, Seddon JM. Predictors of response to intravitreal anti-vascular endothelial growth factor treatment of age-related macular degeneration. Am J Ophthalmol. 2016;163:154–166.e8. Copyright 2016 Elsevier, Inc.
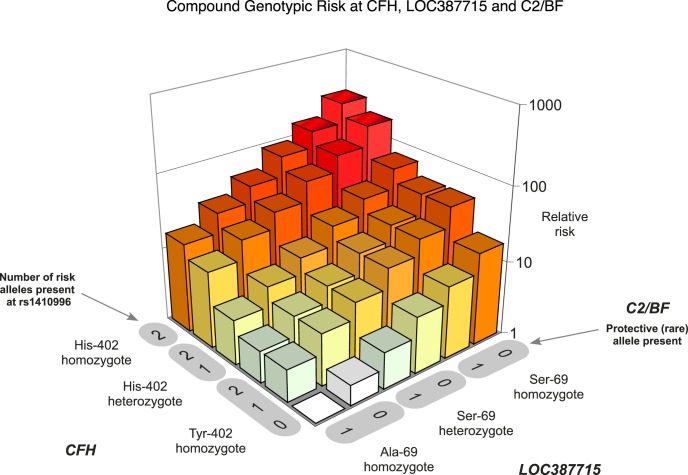
Relative risk plotted as a function of the genetic load of the five variants that influence risk of AMD. Two variants are in the CFH gene on chromosome 1: Y402H and rs1410996. Another common variant (A69S) is in the gene on chromosome 10. Two less common variants are observed in the C2 and CFB genes on chromosome 6. There was no evidence for interaction between any of these variants, suggesting an independent mode of action. Reprinted with permission from Maller J, George S, Purcell S, et al. Common variation in three genes, including a noncoding variant in CFH, strongly influences risk of age-related macular degeneration. Nat Genet. 2006;38:1055–1059. Copyright 2006 Nature America, Inc., part of Springer Nature.
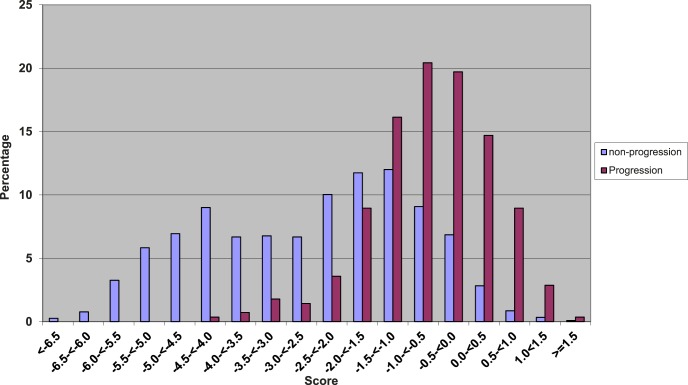
Distribution of composite risk scores among progressors and nonprogressors to incident advanced AMD. Risk scores for progressors and nonprogressors are based on six genetic variants, as well as demographic, ocular, environmental, and treatment variables. Reprinted with permission from Seddon JM, Reynolds R, Maller J, Fagerness JA, Daly MJ, Rosner B. Prediction model for prevalence and incidence of advanced age-related macular degeneration based on genetic, demographic, and environmental variables. Invest Ophthalmol Vis Sci. 2009;50:2044–2053. Copyright 2009 Association for Research in Vision and Ophthalmology.
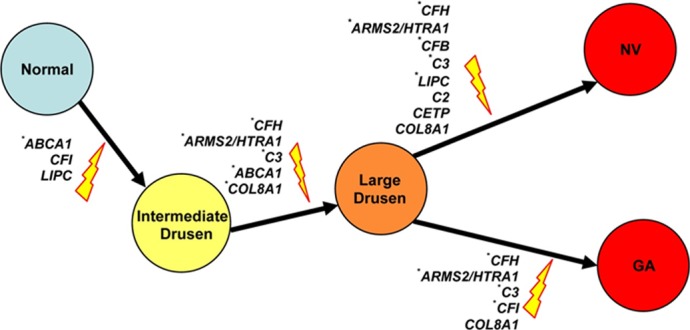
The genetic effects on different stages of AMD progression. Genes that are significantly associated with the risk of a specific transition in the univariate or the multivariate Markov model are shown. SNPs that are significantly associated with risk of AMD progression in the multivariate Markov model are indicated by an asterisk. Reprinted with permission from Yu Y, Reynolds R, Rosner B, Daly MJ, Seddon JM. Prospective assessment of genetic effects on progression to different stages of age-related macular degeneration using multistate Markov models. Invest Ophthalmol Vis Sci. 2012;53:1548–1556. Copyright 2012 Association for Research in Vision and Ophthalmology.
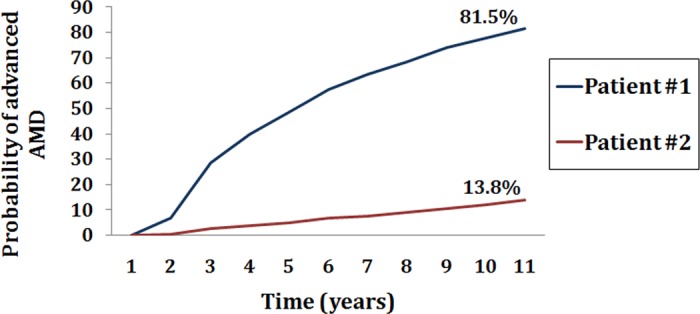
The probability of progression to advanced AMD in two patients classified as intermediate-stage AMD and with similar ages at baseline, according to their composite risk score (based on demographic, environmental, ocular, and 10 genetic factors). Risk score category was very high for patient 1 with about an 81% risk, and very low for patient 2 with approximately 14% risk of progression over 11 years.
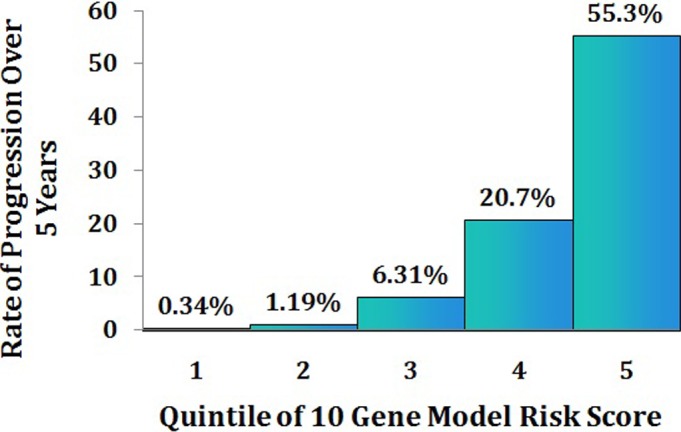
Rate of progression to advanced stages of AMD (GA and NV) over 5 years among participants without advanced disease at baseline, according to quintile of the polygenic, composite model risk score.
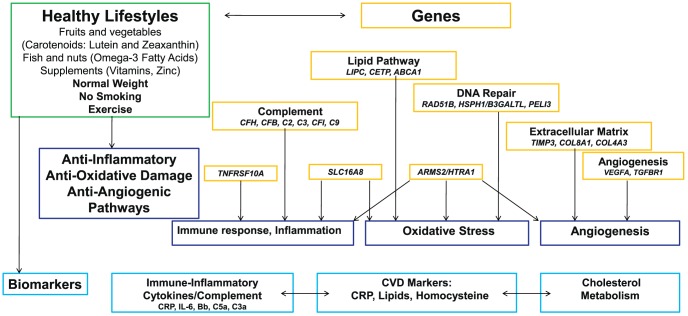
Diagram of interplay between environmental and genetic risk factors and biomarkers that mediate AMD risk. Adapted and reprinted with permission from Sobrin L, Seddon JM. Nature and nurture-genes and environment-predict onset and progression of macular degeneration. Prog Retin Eye Res. 2014;40:1–15. Copyright 2014 Published by Elsevier Ltd.
References
-
- Ross RD. Pioneering women in opthalmology. In: DM, Albert, Edwards DD, eds The History of Ophthalmology. Cambridge, MA: Blackwell Science; 1996: 275–278, 282–273.
-
- Seddon JM,, Schwartz B,, Flowerdew G. Case-control study of ocular hypertension. Arch Ophthalmol. 1983; 101: 891–894. - PubMed
-
- Seddon JM,, Albert DM,, Lavin PT,, Robinson N. A prognostic factor study of disease-free interval and survival following enucleation for uveal melanoma. Arch Ophthalmol. 1983; 101: 1894–1899. - PubMed
-
- Egan KM,, Seddon JM,, Glynn RJ,, Gragoudas ES,, Albert DM. Epidemiologic aspects of uveal melanoma. Surv Ophthalmol. 1988; 32: 239–251. - PubMed
-
- Seddon J,, Gragoudas E,, Egan K,, Polivogianis L,, Finn S,, Albert D. Standardized data collection and coding in eye disease epidemiology: the Uveal Melanoma Data System. Ophthalmic Surg. 1991; 22: 127–136. - PubMed
Publication types
MeSH terms
Grants and funding
LinkOut - more resources
Full Text Sources
Other Literature Sources
Medical
Molecular Biology Databases
