Review
. 2018 Apr;244(5):512-524.
doi: 10.1002/path.5028. Epub 2018 Feb 22.

PanCancer insights from The Cancer Genome Atlas: the pathologist's perspective

Affiliations
Review

PanCancer insights from The Cancer Genome Atlas: the pathologist's perspective

Lee Ad Cooper et al. J Pathol. 2018 Apr.

Abstract

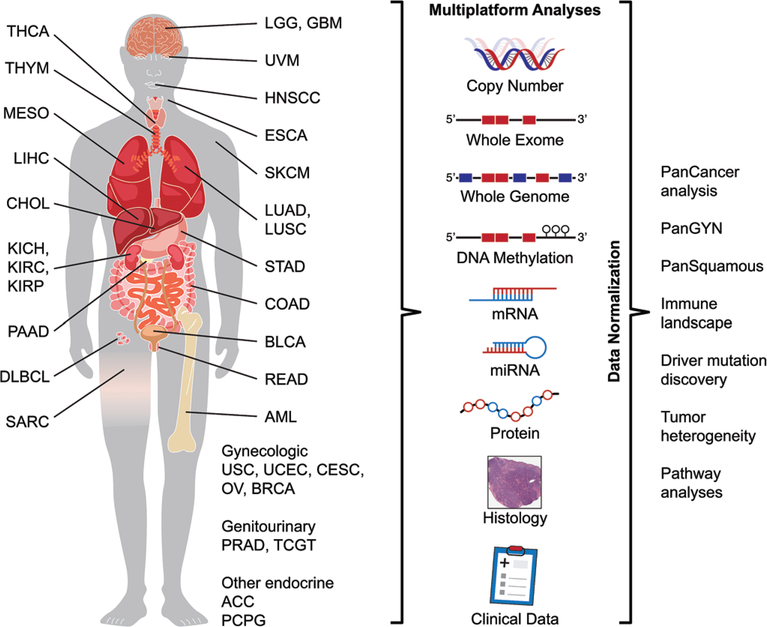
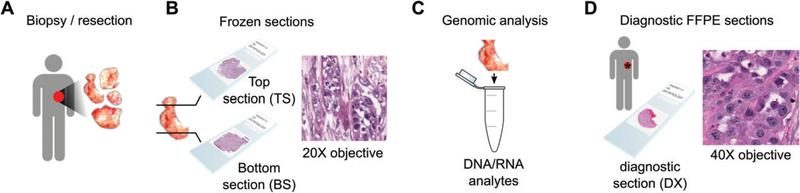
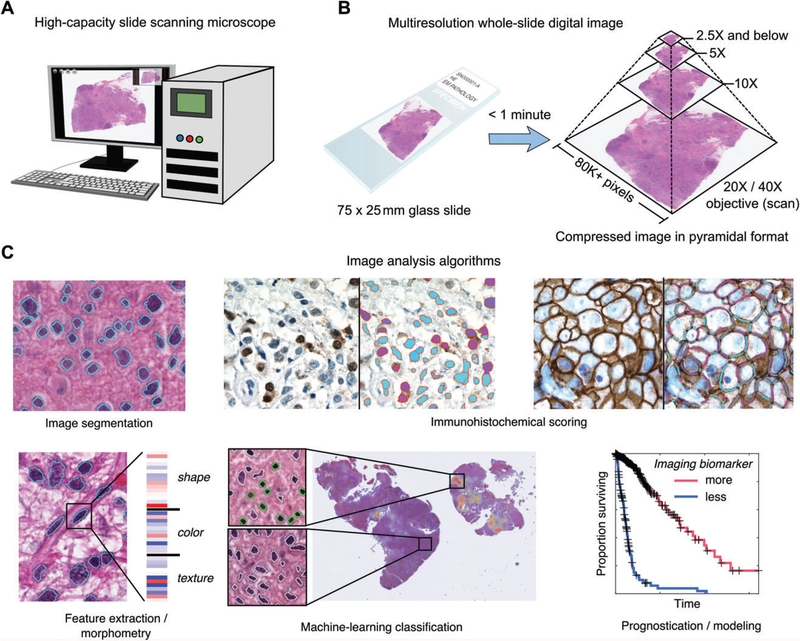
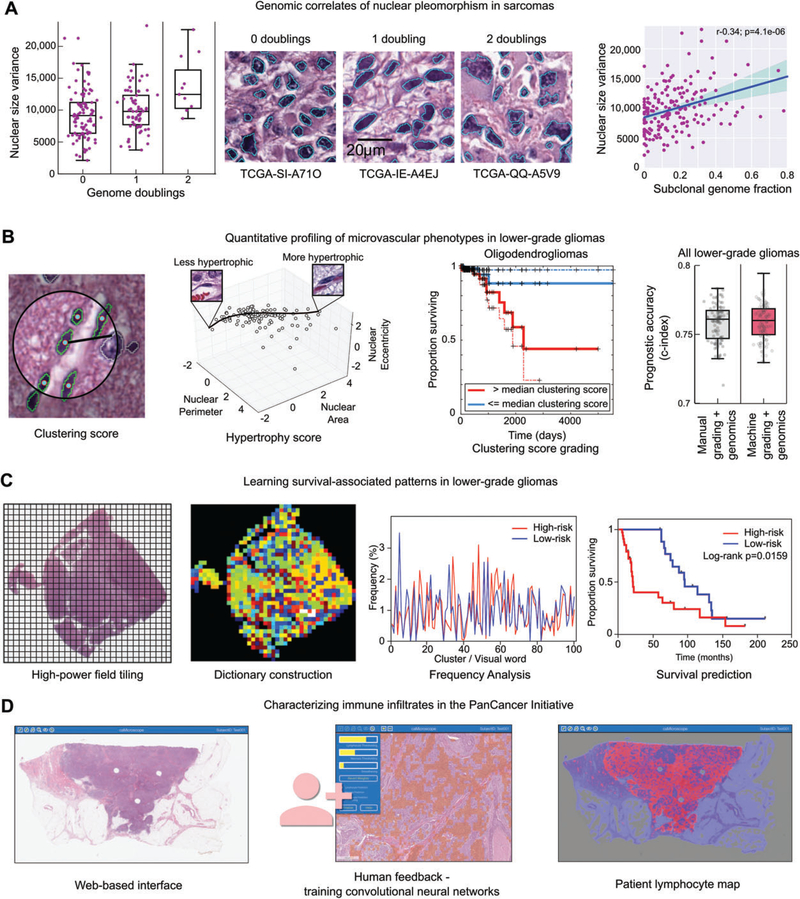
The Cancer Genome Atlas (TCGA) represents one of several international consortia dedicated to performing comprehensive genomic and epigenomic analyses of selected tumour types to advance our understanding of disease and provide an open-access resource for worldwide cancer research. Thirty-three tumour types (selected by histology or tissue of origin, to include both common and rare diseases), comprising >11 000 specimens, were subjected to DNA sequencing, copy number and methylation analysis, and transcriptomic, proteomic and histological evaluation. Each cancer type was analysed individually to identify tissue-specific alterations, and make correlations across different molecular platforms. The final dataset was then normalized and combined for the PanCancer Initiative, which seeks to identify commonalities across different cancer types or cells of origin/lineage, or within anatomically or morphologically related groups. An important resource generated along with the rich molecular studies is an extensive digital pathology slide archive, composed of frozen section tissue directly related to the tissues analysed as part of TCGA, and representative formalin-fixed paraffin-embedded, haematoxylin and eosin (H&E)-stained diagnostic slides. These H&E image resources have primarily been used to verify diagnoses and histological subtypes with some limited extraction of standard pathological variables such as mitotic activity, grade, and lymphocytic infiltrates. Largely overlooked is the richness of these scanned images for more sophisticated feature extraction approaches coupled with machine learning, and ultimately correlation with molecular features and clinical endpoints. Here, we document initial attempts to exploit TCGA imaging archives, and describe some of the tools, and the rapidly evolving image analysis/feature extraction landscape. Our hope is to inform, and ultimately inspire and challenge, the pathology and cancer research communities to exploit these imaging resources so that the full potential of this integral platform of TCGA can be used to complement and enhance the insightful integrated analyses from the genomic and epigenomic platforms. Copyright © 2017 Pathological Society of Great Britain and Ireland. Published by John Wiley & Sons, Ltd.

Keywords: PanCancer; TCGA; The Cancer Genome Atlas; computational histology; digital pathology; genomics; image analysis.


Conflict of interest statement

No conflicts of interest were declared.

Figures

Figure 1.
Figure 1.
Overview of TCGA. Schematic representation of the 33 cancers analysed by the TCGA/PanCancer Initiative organized by tissue of origin, and the data types acquired. Examples of the PanCancer analyses undertaken are listed on the right. TCGA tumour type abbreviation codes are as follows: ACC, adrenocortical carcinoma; BLCA, bladder urothelial carcinoma; BRCA, breast invasive carcinoma; CESC, cervical squamous cell carcinoma and endocervical adenocarcinoma; CHOL, cholangiocarcinoma; COAD, colon adenocarcinoma; DLBC, diffuse large B-cell lymphoma; ESCA, oesophageal carcinoma; GBM, glioblastoma multiforme; HNSC, head and neck squamous cell carcinoma; KICH, chromophobe renal cell carcinoma; KIRC, clear cell renal clear cell carcinoma; KIRP, papillary renal cell carcinoma; LAML, acute myeloid leukaemia; LGG, lower-grade glioma; LIHC, hepatocellular carcinoma; LUAD, lung adenocarcinoma; LUSC, lung squamous cell carcinoma; MESO, mesothelioma; OV, ovarian serous adenocarcinoma; PAAD, pancreatic adenocarcinoma; PCPG, phaeochromocytoma and paraganglioma; PRAD, prostate adenocarcinoma; READ, rectal adenocarcinoma; SARC, adult soft tissue sarcoma; SKCM, cutaneous melanoma; STAD, stomach adenocarcinoma; TGCT, testicular germ cell tumour; THCA, thyroid carcinoma; THYM, thymoma; UCEC, uterine corpus endometrial carcinoma; UCS, uterine carcinosarcoma; UVM, uveal melanoma.
Figure 2.
Figure 2.
Tissue procurement in TCGA. (A) A Tissue Source Site (TSS) obtains samples from surgical resection. (B) A portion of this tissue is selected for submission to TCGA, and the BCR produces ‘top-section’ (TS) and ‘bottom-section’ (BS) slides for review to determine that the percentage necrosis and abundance and proportion of tumour cells are adequate for genomic analysis. (C) The middle portion of this tissue is used to extract RNA and DNA analytes for genomic analysis. (D) One or more ‘diagnostic’ formalin-fixed paraffin-embedded (FFPE) slides are submitted to the BCR by the TSS for confirmation of histological diagnosis. These diagnostic slides originate from the same tumour, but their relationship to the material submitted for genomic analysis is unknown. The frozen sections provide the best representation of the tissue contents reflected in genomic signatures. However, the freezing artefacts in these slides can confound routine pathological examination or image analysis algorithms. The FFPE sections reveal cytological details, and have sufficient quality to confirm diagnosis, but the relationship or molecular similarity of these sections to the tissues submitted for genomic analysis is not as precise, as larger tumours may have considerable heterogeneity, and it is not always clear where the frozen tissue was sampled from relative to these H&E sections. The tradeoff between image quality and adjacency to genomic materials is an important consideration in designing an image analysis study of TCGA, and should be weighed on the basis of intratumoural heterogeneity and sensitivity of the image analysis algorithms to artefacts
Figure 3.
Figure 3.
Whole slide imaging and image analysis. (A) Slide-scanning microscopes can rapidly digitize an entire glass slide, producing a ‘whole slide’ digital image. These devices can scan large batches of slides, producing >1000 scans in a single day. (B) Slides are digitized with a × 20 or ×40 objective, and this base magnification is used by the scanner software to produce a multiresolution image pyramid containing downsampled magnifications. This pyramidal format enables smooth zooming and interaction with the image, and provides additional resolutions for image analysis. (C) A large number of image analysis algorithms exist for analysing whole slide images (from left to right, top to bottom): image segmentation algorithms are used to automatically delineate the boundaries of structures such as cell nuclei; immunohistochemical scoring algorithms can be used to measure the subcellular localization and intensity of antigens; feature extraction can be used to calculate quantitative features describing the shape, colour and texture of tissue elements; machine-learning algorithms can be used with imaging features to classify objects – here, a classifier was trained to identify mononuclear cells (green) in a glioma, and a heatmap indicating the concentration of positively classified cells in the slide is shown; measurements made by image analysis can be used to build prognostic models that can objectively discriminate patient outcomes.
Figure 4.
Figure 4.
Image analysis studies of TCGA. (A) Nuclear morphometry was used to study the genomic correlates of nuclear pleomorphism in sarcomas. Image segmentation was used to delineate >500 million nuclei in diagnostic sarcoma images, and the area of each nucleus was calculated. The variance of nuclear area was calculated for 235 sarcomas, and compared with measurements of genome doublings and subclonality obtained from sequencing and copy number data. Increased pleomorphism was significantly associated with measures of genomic complexity, including genome doublings, subclonality, and aneuploidy. (B) Machine learning was used to investigate microvascular phenotypes in lower-grade gliomas. A classifier was developed to identify vascular endothelial cells in gliomas (green). These classifications were used to measure to the clustering of endothelial cells and to model the morphological spectrum of endothelial nuclei in order to describe the extent of endothelial hyperplasia and hypertrophy in TCGA samples. These measurements were used as a biomarker to stratify overall survival, and were as effective at predicting outcomes as manual histological grading when combined with diagnostic genetic biomarkers. (C) Unsupervised machine learning was used to identify survival-associated patterns in lower-grade gliomas using TCGA data. Features describing the texture of haematoxylin were analysed in tiled high-power fields. These features were used to cluster the fields to define a dictionary of ‘visual words’ that captures the frequent patterns in the tissue. The frequency of these words in each slide were used to predict patient survival and to identify molecular correlates of histological patterns. (D) Convolutional networks were used to map the spatial distribution of TILs in 13 cancer types as part of the recent PanCancer immune working group. A web-based interface was used to train convolutional neural networks to identify patches containing TILs. These algorithms were then used to map the presence of TILs in >6000 whole slide images.

References

    1. Weinstein JN, Collisson EA, Mills GB, et al. The Cancer Genome Atlas Pan-Cancer analysis project. Nat Genet 2013; 45: 1113–1120. - PMC - PubMed
    1. Ciriello G, Gatza ML, Beck AH, et al. Comprehensive molecular portraits of invasive lobular breast cancer. Cell 2015; 163: 506–519. - PMC - PubMed
    1. The Cancer Genome Atlas Network. Comprehensive molecular portraits of human breast tumours. Nature 2012; 490: 61–70. - PMC - PubMed
    1. Hoadley KA, Yau C, Wolf DM, et al. Multiplatform analysis of 12 cancer types reveals molecular classification within and across tissues of origin. Cell 2014; 158: 929–944. - PMC - PubMed
    1. Ciriello G, Miller ML, Aksoy BA, et al. Emerging landscape of oncogenic signatures across human cancers. Nat Genet 2013; 45: 1127–1133. - PMC - PubMed

Publication types

Substances