

Skeletal muscle microvascular and interstitial PO2 from rest to contractions
- PMID: 29288568
- PMCID: PMC5830449
- DOI: 10.1113/JP275170
Skeletal muscle microvascular and interstitial PO2 from rest to contractions
Abstract
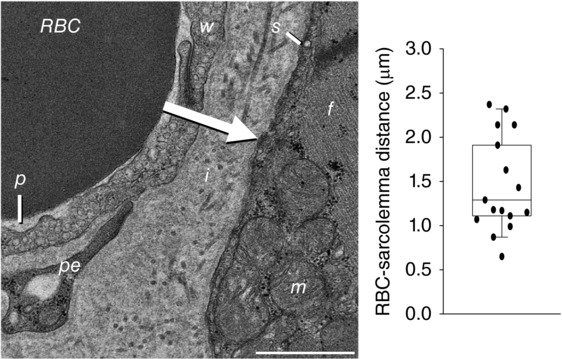
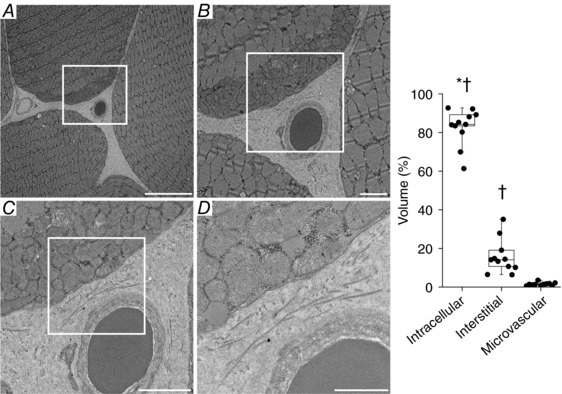
Key points: Oxygen pressure gradients across the microvascular walls are essential for oxygen diffusion from blood to tissue cells. At any given flux, the magnitude of these transmural gradients is proportional to the local resistance. The greatest resistance to oxygen transport into skeletal muscle is considered to reside in the short distance between red blood cells and myocytes. Although crucial to oxygen transport, little is known about transmural pressure gradients within skeletal muscle during contractions. We evaluated oxygen pressures within both the skeletal muscle microvascular and interstitial spaces to determine transmural gradients during the rest-contraction transient in anaesthetized rats. The significant transmural gradient observed at rest was sustained during submaximal muscle contractions. Our findings support that the blood-myocyte interface provides substantial resistance to oxygen diffusion at rest and during contractions and suggest that modulations in microvascular haemodynamics and red blood cell distribution constitute primary mechanisms driving increased transmural oxygen flux with contractions.
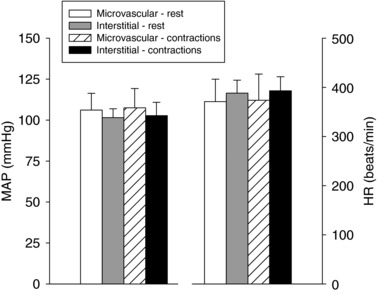
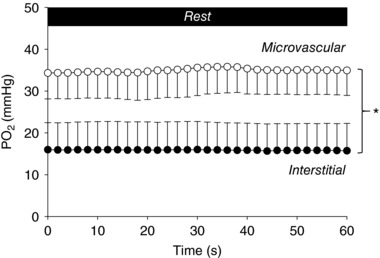
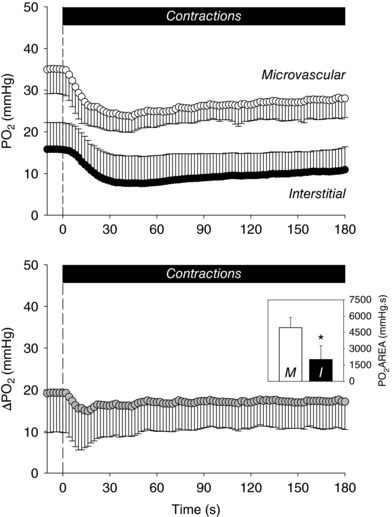
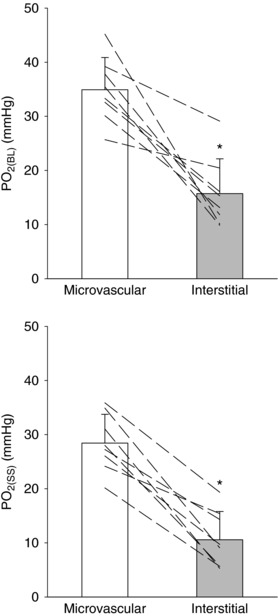
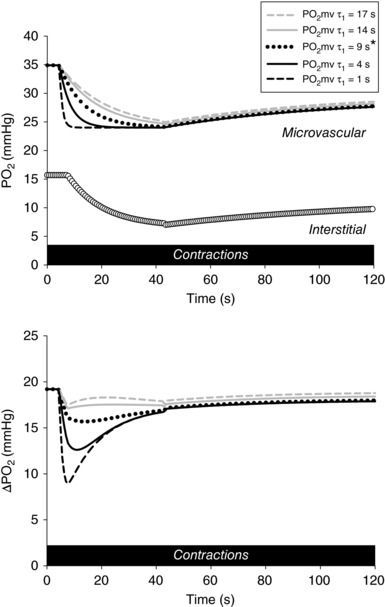
Abstract: Oxygen pressure (PO2) gradients across the blood-myocyte interface are required for diffusive O2 transport, thereby supporting oxidative metabolism. The greatest resistance to O2 flux into skeletal muscle is considered to reside between the erythrocyte surface and adjacent sarcolemma, although this has not been measured during contractions. We tested the hypothesis that O2 gradients between skeletal muscle microvascular (PO2 mv ) and interstitial (PO2 is ) spaces would be present at rest and maintained or increased during contractions. PO2 mv and PO2 is were determined via phosphorescence quenching (Oxyphor probes G2 and G4, respectively) in the exposed rat spinotrapezius during the rest-contraction transient (1 Hz, 6 V; n = 8). PO2 mv was higher than PO2 is in all instances from rest (34.9 ± 6.0 versus 15.7 ± 6.4) to contractions (28.4 ± 5.3 versus 10.6 ± 5.2 mmHg, respectively) such that the mean PO2 gradient throughout the transient was 16.9 ± 6.6 mmHg (P < 0.05 for all). No differences in the amplitude of PO2 fall with contractions were observed between the microvasculature and interstitium (10.9 ± 2.3 versus 9.0 ± 3.5 mmHg, respectively; P > 0.05). However, the speed of the PO2 is fall during contractions was slower than that of PO2 mv (time constant: 12.8 ± 4.7 versus 9.0 ± 5.1 s, respectively; P < 0.05). Consistent with our hypothesis, a significant transmural gradient was sustained (but not increased) from rest to contractions. This supports that the blood-myocyte interface is the site of a substantial PO2 gradient driving O2 diffusion during metabolic transients. Based on Fick's law, elevated O2 flux with contractions must thus rely primarily on modulations in effective diffusing capacity (mainly erythrocyte haemodynamics and distribution) as the PO2 gradient is not increased.
Keywords: diffusion; dynamics; kinetics; oxygen gradients.
© 2017 The Authors. The Journal of Physiology © 2017 The Physiological Society.
Figures
Comment in
-
Probing under pressure: a look inside the compartmental haemodynamics of skeletal muscle during rest and contraction.J Physiol. 2018 Jun;596(11):2035-2036. doi: 10.1113/JP276078. Epub 2018 May 2. J Physiol. 2018. PMID: 29645273 Free PMC article. No abstract available.
Similar articles
-
Sexual dimorphism in vascular ATP-sensitive K+ channel function supporting interstitial via convective and/or diffusive O2 transport.J Physiol. 2021 Jul;599(13):3279-3293. doi: 10.1113/JP281120. Epub 2021 Jun 8. J Physiol. 2021. PMID: 34101850 Free PMC article.
-
Transcapillary PO2 gradients in contracting muscles across the fibre type and oxidative continuum.J Physiol. 2020 Aug;598(15):3187-3202. doi: 10.1113/JP279608. Epub 2020 Jun 12. J Physiol. 2020. PMID: 32445225 Free PMC article.
-
Skeletal muscle interstitial Po2 kinetics during recovery from contractions.J Appl Physiol (1985). 2019 Oct 1;127(4):930-939. doi: 10.1152/japplphysiol.00297.2019. Epub 2019 Aug 1. J Appl Physiol (1985). 2019. PMID: 31369325 Free PMC article.
-
Skeletal muscle interstitial O2 pressures: bridging the gap between the capillary and myocyte.Microcirculation. 2019 Jul;26(5):e12497. doi: 10.1111/micc.12497. Epub 2018 Oct 10. Microcirculation. 2019. PMID: 30120845 Free PMC article. Review.
-
Skeletal muscle capillary function: contemporary observations and novel hypotheses.Exp Physiol. 2013 Dec;98(12):1645-58. doi: 10.1113/expphysiol.2013.073874. Epub 2013 Aug 30. Exp Physiol. 2013. PMID: 23995101 Free PMC article. Review.
Cited by
-
Energy metabolism design of the striated muscle cell.Physiol Rev. 2021 Oct 1;101(4):1561-1607. doi: 10.1152/physrev.00040.2020. Epub 2021 Mar 18. Physiol Rev. 2021. PMID: 33733879 Free PMC article. Review.
-
Oxygen flux from capillary to mitochondria: integration of contemporary discoveries.Eur J Appl Physiol. 2022 Jan;122(1):7-28. doi: 10.1007/s00421-021-04854-7. Epub 2021 Dec 23. Eur J Appl Physiol. 2022. PMID: 34940908 Free PMC article. Review.
-
Reactive Jumps Preserve Skeletal Muscle Structure, Phenotype, and Myofiber Oxidative Capacity in Bed Rest.Front Physiol. 2020 Jan 15;10:1527. doi: 10.3389/fphys.2019.01527. eCollection 2019. Front Physiol. 2020. PMID: 32009969 Free PMC article.
-
The role of vascular function on exercise capacity in health and disease.J Physiol. 2021 Feb;599(3):889-910. doi: 10.1113/JP278931. Epub 2020 Mar 3. J Physiol. 2021. PMID: 31977068 Free PMC article. Review.
-
Sexual dimorphism in vascular ATP-sensitive K+ channel function supporting interstitial via convective and/or diffusive O2 transport.J Physiol. 2021 Jul;599(13):3279-3293. doi: 10.1113/JP281120. Epub 2021 Jun 8. J Physiol. 2021. PMID: 34101850 Free PMC article.
References
-
- Bailey JK, Kindig CA, Behnke BJ, Musch TI, Schmid‐Schoenbein GW & Poole DC (2000). Spinotrapezius muscle microcirculatory function: effects of surgical exteriorization. Am J Physiol Heart Circ Physiol 279, H3131–H3137. - PubMed
-
- Bebout DE, Hogan MC, Hempleman SC & Wagner PD (1993). Effects of training and immobilization on VO2 and DO2 in dog gastrocnemius muscle in situ. J Appl Physiol 74, 1697–1703. - PubMed
-
- Behnke BJ, Barstow TJ, Kindig CA, McDonough P, Musch TI & Poole DC (2002). Dynamics of oxygen uptake following exercise onset in rat skeletal muscle. Respir Physiol Neurobiol 133, 229–239. - PubMed
-
- Behnke BJ, Delp MD, Dougherty PJ, Musch TI & Poole DC (2005). Effects of aging on microvascular oxygen pressures in rat skeletal muscle. Respir Physiol Neurobiol 146, 259–268. - PubMed
-
- Behnke BJ, Kindig CA, Musch TI, Koga S & Poole DC (2001). Dynamics of microvascular oxygen pressure across the rest–exercise transition in rat skeletal muscle. Respir Physiol 126, 53–63. - PubMed
Publication types
MeSH terms
Substances
LinkOut - more resources
Full Text Sources
Other Literature Sources