. 2018 Apr;27(8):1884-1897.
doi: 10.1111/mec.14473. Epub 2018 Jan 31.

Rates of gut microbiome divergence in mammals

Affiliations

Rates of gut microbiome divergence in mammals

Alex H Nishida et al. Mol Ecol. 2018 Apr.

Abstract

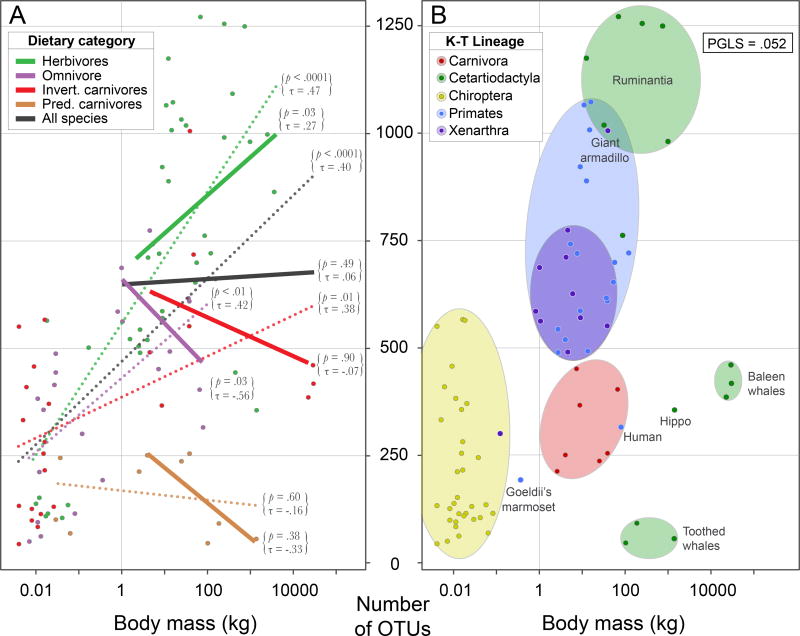
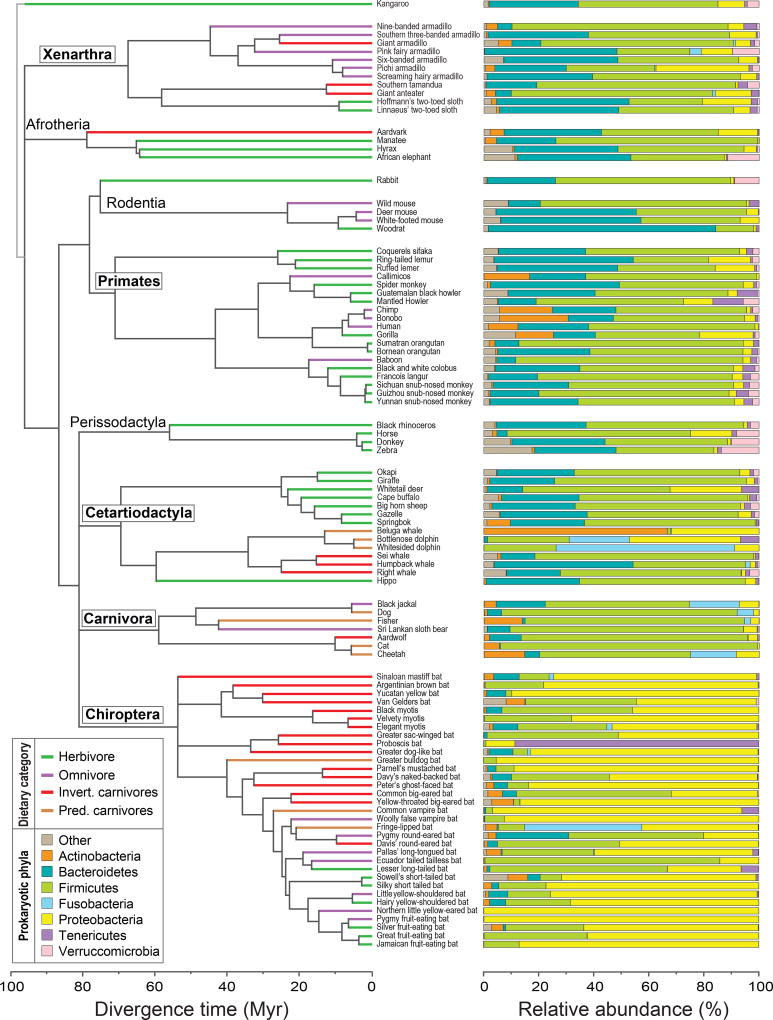
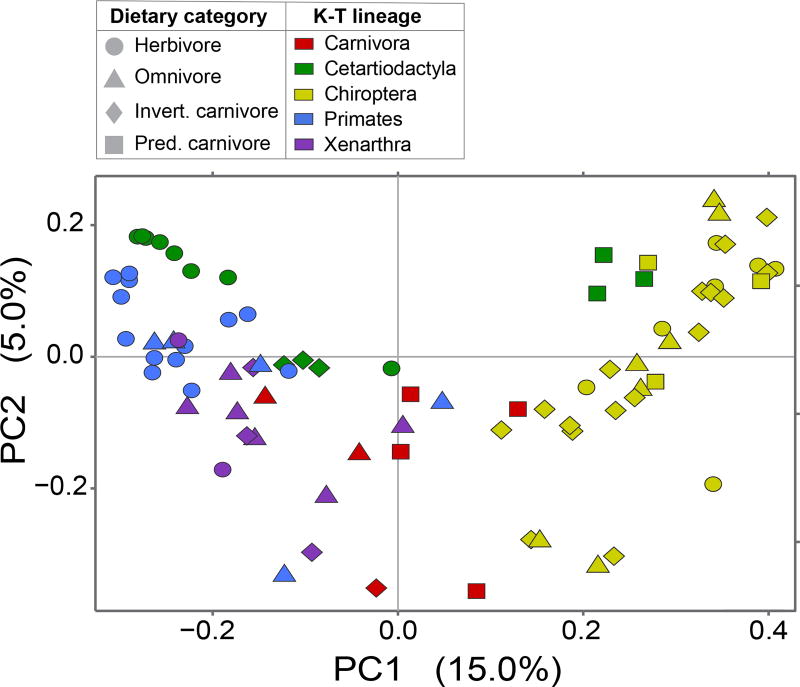
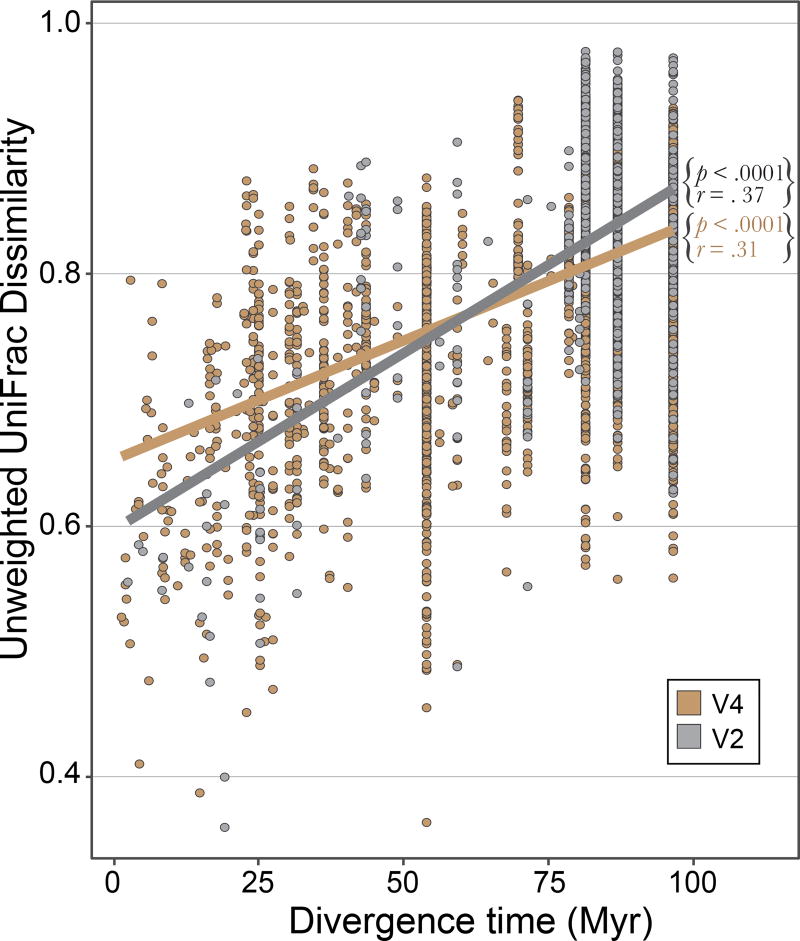
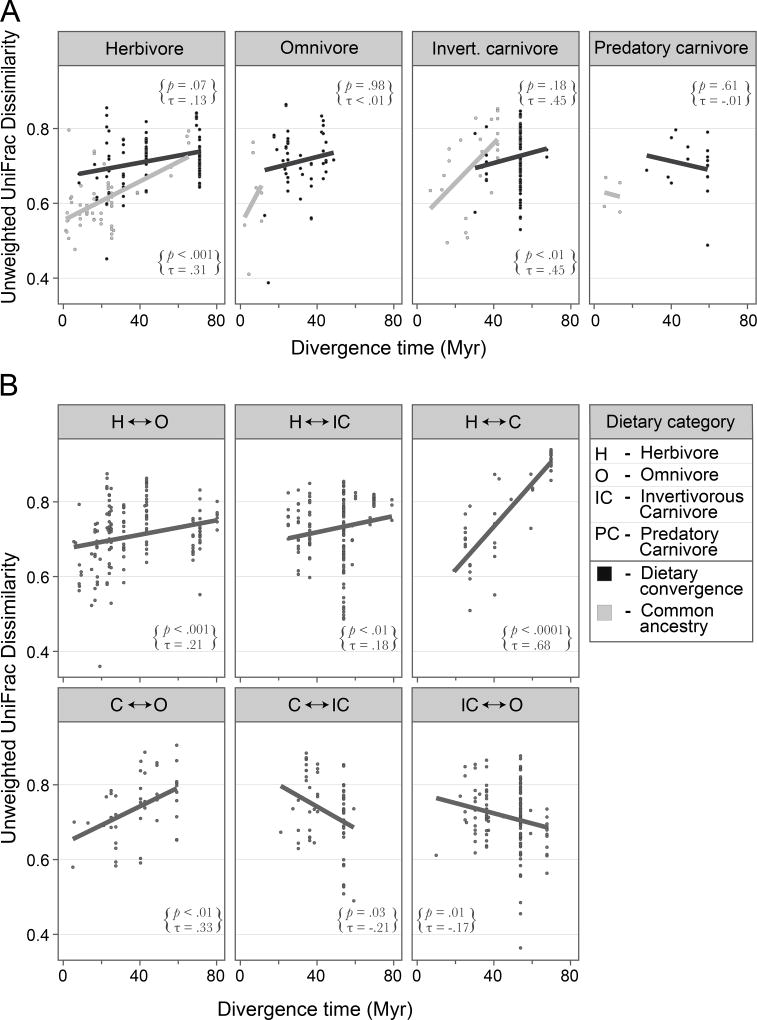
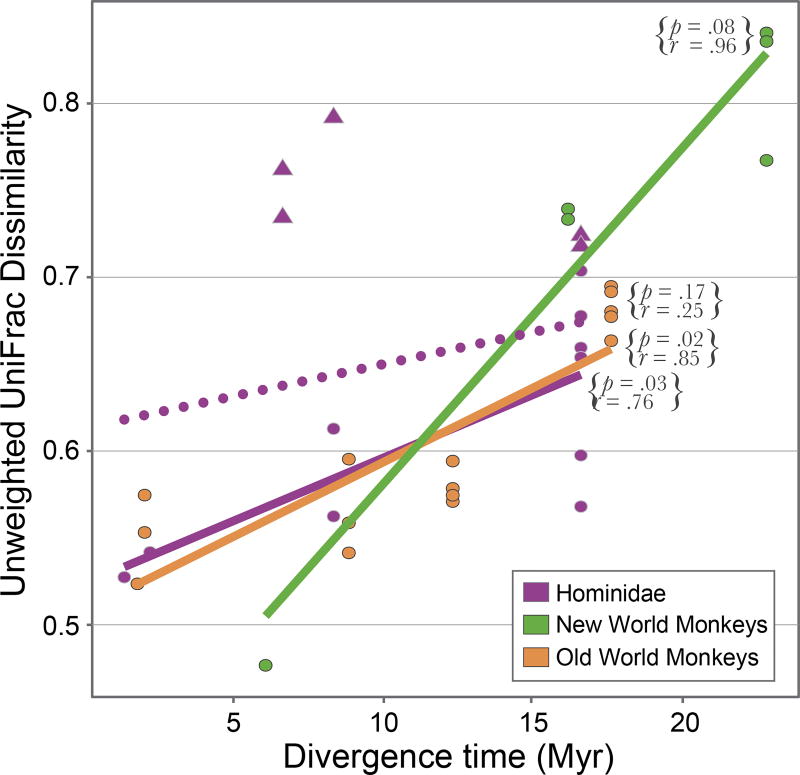
The variation and taxonomic diversity among mammalian gut microbiomes raises several questions about the factors that contribute to the rates and patterns of change in these microbial communities. By comparing the microbiome compositions of 112 species representing 14 mammalian orders, we assessed how host and ecological factors contribute to microbiome diversification. Except in rare cases, the same bacterial phyla predominate in mammalian gut microbiomes, and there has been some convergence of microbiome compositions according to dietary category across all mammalians lineages except Chiropterans (bats), which possess high proportions of Proteobacteria and tend to be most similar to one another regardless of diet. At lower taxonomic ranks (families, genera, 97% OTUs), bacteria are more likely to be associated with a particular mammalian lineage than with a particular dietary category, resulting in a strong phylogenetic signal in the degree to which microbiomes diverge. Despite different physiologies, the gut microbiomes of several mammalian lineages have diverged at roughly the same rate over the past 75 million years; however, the gut microbiomes of Cetartiodactyla (ruminants, whales, hippopotami) have evolved much faster and those of Chiropterans much slower. Contrary to expectations, the number of dietary transitions within a lineage does not influence rates of microbiome divergence, but instead, some of the most dramatic changes are associated with the loss of bacterial taxa, such as those accompanying the transition from terrestrial to marine lifestyles and the evolution of hominids.

Keywords: evolutionary rates; microbiome; molecular evolution; phylosymbiosis.


Figures

Figure 1
Figure 1. Association between body mass and gut microbial diversity
Microbial diversity is expressed as the number of 97% OTUs present in each mammalian host (colored-coded dots) surveyed for sequence variation in the V4 region of 16S rDNA, rarefied to 5000 reads. (A) Host species sorted to dietary category. Solid lines correspond to the regression for species greater than 1 kg, and dotted lines correspond to the regression for all species, in a particular dietary category. After removing hosts <1 kg, only herbivores display a significant positive association (assessed by Kendall rank correlation test) between microbial diversity and body mass. (B) Host species sorted taxonomically. Color-coded ellipses enclose those host species assigned to one of the five K-T lineages. Note that there is no significant relationship between microbial diversity and body mass when hosts are sorted taxonomically and that this is particularly pronounced for Cetartiodactyla, in which large marine mammals have among the lowest OTU diversity.
Figure 2
Figure 2. Phylogenetic relationships and gut microbiome compositions of mammalian hosts
Names of the five K-T lineages are boxed. Terminal branches are color-coded according to host dietary category. Taxonomic classification of gut microbes is at the level of phylum. Branching orders and divergence times obtained from sources listed in Table S3.
Figure 3
Figure 3. Principal coordinates plot showing similarity in gut microbiome composition among hosts
Ordination based on unweighted Unifrac distances among 97% OTUs. Geometric shapes denote host dietary categories, with host lineages color-coded.
Figure 4
Figure 4. Rate of microbiome divergence across mammals
Dissimilarities among species calculated from unweighted Unifrac distances of 97% OTUs for both the V2 (silver) and V4 (gold) datasets. Strengths of correlations assessed by Mantel tests with 10,000 permutations.
Figure 5
Figure 5. Effect of dietary transition on rates of microbiome divergence
Dietary transitions inferred by parsimony from the phylogeny in Figure 2. Rates are based on comparisons among species that diverged < 80 million years ago. Microbiome dissimilarities among species were calculated from unweighted Unifrac distances of 97% OTUs. Strengths of associations were assessed with a Kendall rank correlation test. (A) Rates of microbiome divergence among species that have the same diet due to either dietary convergence (upper p and τ values) or common ancestry (lower p and τ values). Note that neither omnivores nor predatory carnivores with the same diet due to common ancestry had sufficient comparisons to perform statistical tests. (B) Rates of microbiome divergence for different types of dietary transition.
Figure 6
Figure 6. Similar rates of microbiome divergence in primate sublineages
Relationship between host divergence time and microbiome dissimilarity among three lineages of Primates: Hominidae, Old World monkeys (OWM), and New World monkeys (NWM). Circles represent comparisons between nonhuman apes, and triangles represent comparisons between humans and other hominid species. The dotted line represents the relationship within Hominidae when humans, whose gut microbiomes are known to evolve at accelerated rates (Moeller et al. 2014), are included. The strength of the correlation was assessed using a Mantel test with the complete set of possible permutations.

References

    1. Amato KR, Leigh SR, Kent A, Mackie RI, Yeoman CJ, Stumpf RM, Garber PA. The role of gut microbes in satisfying the nutritional demands of adult and juvenile wild, black howler monkeys (Alouatta pigra) American Journal of Physical Anthropology. 2014;155:652–664. - PubMed
    1. Amato KR, Yeoman CJ, Cerda G, Danzy Cramer J, Berg Miller ME, Gomez A, Leigh SR. Variable responses of human and non-human primate gut microbiomes to a Western diet. Microbiome. 2015;3:53. - PMC - PubMed
    1. Andrews S. FastQC: a quality control tool for high throughput sequence data. 2010 Available from https://www.bioinformatics.babraham.ac.uk/projects/fastqc/
    1. Blaser MJ, Falkow S. What are the consequences of the disappearing human microbiota? Nature Reviews Microbiology. 2009;7:887–894. - PMC - PubMed
    1. Blekhman R, Goodrich JK, Huang K, Sun Q, Bukowski R, Bell JT, Clark AG. Host genetic variation impacts microbiome composition across human body sites. Genome Biology. 2015;16:191. - PMC - PubMed

Publication types

Substances

LinkOut - more resources