

Baseline total kidney volume and the rate of kidney growth are associated with chronic kidney disease progression in Autosomal Dominant Polycystic Kidney Disease
- PMID: 29290310
- PMCID: PMC5826779
- DOI: 10.1016/j.kint.2017.09.027
Baseline total kidney volume and the rate of kidney growth are associated with chronic kidney disease progression in Autosomal Dominant Polycystic Kidney Disease
Abstract
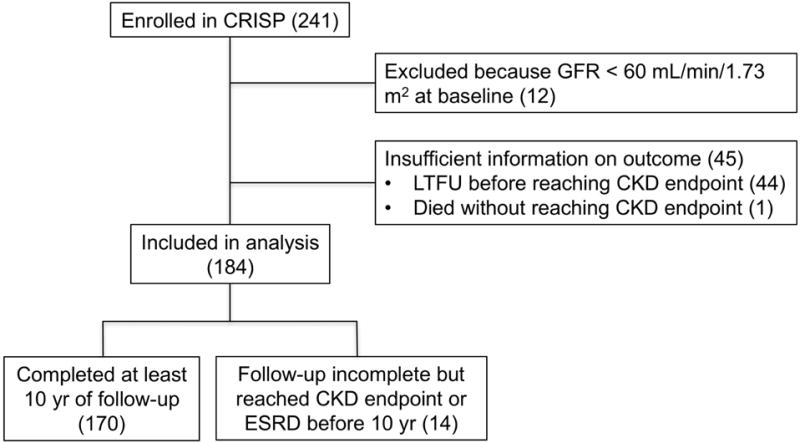
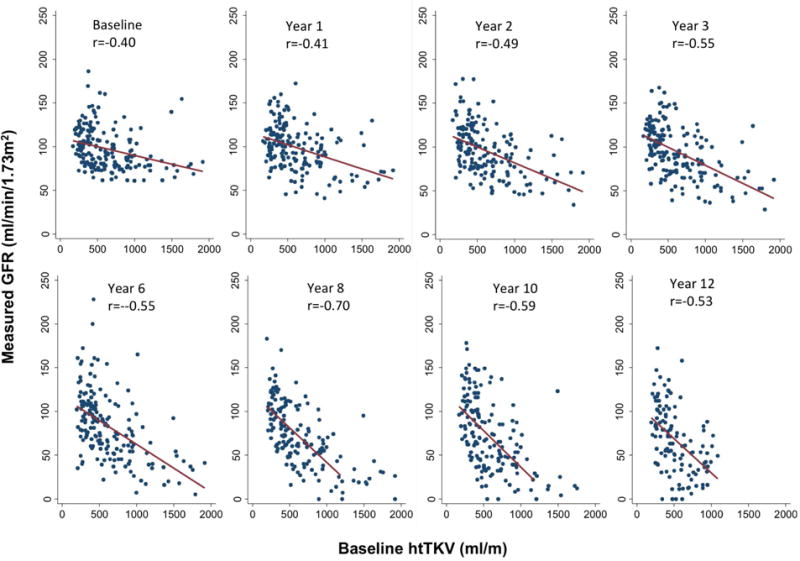
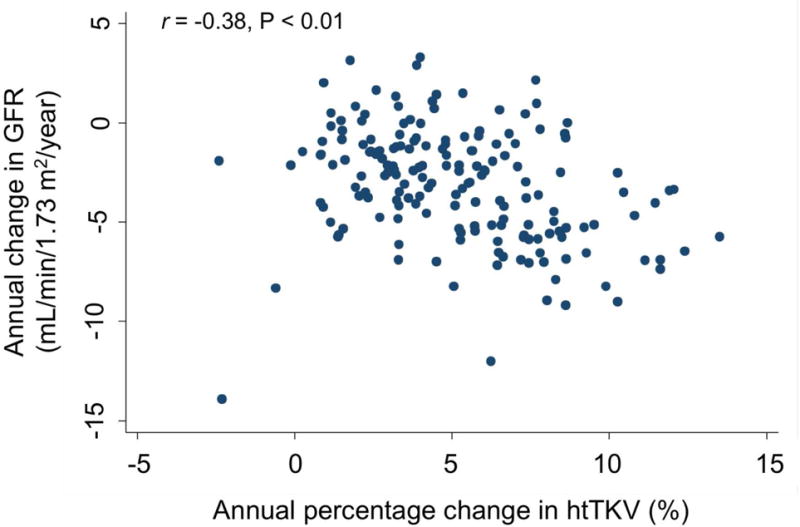
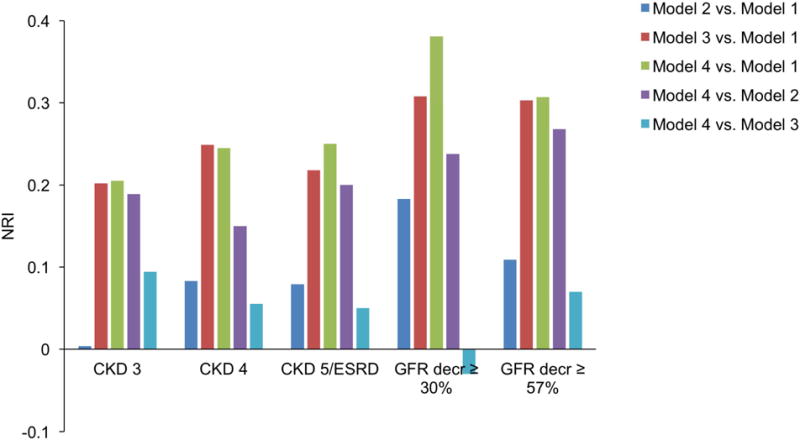
Autosomal dominant polycystic kidney disease (ADPKD) is characterized by progressive enlargement of kidney cysts leading to chronic kidney disease (CKD) and end-stage renal disease (ESRD). Identification of an early biomarker that can predict progression of CKD is urgently needed. In an earlier Consortium for Radiologic Imaging Studies of Polycystic Kidney Disease (CRISP) study (a prospective, multicenter, observational analysis of 241 patients with ADPKD initiated in 2000), baseline height-adjusted total kidney volume (htTKV) was shown to be associated with development of CKD stage 3 after eight years of follow-up. Here we conducted an extended study and found that in a multivariable logistic regression model, baseline htTKV was shown to be a strong, independent predictor for the development of CKD after a median follow-up of 13 years. The odds ratio of reaching each CKD stage per 100 mL/m increment in htTKV was 1.38 (95% confidence interval 1.19-1.60) for stage 3, 1.42 (1.23-1.64) for stage 4, and 1.35 (1.18-1.55) for stage 5 or ESRD. Baseline htTKV was also associated with relative decreases in the glomerular filtration rate of 30%, and 57% or more. Moreover, the rate of change in htTKV was negatively correlated with the slope of the glomerular filtration rate. While ADPKD genotype was also associated with CKD outcomes, it was not an independent prognostic factor after adjusting for htTKV. Thus, baseline total kidney volume and the rate of kidney growth are strongly associated with the development of advanced stages of CKD. These findings support the use of total kidney volume as a prognostic and potentially monitoring biomarker in ADPKD.
Keywords: ADPKD; chronic kidney disease; glomerular filtration rate.
Copyright © 2017 International Society of Nephrology. Published by Elsevier Inc. All rights reserved.
Conflict of interest statement
DISCLOSURES
VET, PCH and MM have received research funding from Otsuka Pharmaceuticals. FFR is a consultant for Keryx and Kadmon and has received research funding from Otsuka and Genzyme. ABC is a consultant for Otsuka, Pfizer and Sanofi, and has received research funding from Boston Scientific, Kadmon and Otsuka. All other authors declare no competing interests.
Figures
Comment in
-
Total kidney volume: the most valuable predictor of autosomal dominant polycystic kidney disease progression.Kidney Int. 2018 Mar;93(3):540-542. doi: 10.1016/j.kint.2017.10.027. Kidney Int. 2018. PMID: 29475545
References
-
- Grantham JJ. Clinical practice. Autosomal dominant polycystic kidney disease. The New England journal of medicine. 2008;359(14):1477–1485. - PubMed
-
- Ong AC, Devuyst O, Knebelmann B, Walz G, Diseases E-EWGfIK Autosomal dominant polycystic kidney disease: the changing face of clinical management. Lancet. 2015;385(9981):1993–2002. - PubMed
-
- Grantham JJ, Torres VE, Chapman AB, et al. Volume progression in polycystic kidney disease. N Engl J Med. 2006;354(20):2122–2130. - PubMed
-
- Dicks E, Ravani P, Langman D, Davidson WS, Pei Y, Parfrey PS. Incident renal events and risk factors in autosomal dominant polycystic kidney disease: a population and family-based cohort followed for 22 years. Clinical journal of the American Society of Nephrology: CJASN. 2006;1(4):710–717. - PubMed
Publication types
MeSH terms
Grants and funding
- P30 DK090728/DK/NIDDK NIH HHS/United States
- UL1 RR024153/RR/NCRR NIH HHS/United States
- UL1 TR000165/TR/NCATS NIH HHS/United States
- U01 DK056957/DK/NIDDK NIH HHS/United States
- P30 DK106912/DK/NIDDK NIH HHS/United States
- UL1 TR000001/TR/NCATS NIH HHS/United States
- M01 RR023940/RR/NCRR NIH HHS/United States
- U01 DK056943/DK/NIDDK NIH HHS/United States
- UL1 RR025777/RR/NCRR NIH HHS/United States
- U01 DK056961/DK/NIDDK NIH HHS/United States
- R01 DK044863/DK/NIDDK NIH HHS/United States
- UL1 RR024150/RR/NCRR NIH HHS/United States
- UL1 TR001417/TR/NCATS NIH HHS/United States
- UL1 RR025008/RR/NCRR NIH HHS/United States
- M01 RR000585/RR/NCRR NIH HHS/United States
- R01 DK113111/DK/NIDDK NIH HHS/United States
- UL1 TR000005/TR/NCATS NIH HHS/United States
- U01 DK056956/DK/NIDDK NIH HHS/United States
- M01 RR000039/RR/NCRR NIH HHS/United States
- UL1 RR033179/RR/NCRR NIH HHS/United States
- UL1 TR002378/TR/NCATS NIH HHS/United States
- M01 RR000032/RR/NCRR NIH HHS/United States
LinkOut - more resources
Full Text Sources
Other Literature Sources
Medical
