. 2018 Jan 25;172(3):439-453.e14.
doi: 10.1016/j.cell.2017.11.047. Epub 2017 Dec 28.

Stabilization of Reversed Replication Forks by Telomerase Drives Telomere Catastrophe

Affiliations

Stabilization of Reversed Replication Forks by Telomerase Drives Telomere Catastrophe

Pol Margalef et al. Cell. .

Abstract

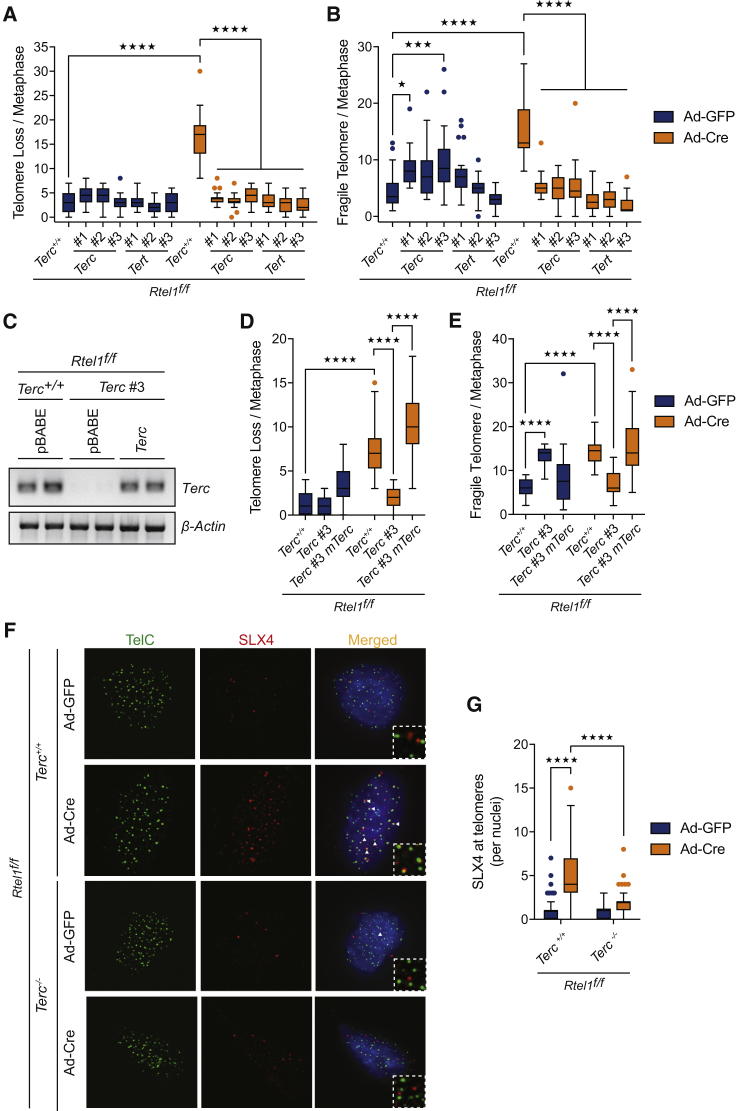
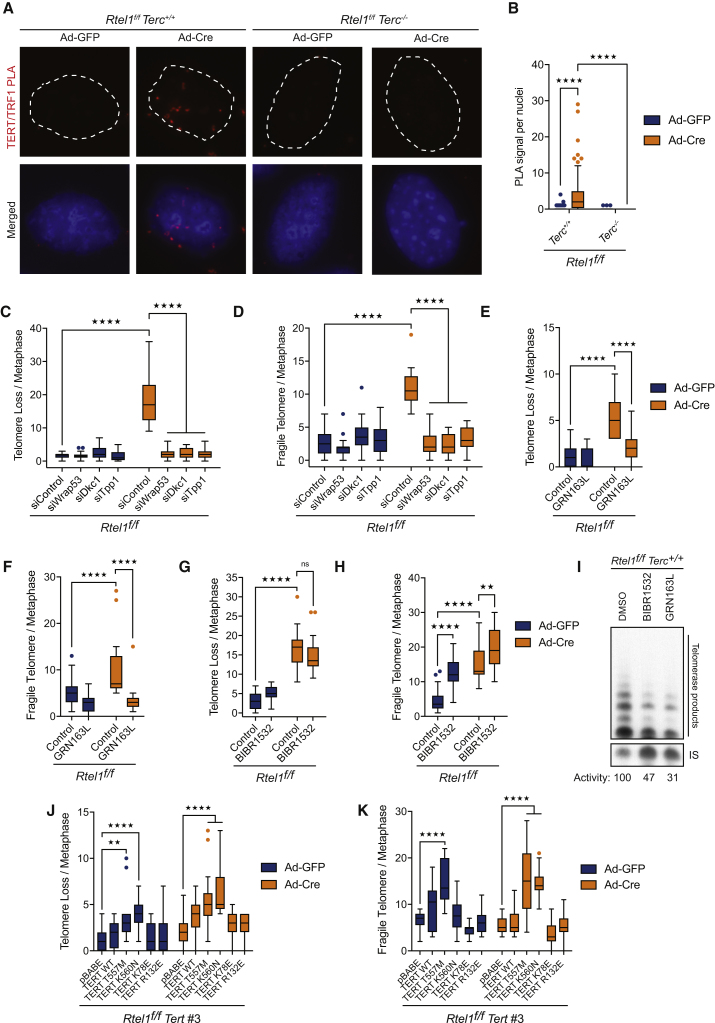
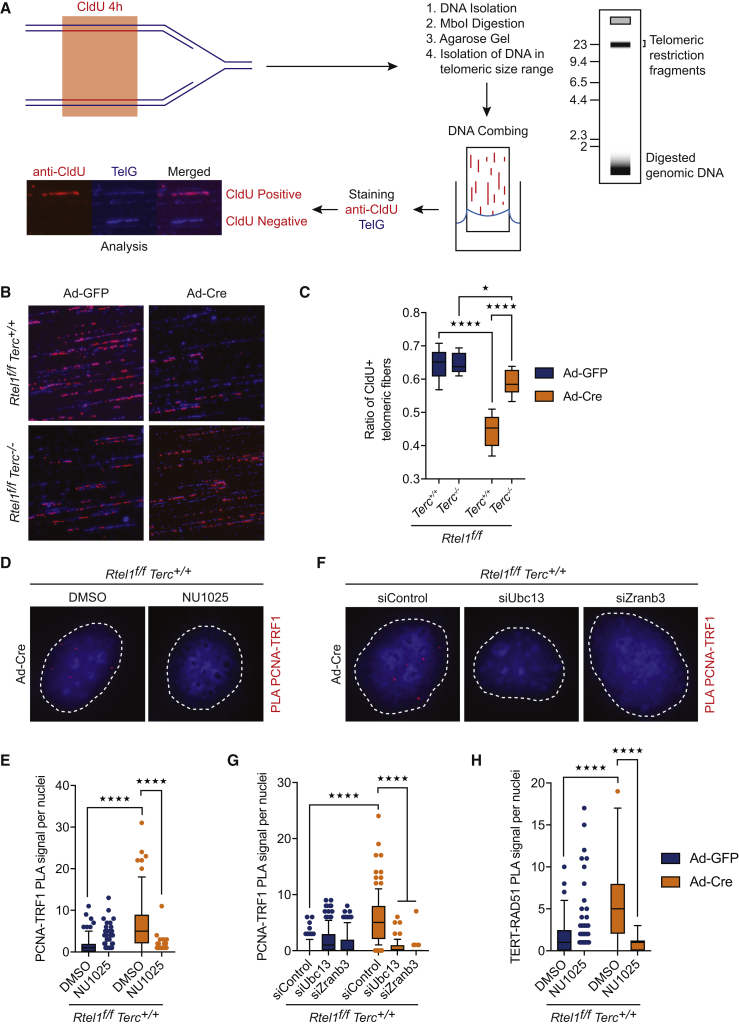
Telomere maintenance critically depends on the distinct activities of telomerase, which adds telomeric repeats to solve the end replication problem, and RTEL1, which dismantles DNA secondary structures at telomeres to facilitate replisome progression. Here, we establish that reversed replication forks are a pathological substrate for telomerase and the source of telomere catastrophe in Rtel1-/- cells. Inhibiting telomerase recruitment to telomeres, but not its activity, or blocking replication fork reversal through PARP1 inhibition or depleting UBC13 or ZRANB3 prevents the rapid accumulation of dysfunctional telomeres in RTEL1-deficient cells. In this context, we establish that telomerase binding to reversed replication forks inhibits telomere replication, which can be mimicked by preventing replication fork restart through depletion of RECQ1 or PARG. Our results lead us to propose that telomerase inappropriately binds to and inhibits restart of reversed replication forks within telomeres, which compromises replication and leads to critically short telomeres.

Keywords: Hoyeraal-Hreidarsson syndrome; PARP1; RECQ1; RTEL1; ZRANB3; genome stability; replication fork reversal; telomerase; telomeres.


Figures

None
Graphical abstract
Figure 1
Figure 1
Terc Deletion Rescues Telomere Dysfunction in Rtel1-Deficient Cells (A) Telomeric FISH to analyze telomere fusions per metaphase in cells of the indicated genotypes 96 hr after Ad-Cre infection. Representative images of chromosomes from the different genotypes are shown. (B) Quantification of metaphases with more than 5 telomere fusions in cells of the indicated genotypes. Error bars, ±SD from three independent experiments. (C) Representative images of a wild-type chromosome and abnormal chromosomes with telomere loss (yellow arrows), telomere fragility (red arrows), and telomeric length heterogeneity (white arrows). (D–F) Quantification of telomere loss (D), telomere fragility (E), and telomere length heterogeneity (F) per metaphase 96 hr after Ad-GFP or Ad-Cre infection. Representative images of telomere FISH on metaphases are shown in Figure S1C. Boxplots represent the quantification from at least 30 metaphases from a representative experiment (∗∗∗∗p < 0.0001; two-way ANOVA). (G) Phi29-dependent telomere circles (TCs) from the indicated genotypes 96 hr after Ad-GFP or Ad-Cre infection. See also Figure S1.
Figure S1
Figure S1
Terc Deletion Rescues Telomere Dysfunction in Rtel1-Deficient Cells, Related to Figure 1 (A) RTEL1 genotyping PCR on DNA derived from MAFs of the indicated genotypes 96 hours after infection. PCR products: flox, 812 bp; null, 777 bp. (B) Western Blot analysis of the different genotypes to monitor loss of endogenous RTEL1 96 hours after Cre infection. (C) Representative images of the telomere phenotypes observed in Figure 1A. Images show a representative metaphase telomere FISH of the indicated genotypes from SV40-LT (T1 and T2) and primary (C3 and C4) cells. Telomere loss, indicated with yellow arrows; telomere fragility, indicated with red arrows; telomere length heterogeneity, indicated with white arrows. (D) Quantification of T-circle formation in cells from the indicated. Error bars indicate ± SD from three independent experiments. (E) Telomere length analysis of cells from the indicated genotypes.
Figure 2
Figure 2
Deletion of Terc or Tert Prevents Telomere Dysfunction and Suppresses SLX4 Recruitment to Telomeres (A and B) Quantification of telomere loss (A) and telomere fragility (B) per metaphase in cells of the indicated genotype 96 hr after Ad-GFP or Ad-Cre infection. Boxplots represent the quantification from at least 30 metaphases from a representative experiment (p < 0.05; ∗∗∗p < 0.001; ∗∗∗∗p < 0.0001; two-way ANOVA). (C) Gel image showing expression of Terc in the different genotypes compared to β-Actin. (D and E) Quantification of telomere loss (D) and telomere fragility (E) per metaphase in cells of the indicated genotype 96 hr after Ad-GFP or Ad-Cre infection. Boxplots represent the quantification from at least 30 metaphases from a representative experiment (∗∗∗∗p < 0.0001; two-way ANOVA). (F) Immunofluorescence (IF)-FISH for TelC (telomeres-green) and SLX4 (red) in cells of the indicated genotypes. Merged image shows TelC, SLX4, and DAPI. Arrows indicate overlapping TelC and SLX4 signals. (G) Quantification of the number of SLX4 foci coincident with telomeres per nuclei of the indicated genotypes. Boxplots represent the quantification from at least 100 nuclei from a representative experiment (∗∗∗∗p < 0.0001; two-way ANOVA). See also Figures S2.
Figure S2
Figure S2
Deletion of Terc or Tert Prevents Telomere Dysfunction and Suppresses SLX4 Recruitment to Telomeres, Related to Figure 2 (A) Analysis of telomerase activity determined by TRAP assay in the different indicated clones. Telomerase activity was measured relative to the control and normalized to the internal standard (IS). (B) Quantification of telomere length heterogeneity per metaphase 96 hours after Ad-GFP or Ad-Cre infection. Boxplots represent the quantification from at least 30 metaphases from a representative experiment (∗∗∗∗p < 0.0001; two-way ANOVA). (C) Telomere length analysis of cells from the indicated genotypes. (D) Quantitative reverse transcription polymerase chain reaction (qRT-PCR) analysis of Terc gene. Data are means ± SD normalized to the expression β–Actin and relative to Rtel1f/fTerc+/+ cells. (E) Quantification of telomere length heterogeneity per metaphase 96 hours after Ad-GFP or Ad-Cre infection. Boxplots represent the quantification from at least 30 metaphases from a representative experiment (∗∗∗∗p < 0.0001; two-way ANOVA). (F) Gel image showing expression of Terc in the different genotypes compared to β–Actin. On the right, quantitative reverse transcription polymerase chain reaction (qRT-PCR) analysis of Terc gene. Data are means ± SD normalized to the expression β–Actin and relative to Rtel1f/fTerc+/+ cells. (G and H) Quantification of telomere loss (G), telomere fragility (H), and telomere length heterogeneity (I) per metaphase 96 hours after Ad-GFP or Ad-Cre infection. Boxplots represent the quantification from at least 30 metaphases from a representative experiment (∗∗∗∗p < 0.0001; two-way ANOVA).
Figure 3
Figure 3
Terc Depletion Does Not Rescue the Replication Defects Associated with Rtel1 Dysfunction (A) Quantification of non-telomere-associated 53BP1 foci per nuclei in the different genotypes. Boxplots represent the quantification from at least 150 nuclei from a representative experiment (p < 0.05; ∗∗∗∗p < 0.0001; two-way ANOVA). (B) Sensitivity of cells of the indicated genotype to increasing doses of Aphidicolin. Error bars, ±SD from three independent experiments. (C) Replication fork dynamics in cells of the indicated genotypes pulse-labeled with chlorodeoxyuridine (CldU) followed by iododeoxyuridine (IdU) and subjected to DNA combing. Images show representative fibers from Ad-GFP or Ad-Cre treatments. 150 fibers were measured per genotype, and replication fork speed was measured in kb/min (∗∗∗∗p < 0.0001; two-way ANOVA). (D) Representative images of symmetric and asymmetric forks. Quantification of the degree of fork asymmetry in the different genotypes. 30 fibers were measured per genotype (∗∗∗∗p < 0.0001; two-way ANOVA). Percentage represents the amount of asymmetric fibers relative to the total amount of measured.
Figure S3
Figure S3
Stabilization of DNA Secondary Structures Leads to Aberrant Accumulation of Telomerase at Telomeres, Related to Figure 4 (A) Analysis of telomerase activity determined by TRAP assay in the different indicated genotypes. Error bars indicate ± SD from two independent experiments. (B and C) Quantification of the interaction between TERT and TRF2 as determined by in situ PLA assay in the cells indicated. Data represents quantification from at least 150 nuclei from a representative experiment (∗∗∗∗p < 0.0001; two-way ANOVA). Dashed lines indicate nucleus (as determined by DAPI in blue). (D and E) Representative images and quantification of the localisation of Terc RNA (red) at telomeres (TelC-Green) as determined by in situ RNAscope assay coupled to telomere FISH in cells of the indicated genotype. Arrows indicate colocalization between Terc RNA and TelC (telomere). Data represents quantification from at least 150 nuclei from a representative experiment (∗∗∗∗p < 0.0001; two-way ANOVA).
Figure 4
Figure 4
Stabilization of DNA Secondary Structures Leads to Aberrant Accumulation of Telomerase at Telomeres (A and B) Representative images (A) and quantification of the frequency (B) of interaction between TERT and TRF1 as determined by in situ PLA assay in cells of the indicated genotype. Dashed lines indicate nucleus (as determined by DAPI in blue). Data represent quantification from at least 150 nuclei from a representative experiment (∗∗∗∗p < 0.0001; two-way ANOVA). (C and D) Quantification of telomere loss (C) and telomere fragility (D) per metaphase 96 hr after Ad-GFP or Ad-Cre infection in cells of the indicated genotype. Boxplots represent the quantification from at least 30 metaphases from a representative experiment (∗∗∗∗p < 0.0001; two-way ANOVA). (E–H) Quantification of telomere loss (E and G) and telomere fragility (F and H) per metaphase 96 hr after Ad-GFP or Ad-Cre infection in cells treated with GRN163L (E and F) or BIBR1532 (G and H). Representative images of telomere FISH on metaphases are shown in Figure S5D. Boxplots represent the quantification from at least 30 metaphases from a representative experiment (∗∗p < 0.01; ∗∗∗∗p < 0.0001; two-way ANOVA). (I) Analysis of telomerase activity determined by TRAP assay on cells of the indicated genotype treated with BIBR1532 or GRN162L. Telomerase activity was measured relative to the control and normalized to the internal standard (IS). (J and K) Quantification of telomere loss (J) and telomere fragility (K) per metaphase 96 hr after Ad-GFP or Ad-Cre infection in cells of the indicated genotype. Representative images of telomere FISH on metaphases are shown in Figure S5M. Boxplots represent the quantification from at least 30 metaphases from a representative experiment (∗∗p < 0.01; ∗∗∗∗p < 0.0001; two-way ANOVA). See also Figures S3 and S4.
Figure S4
Figure S4
Stabilization of DNA Secondary Structures Leads to Aberrant Accumulation of Telomerase at Telomeres, Related to Figure 4 (A) Quantification of telomere length heterogeneity per metaphase 96 hours after Ad-GFP or Ad-Cre infection. Boxplots represent the quantification from at least 30 metaphases from a representative experiment (∗∗∗∗p < 0.0001; two-way ANOVA). (B) qRT-PCR analysis of the indicated genes. Data are means ± SD normalized to the expression β–Actin and relative to control. (∗∗p < 0.01∗∗∗p < 0.001; two-way ANOVA). (C) Western Blot analysis of the different genotypes to monitor loss of endogenous TPP1 96 hours after Cre infection. (D) Images show a representative metaphase telomere FISH of the indicated drug treatments. Telomere loss, indicated with yellow arrows; telomere fragility, indicated with red arrows; telomere length heterogeneity, indicated with white arrows. (E and F) Quantification of telomere length heterogeneity per metaphase 96 hours after Ad-GFP or Ad-Cre infection in cells treated with GRN163L (E) or BIBR1532 (F). Boxplots represent the quantification from at least 30 metaphases from a representative experiment (∗∗∗∗p < 0.0001; two-way ANOVA). (G) Western Blot analysis of the different genotypes to monitor expression of TERT. (H) Images show a representative metaphase telomere FISH of the indicated genotypes. Telomere loss, indicated with yellow arrows; telomere fragility, indicated with red arrows; telomere length heterogeneity, indicated with white arrows. (I) Quantification of telomere length heterogeneity per metaphase 96 hours after Ad-GFP or Ad-Cre infection. Boxplots represent the quantification from at least 30 metaphases from a representative experiment (∗∗∗∗p < 0.0001; two-way ANOVA).
Figure 5
Figure 5
Rtel1 Telomeric Dysfunction Is Rescued by Blocking Replication Fork Reversal (A) Schematic of the process of replication fork reversal and the different genes involved in fork reversal and fork restart. (B and C) Representative images (B) and quantification of the frequency (C) of PARP1 foci (red) coincident with telomeres (TelC, green) in cells of the indicated genotypes. Arrows indicate TelC-PARP1 colocalization events. Boxplots represent the quantification from at least 150 nuclei from a representative experiment (∗∗∗∗p < 0.0001; two-way ANOVA). (D and E) Quantification of telomere loss (D) and telomere fragility (E) per metaphase in cells of the indicated genotype 96 hr after Ad-GFP or Ad-Cre infection. Boxplots represent the quantification from at least 30 metaphases from a representative experiment (∗∗∗∗p < 0.0001; two-way ANOVA). (F) Western blot analysis showing PARylated proteins in cells subject to the indicated PARP inhibitor treatments (5 μM Olaparib and 10 μM NU1025). (G and H) Quantification of telomere loss (G) and telomere fragility (H) per metaphase in cells of the indicated genotype 96 hr after Ad-GFP or Ad-Cre infection. Representative images of telomere FISH on metaphases are shown in Figure S7A. Boxplots represent the quantification from at least 30 metaphases from a representative experiment (∗∗∗∗p < 0.0001; two-way ANOVA). (I) Representative images and quantification of the frequency of interaction between TERT and TRF1 as determined by in situ PLA assay in Rtel1-deficient cells subject to the indicated siRNA treatment. Data represent quantification from at least 150 nuclei from a representative experiment (∗∗∗∗p < 0.0001; two-way ANOVA). Dashed lines indicate nucleus (as determined by DAPI in blue). See also Figures S3.
Figure S5
Figure S5
Rtel1 Telomeric Dysfunction Is Rescued by Blocking Replication Fork Reversal, Related to Figure 5 (A) Quantification of telomere length heterogeneity per metaphase 96 hours after Ad-GFP or Ad-Cre infection. Boxplots represent the quantification from at least 30 metaphases from a representative experiment (∗∗∗∗p < 0.0001; two-way ANOVA). (B and D) Quantification of telomere loss (B), telomere fragility (C), and telomere length heterogeneity (D) per metaphase 96 hours after Ad-GFP or Ad-Cre infection. Boxplots represent the quantification from at least 30 metaphases from a representative experiment (∗∗∗∗p < 0.0001; two-way ANOVA). (E) Western Blot analysis of the different genotypes to monitor loss of endogenous PARP1 96 hours after Cre infection, as well as total PARylated proteins. (F) Images show a representative metaphase telomere FISH of the indicated genotypes. Telomere loss, indicated with yellow arrows; telomere fragility, indicated with red arrows; telomere length heterogeneity, indicated with white arrows. (G) Quantification of telomere length heterogeneity per metaphase 96 hours after Ad-GFP or Ad-Cre infection. Boxplots represent the quantification from at least 30 metaphases from a representative experiment (∗∗∗∗p < 0.0001; two-way ANOVA). (H) Western Blot analysis of the different genotypes to monitor loss of endogenous UBC13 (left) and ZRANB3 (right) 96 hours after Cre infection. (I and K) Quantification of telomere loss (I), telomere fragility (J), and telomere length heterogeneity (K) per metaphase 96 hours after Ad-GFP or Ad-Cre infection. Boxplots represent the quantification from at least 30 metaphases from a representative experiment (∗∗∗∗p < 0.0001; two-way ANOVA). (L) Quantification of the interaction between TERT and TRF1 as determined by in situ PLA assay in the different indicated treatments. Data represents quantification from at least 150 nuclei from a representative experiment (∗∗∗∗p < 0.0001; two-way ANOVA). (M) Analysis of telomerase activity determined by TRAP assay in the presence of BSA or recombinant RTEL1. Telomerase activity was measured relative to the control and normalized to the internal standard (IS).
Figure 6
Figure 6
Prevention of Replication Fork Restart Mimics Telomerase-Induced Telomere Dysfunction (A and B) Quantification of telomere loss (A) and telomere fragility (B) per metaphase 96 hr after Ad-GFP or Ad-Cre infection in cells subject to the indicated siRNA treatment. Representative images of telomere FISH on metaphases are shown in Figure S6D. Boxplots represent the quantification from at least 30 metaphases from a representative experiment (∗∗∗∗p < 0.0001; two-way ANOVA). (C) Western blot analysis showing PARylated proteins in cells of the indicated genotypes subject to control and Parg siRNA. (D and E) Quantification of telomere loss (D) and telomere fragility (E) per metaphase in cells of the indicated genotype 96 hr after Ad-GFP or Ad-Cre infection. Representative images of telomere FISH on metaphases are shown in Figure S6D. Boxplots represent the quantification from at least 30 metaphases from a representative experiment (∗∗∗∗p < 0.0001; two-way ANOVA). (F and G) Representative images (F) and quantification of the frequency (G) of SLX4 (green) colocalizing with TelG (telomeres-red) per nuclei in cells of the indicated genotypes. Arrows indicate SLX4-TelG colocalization events. Boxplots represent the quantification from at least 150 nuclei from a representative experiment (∗∗∗∗p < 0.0001; two-way ANOVA). See also Figure S6.
Figure S6
Figure S6
Prevention of Replication Fork Restart Mimics Telomerase-Induced Telomere Dysfunction, Related to Figure 6 (A) Quantification of telomere length heterogeneity per metaphase 96 hours after Ad-GFP or Ad-Cre infection. Boxplots represent the quantification from at least 30 metaphases from a representative experiment (∗∗∗∗p < 0.0001; two-way ANOVA). (B) qRT-PCR analysis of Recq1 gene. Data are means ± SD normalized to the expression β–Actin and relative to control. (∗∗∗∗p < 0.0001; two-way ANOVA). (C) Quantification of telomere length heterogeneity per metaphase 96 hours after Ad-GFP or Ad-Cre infection. Boxplots represent the quantification from at least 30 metaphases from a representative experiment (∗∗∗∗p < 0.0001; two-way ANOVA). (D) Images show a representative metaphase telomere FISH of the indicated genotypes. Telomere loss, indicated with yellow arrows; telomere fragility, indicated with red arrows; telomere length heterogeneity, indicated with white arrows. (E–G) Quantification of telomere loss (E), telomere fragility (F), and telomere length heterogeneity (G) per metaphase 96 hours after Ad-GFP or Ad-Cre infection. Boxplots represent the quantification from at least 30 metaphases from a representative experiment (∗∗∗∗p < 0.0001; two-way ANOVA).
Figure 7
Figure 7
Telomerase Binding to Reversed Replication Forks Inhibits Replication at Telomeres (A) Schematic representation of the SMARD protocol used to monitor replication dynamics at telomeres. The image shows CldU positive and negative telomeric fibers. (B) Representative images of the indicated genotypes showing replication dynamics at telomeres. TelG (blue); CldU (red). (C) Quantification of CldU positive telomeric fibers in cells of the indicated genotype 96 hr after Ad-GFP or Ad-Cre infection. Boxplots represent the quantification from at least 750 telomeric fibers from a representative experiment (p < 0.05; ∗∗∗∗p < 0.0001; two-way ANOVA). (D–G) Representative images (D and F) and quantification of the frequency of interaction (E and G) between PCNA and TRF1 as determined by in situ PLA assay in cells treated with NU1025 (D and E) or transfected with the indicated siRNAs (F and G). Data represent quantification from at least 150 nuclei from a representative experiment (∗∗∗∗p < 0.0001; two-way ANOVA). Dashed lines indicate nucleus (as determined by DAPI in blue). (H) Quantification of the frequency of interaction between TERT and RAD51 as determined by in situ PLA assay in cells treated with NU1025. Data represent quantification from at least 150 nuclei from a representative experiment (∗∗∗∗p < 0.0001; two-way ANOVA). See also Figure S7.
Figure S7
Figure S7
Telomerase Binding to Reversed Replication Forks Inhibits Replication at Telomeres, Related to Figure 7 (A) Representative images (from Figure 7H) of the interaction between TERT and RAD51 (using ab63801, Abcam) determined by in situ PLA assay in the different indicated treatments. Dashed lines indicate nucleus (as determined by DAPI in blue). (B and C) Representative images and quantification of the interaction between TERT and RAD51 (using PC130, Millipore) determined by in situ PLA assay in the different indicated treatments. Data represents quantification from at least 150 nuclei from a representative experiment (∗∗∗∗p < 0.0001; two-way ANOVA). Dashed lines indicate nucleus (as determined by DAPI in blue). (D) Schematic model of the impact of fork reversal and telomerase at telomeres in cells of the indicated genotypes. In WT cells, RTEL1 dismantles t-loops in S-phase to allow replication to occur unimpeded through the telomere. In Rtel1−/− cells, persistent T-loops hinder the replisome and trigger replication fork reversal within the telomere. The resulting single ended DSB of the reversed fork is bound by telomerase, which stabilize the reversed fork and blocks fork restart. In an attempt to remove the impasse to the replisome, SLX1/4 is recruited to the telomere where it cleaves off the t-loop resulting in the telomere dysfunction observed in Rtel1−/− cells. In cells lacking telomerase or inhibited for fork reversal, the replisome proceeds through the telomere and displaces the t-loop in its wake to complete telomere replication.

Comment in

  • When Telomerase Causes Telomere Loss.
    Glousker G, Lingner J. Glousker G, et al. Dev Cell. 2018 Feb 5;44(3):281-283. doi: 10.1016/j.devcel.2018.01.011. Epub 2018 Feb 5. Dev Cell. 2018. PMID: 29408234

Similar articles

Cited by

References

    1. Asai A., Oshima Y., Yamamoto Y., Uochi T.A., Kusaka H., Akinaga S., Yamashita Y., Pongracz K., Pruzan R., Wunder E. A novel telomerase template antagonist (GRN163) as a potential anticancer agent. Cancer Res. 2003;63:3931–3939. - PubMed
    1. Ballew B.J., Joseph V., De S., Sarek G., Vannier J.B., Stracker T., Schrader K.A., Small T.N., O’Reilly R., Manschreck C. A recessive founder mutation in regulator of telomere elongation helicase 1, RTEL1, underlies severe immunodeficiency and features of Hoyeraal Hreidarsson syndrome. PLoS Genet. 2013;9:e1003695. - PMC - PubMed
    1. Ballew B.J., Yeager M., Jacobs K., Giri N., Boland J., Burdett L., Alter B.P., Savage S.A. Germline mutations of regulator of telomere elongation helicase 1, RTEL1, in Dyskeratosis congenita. Hum. Genet. 2013;132:473–480. - PMC - PubMed
    1. Berti M., Ray Chaudhuri A., Thangavel S., Gomathinayagam S., Kenig S., Vujanovic M., Odreman F., Glatter T., Graziano S., Mendoza-Maldonado R. Human RECQ1 promotes restart of replication forks reversed by DNA topoisomerase I inhibition. Nat. Struct. Mol. Biol. 2013;20:347–354. - PMC - PubMed
    1. Bétous R., Mason A.C., Rambo R.P., Bansbach C.E., Badu-Nkansah A., Sirbu B.M., Eichman B.F., Cortez D. SMARCAL1 catalyzes fork regression and Holliday junction migration to maintain genome stability during DNA replication. Genes Dev. 2012;26:151–162. - PMC - PubMed

Publication types