. 2018 Jan 17;97(2):299-312.e6.
doi: 10.1016/j.neuron.2017.12.002. Epub 2017 Dec 28.

Microglial Ramification, Surveillance, and Interleukin-1β Release Are Regulated by the Two-Pore Domain K+ Channel THIK-1

Affiliations

Microglial Ramification, Surveillance, and Interleukin-1β Release Are Regulated by the Two-Pore Domain K+ Channel THIK-1

Christian Madry et al. Neuron. .

Abstract

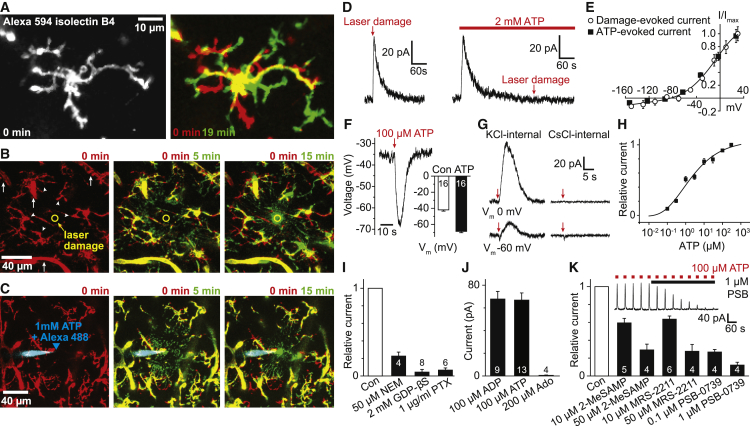
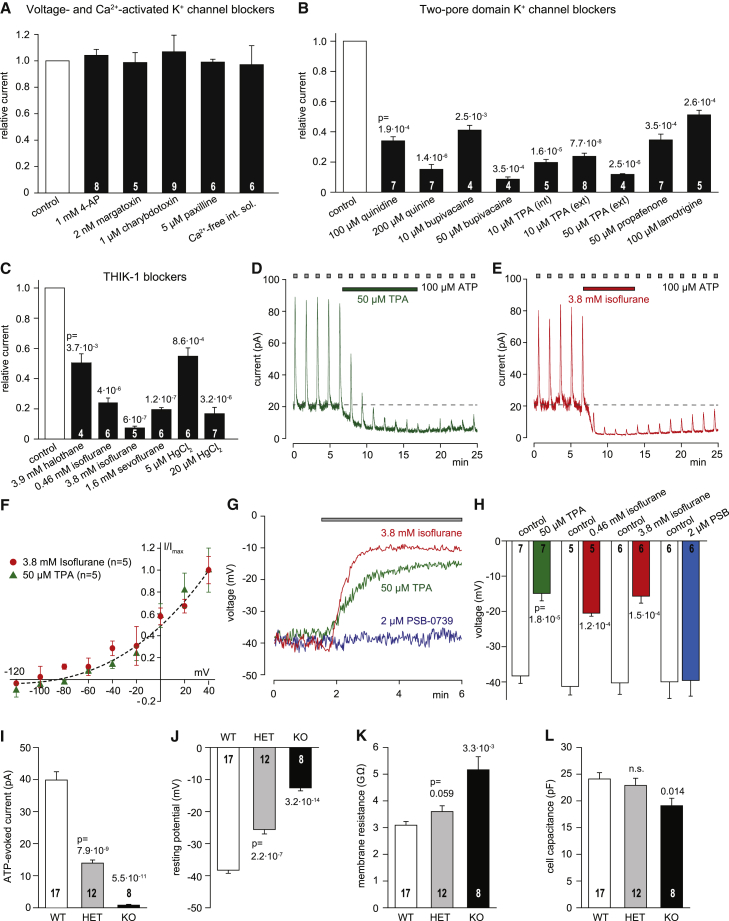
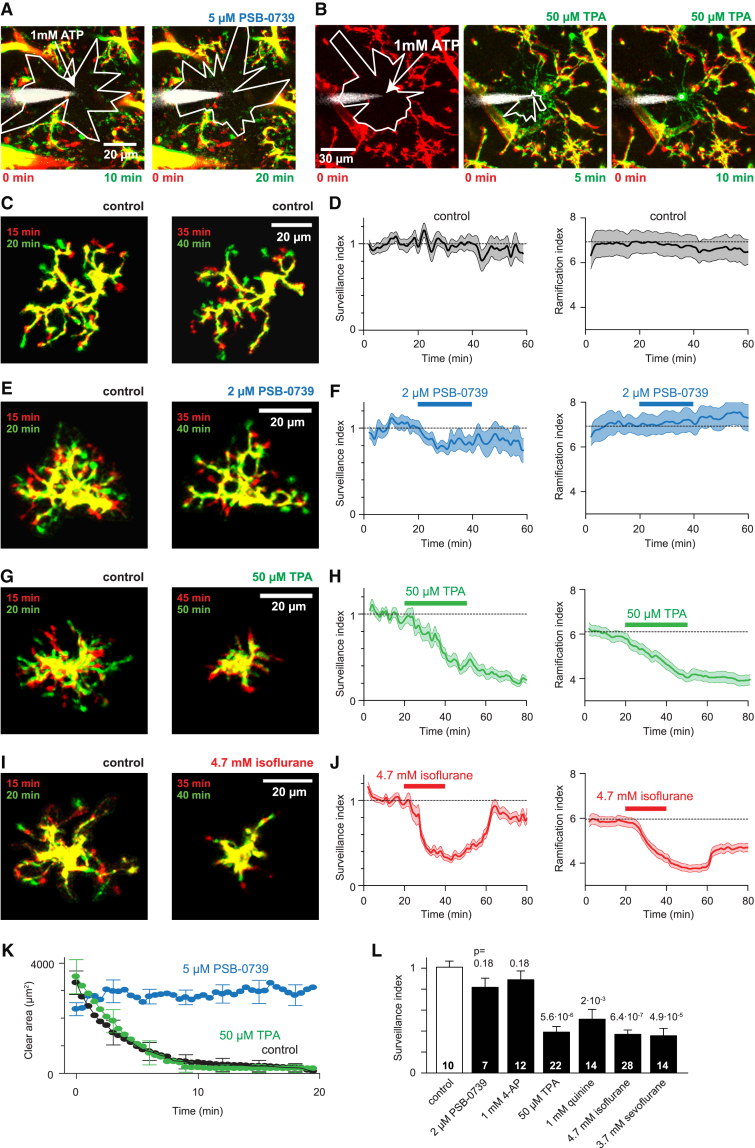
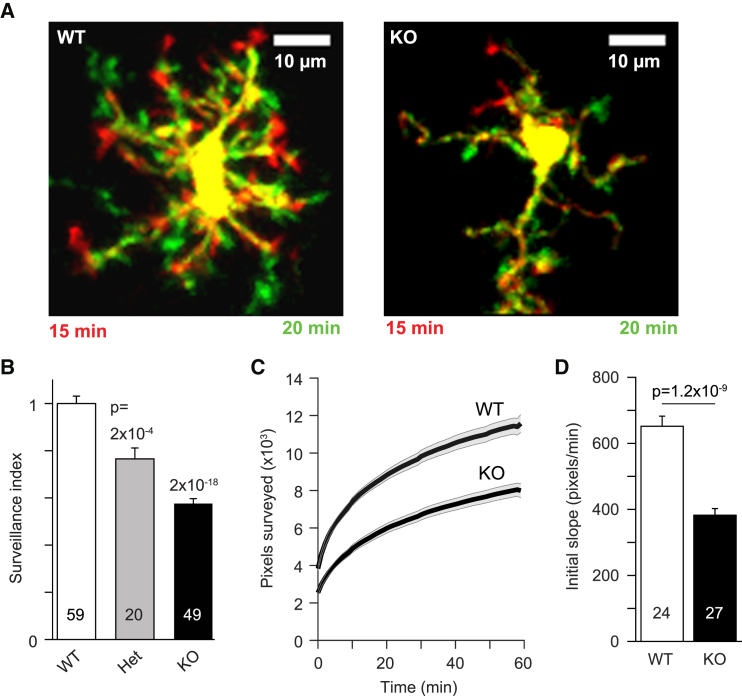
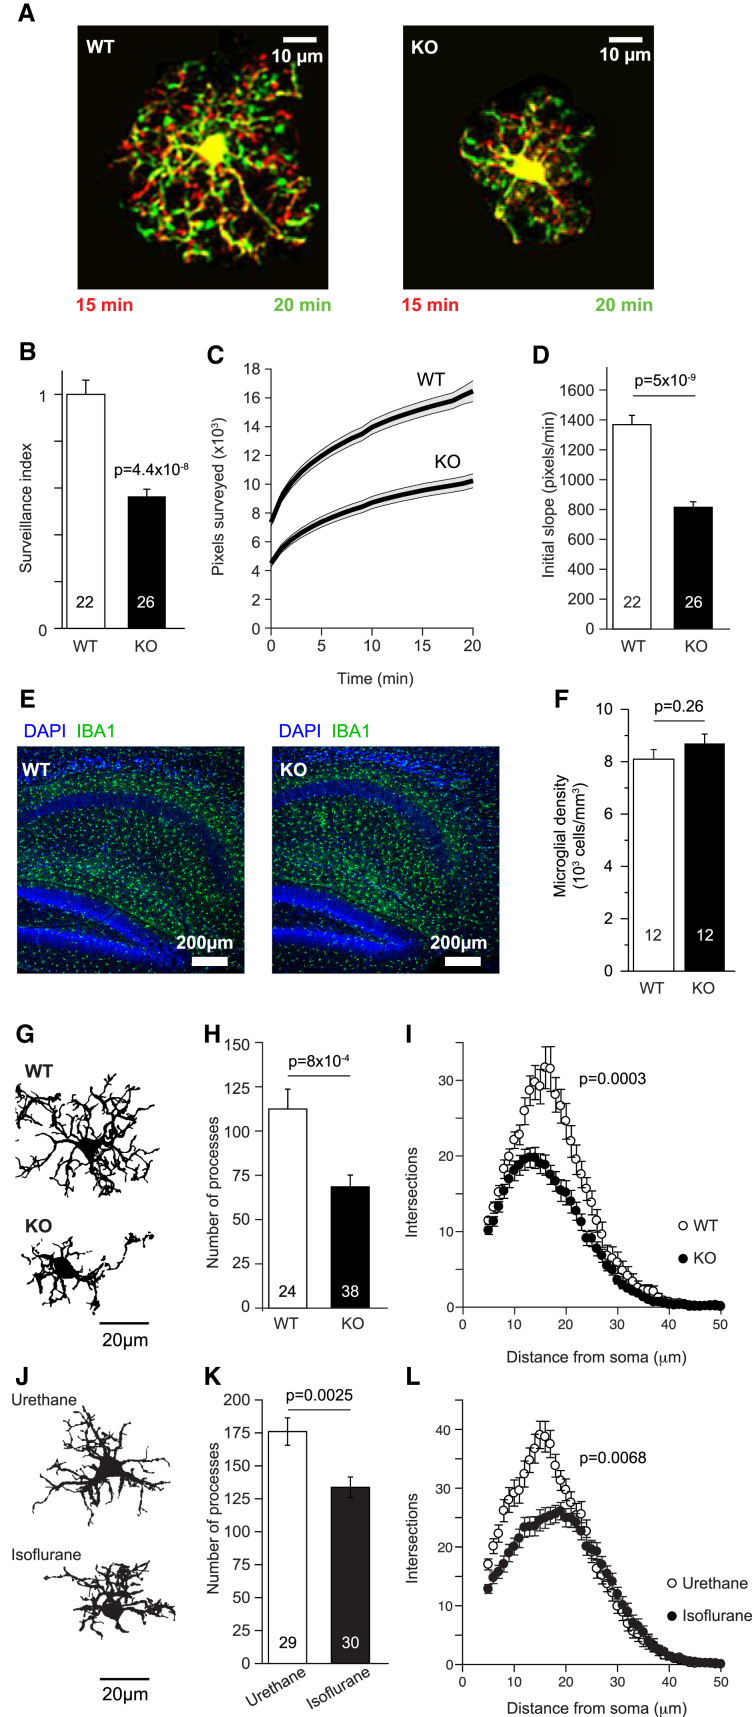
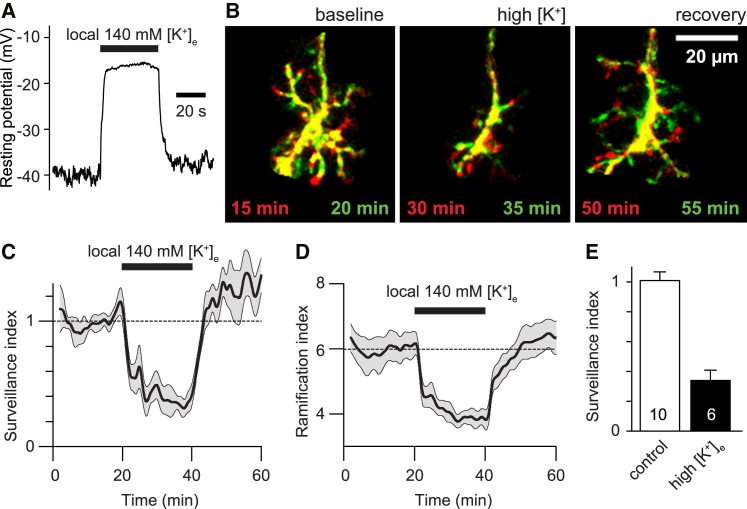
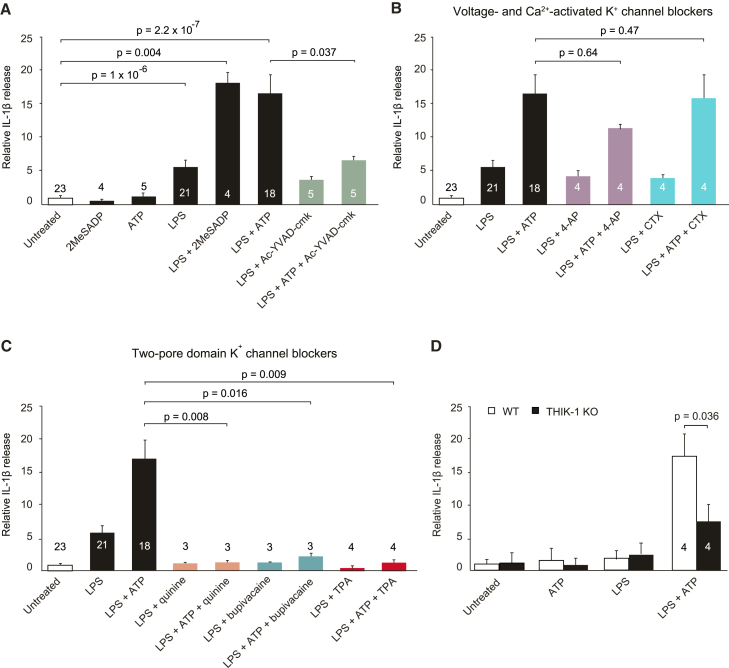
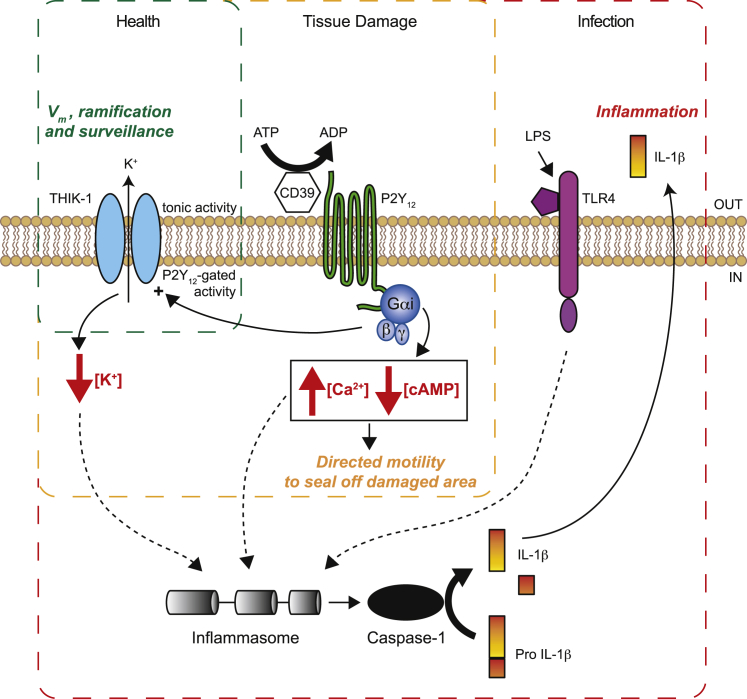
Microglia exhibit two modes of motility: they constantly extend and retract their processes to survey the brain, but they also send out targeted processes to envelop sites of tissue damage. We now show that these motility modes differ mechanistically. We identify the two-pore domain channel THIK-1 as the main K+ channel expressed in microglia in situ. THIK-1 is tonically active, and its activity is potentiated by P2Y12 receptors. Inhibiting THIK-1 function pharmacologically or by gene knockout depolarizes microglia, which decreases microglial ramification and thus reduces surveillance, whereas blocking P2Y12 receptors does not affect membrane potential, ramification, or surveillance. In contrast, process outgrowth to damaged tissue requires P2Y12 receptor activation but is unaffected by blocking THIK-1. Block of THIK-1 function also inhibits release of the pro-inflammatory cytokine interleukin-1β from activated microglia, consistent with K+ loss being needed for inflammasome assembly. Thus, microglial immune surveillance and cytokine release require THIK-1 channel activity.

Keywords: ATP; THIK-1; inflammasome; interleukin-1β; microglia; potassium channel; ramification; surveillance.


Figures

Figure 1
Figure 1
Microglial Surveillance, Directed Motility, and Damage-Evoked Membrane Current in Hippocampal Slices (A) Left: Microglial cell labeled with Alexa 594-isolectin B4. Right: Superimposed images of the same cell (green and red) at an interval of 19 min, showing process movement during surveillance (red, retracted; green, extended processes; same convention in subsequent time-lapse panels). (B) Microglial processes (arrowheads) converging on a laser-damaged region (10 μm circle, time after damage indicated). Blood vessels (arrows) are also labeled by isolectin B4. (C) Microglial processes converging on tip (arrowhead) of a pipette filled with 1 mM ATP (and Alexa 488, recolored blue). (D) Patch-clamped microglial membrane current at 0 mV evoked by laser damage (left) is mimicked and occluded by 2 mM ATP (right). (E) Voltage dependence of laser damage- and ATP-induced currents in 5 and 9 microglia, respectively. (F) ATP (puffed at arrow) evokes hyperpolarization of microglia (inset: mean values differ significantly, p = 1.2 × 10−12). (G) 100 μM ATP-evoked currents at 0 and −60 mV with K+ and Cs+ in pipette. (H) Dependence of ATP-evoked current at 0 mV on puffed [ATP]. (I) Effect on ATP-evoked current of bath applied N-ethyl-maleimide (NEM, 50 μM, p = 6.7 × 10−5, paired t test), GDPβS in the patch pipette (2 mM replacing 0.5 mM GTP, p = 3.4 × 10−10, unpaired t test), and pertussis toxin (PTX, 1 μg/ml, control and pertussis-exposed slices were incubated for 24 hr at 37°C, p = 4.6 × 10−6, unpaired t test). (J) Mean currents evoked at 0 mV by puffed ATP and ADP (both 100 μM), and superfused 200 μM adenosine. (K) ATP/ADP-evoked current at 0 mV is blocked by 0.1 or 1 μM PSB-0739 (PSB, p = 6.7 × 10−4 and 6.2 × 10−4), 10 or 50 μM MRS-2211 (p = 6.1 × 10−4 and 2.6 × 10−3), and 10 or 50 μM 2-MeS-AMP (p = 4.0 × 10−3 and 3.2 × 10−3); p values from paired t tests. Inset shows block of ATP-evoked current by PSB-0739. p values, here and in other figures, were corrected for multiple comparisons within each panel. All data are from P12 rat. Data are represented as mean ± SEM. See also Figure S1.
Figure 2
Figure 2
ATP and ADP Gate an Anesthetic-Sensitive Tonically Active Two-Pore Domain K+ Channel (A–C) Effect on the 100 μM ATP-evoked current at 0 mV, normalized to control data in the same cell, of the following agents. (A) Blockers of voltage- and calcium-gated K+ channels. (B) Blockers of two-pore domain channels (quinidine and quinine also block voltage-gated K+ channels, and bupivacaine, propafenone and lamotrigine also block voltage-gated Na+ channels, but all block two-pore K+ channels). (C) Effects of gaseous anesthetics and Hg2+. (D and E) Response to repeatedly puffed ATP (100 μM) during superfusion of (D) tetrapentylammonium or (E) isoflurane shows a suppression of baseline current and of the response to ATP. (F) Voltage dependence of the baseline current suppressed by tetrapentylammonium and isoflurane. (G) Effect of tetrapentylammonium, isoflurane, and PSB-0739 on the microglial resting potential. (H) Mean resting potential in the agents in (G), compared with the resting potential before the drug was applied (control). The lower concentration of isoflurane (0.46 mM) is a level reached in anesthesia. (A–H) are from P12 rat. (I–L) Values of (I) ATP-evoked current, (J) membrane potential, (K) membrane resistance, and (L) cell capacitance for microglia in P15-22 mice that are WT, heterozygote, or KO for THIK-1. Numbers of cells are on bars. Data are from hippocampal slices, and are represented as mean ± SEM. See also Figures S1, S4, and S5.
Figure 3
Figure 3
Effect on Directed Motility and Surveillance of P2Y12 and THIK-1 Block in Hippocampal Slices (A and B) Effect of (A) PSB-0739 (PSB) to block P2Y12 receptors (contrast with Figure 1C) and (B) tetrapentylammonium (TPA) to block THIK-1 channels, on directed motility (quantified in K) toward a pipette (arrow) filled with 1 mM ATP (and Alexa 488, white, for visualization). Images taken at times shown after placing the pipette; colors as in Figure 1A. (C and D) Long-term stability of surveillance revealed by (C) images taken 5 min apart in control conditions, showing many process extensions (green) and retractions (red), and (D) time course of surveillance and ramification indices (see STAR Methods). (E and F) As for (C) and (D) but with application of PSB-0739 to block P2Y12, showing no significant effect (see L) on surveillance and ramification. (G–J) As for (E) and (F) but applying TPA (G and H) or isoflurane (I and J) to block THIK-1, showing reduced ramification and fewer process extensions and retractions with THIK-1 blocked. (K) Time course of directed motility quantified as reduction of the “clear area” not occupied by microglia around a laser-damaged spot (white polygon on A and B; see STAR Methods and Movie S3) in control conditions (n = 10) and with PSB (n = 6) or TPA (n = 7) present. (L) Mean effects of drugs on surveillance (averaged over last 5 min in each drug). Number of microglia shown on bars; p values compared with control data (white bar, averaged 35–40 min in D) were from Mann-Whitney tests. A higher [PSB] is used in (A) than in (E), because PSB blocks P2Y12 receptors competitively (Hoffmann et al., 2009) and a high [ATP] is used in (A). All data are from P12 rat. Data are represented as mean ± SEM. See also Figures S1 and S4.
Figure 4
Figure 4
Effect of THIK-1 Knockout on Microglial Surveillance, Morphology, and Density in Hippocampal Slices (A) Specimen images taken 5 min apart of WT (P27) and THIK-1 KO Iba1-GFP (P21) microglia, showing process extensions and retractions (colors as in Figure 1A) and the less ramified shape of microglia in the KO. (B) Quantification of surveillance for microglia from P20–P27 WT, heterozygote (Het), and KO mice, showing increasing inhibition of surveillance from Het to KO. (C) Time course of increase of the number of surveyed pixels in maximum-intensity projections of images of microglia (as in Movie S5, numbers of cells on bars in D) in WT and KO microglia in Iba1-GFP mice aged P20–P27. Initial value is the area of the cell in the first image frame. (D) Initial slope of graphs in (C) (measured over the first 2 min, when assessment of surveillance is least confounded by pixel overlap in the maximum-intensity projection). Data are represented as mean ± SEM. See also Figures S2 and S5.
Figure 5
Figure 5
Effect of THIK-1 Knockout on Microglial Surveillance, Morphology, and Density, In Vivo (A) Specimen images taken 5 min apart in vivo of WT (P23) and THIK-1 KO Iba1-GFP (P22) microglia, showing process extensions and retractions (colors as in Figure 1A) and the less ramified shape of microglia in the KO. (B) Quantification of surveillance for microglia from P21–P27 WT and KO mice, showing less surveillance in the KO. (C) Time course of increase of the number of surveyed pixels in maximum-intensity projections of images of microglia (as in Movie S5, numbers of cells on bars in D) in WT and KO Iba1-GFP mice aged P21–P27. Initial value is the area of the cell in the first image frame. (D) Initial slope of graphs in (C) (measured over the first 2 min, when assessment of surveillance is least confounded by pixel overlap in the maximum-intensity projection). (E) Specimen images of perfusion-fixed WT and THIK-1 KO hippocampal slices labeled for Iba1 show that microglial density and tiling appear unchanged in the KO. (F) Microglial density in the strata radiatum and lacunosum-moleculare of areas CA1-CA3 of 12 WT and 12 KO hippocampal slices (from 3 WT and 3 KO animals at P20–P27). (G–I) Ramification analysis of P17–P21 microglia from perfusion-fixed WT and THIK-1 KO mice showing (G) representative 3D-reconstructed WT and KO microglia, and (H and I) Sholl analysis-derived number of processes (H) and number of process intersections with shells at distances (in 1 μm increments) from the soma (I). (J–L) Ramification analysis (as in G–I) of microglia in perfusion-fixed P12 rats that had been anaesthetised for 1 hr either with isoflurane or urethane. p values in (I) and (L) compare distributions (using two-way ANOVA). Data are represented as mean ± SEM. See also Figures S2 and S5.
Figure 6
Figure 6
Effect of Depolarization on Microglial Ramification and Surveillance (A) Effect of locally applying 140 mM [K+]o solution on P12 rat microglial membrane potential in hippocampal slices. (B) Images taken 5 min apart of microglial morphology in normal solution, during depolarization by perfusion of high-[K+]o solution in TTX, and on recovery from the high-[K+]o solution (colors as in Figure 1A). (C and D) Time course of (C) surveillance and (D) ramification during application of high-[K+]o solution. (E) Mean surveillance index in control and high-[K+]o solution. Data are represented as mean ± SEM. See also Figure S3.
Figure 7
Figure 7
THIK-1 Inhibition Suppresses Interleukin-1β Release (A) ELISA-measured IL-1β levels released from P12 rat hippocampal slices exposed to (for durations, see STAR Methods) no drugs, the P2Y12 (and P2Y13 and P2Y1) receptor agonist 2-MeSADP (50 μM), ATP (1 mM), LPS (10 μg/ml), 2-MeSADP+LPS, ATP+LPS, and LPS or ATP+LPS in the presence of the caspase-1 blocker Ac-YVAD-cmk (50 μM) (numbers on bars are animals). (B) Lack of effect of voltage- and Ca2+-activated K+ channel blockers (4-aminopyridine, 4-AP, 1 mM; charybdotoxin, CTX, 1 μM) on the IL-1β release evoked as in (A). (C) Effect of two-pore domain K+ channel blockers (quinine, 200 μM; bupivacaine, 50 μM; tetrapentylammonium, TPA, 50 μM) on the IL-1β release evoked as in (A). Control, LPS, and LPS+ATP data from (A) are included in (B) and (C) for comparison. (D) ELISA-measured IL-1β levels released from hippocampal slices from P20-32 WT and THIK-1 KO mice in control conditions, or treated with LPS (50 μg/ml), ATP (1 mM), or ATP+LPS as in (A). Data are normalized to control data in rats (10.9 ± 3.1 pg/ml/cm2 of slice, n = 23 animals, with 2 slices averaged per animal) or WT mice (1.30 ± 0.78 pg/ml/cm2 of slice, n = 4 animals, with 2 slices averaged per animal). Data are represented as mean ± SEM. See also Figure S5.
Figure 8
Figure 8
THIK-1 Regulates Microglial Ramification, Surveillance, and Interleukin-1β Release Schematic showing how THIK-1 and P2Y12 are central to the functions of microglia. In healthy conditions (green dashed box), tonic activity of THIK-1 maintains a negative resting membrane potential (Vm) which is essential for normal microglial ramification and surveillance of the brain (Figure 1, Figure 2, Figure 3, Figure 4, Figure 5, Figure 6). When tissue damage occurs (orange box), ATP is released and converted to ADP by the ecto-ATPase CD39 (which we have not studied in this paper but which is believed to be an essential part of the mechanism by which ATP release leads to activation of P2Y12). This activates P2Y12, which we have shown potentiates the activity of THIK-1 (Figures 1 and 2), hyperpolarizing the membrane further. P2Y12 activation evokes process outgrowth to seal off the damaged area, but this does not require THIK-1 activation (Figures 3B and 3K), and so presumably reflects the other known actions of P2Y12, i.e., lowering [cAMP]i and raising [Ca2+]i (black box). Inflammasome assembly (red box) is triggered by the combination of activation of Toll-like receptor 4 (TLR4) by, for example, LPS—a priming stimulus—and activation of P2Y12 (and possibly P2Y13) by ATP or ADP. Loss of K+ from the cell and a fall of [K+]i is needed for inflammasome assembly (Muñoz-Planillo et al., 2013), and this is mediated by THIK-1, since block or KO of this channel prevents the release of the inflammatory cytokine interleukin-1β (Figure 7).

Comment in

References

    1. Bernardino L., Balosso S., Ravizza T., Marchi N., Ku G., Randle J.C., Malva J.O., Vezzani A. Inflammatory events in hippocampal slice cultures prime neuronal susceptibility to excitotoxic injury: a crucial role of P2X7 receptor-mediated IL-1beta release. J. Neurochem. 2008;106:271–280. - PubMed
    1. Bialas A.R., Presumey J., Das A., van der Poel C.E., Lapchak P.H., Mesin L., Victora G., Tsokos G.C., Mawrin C., Herbst R., Carroll M.C. Microglia-dependent synapse loss in type I interferon-mediated lupus. Nature. 2017;546:539–543. - PubMed
    1. Bischofberger J., Engel D., Li L., Geiger J.R.P., Jonas P. Patch-clamp recording from mossy fiber terminals in hippocampal slices. Nat. Protoc. 2006;1:2075–2081. - PubMed
    1. Bohlen C.J., Bennett F.C., Tucker A.F., Collins H.Y., Mulinyawe S.B., Barres B.A. Diverse requirements for microglial survival, specification, and function revealed by defined-medium cultures. Neuron. 2017;94:759–773.e8. - PMC - PubMed
    1. Boucsein C., Zacharias R., Färber K., Pavlovic S., Hanisch U.K., Kettenmann H. Purinergic receptors on microglial cells: functional expression in acute brain slices and modulation of microglial activation in vitro. Eur. J. Neurosci. 2003;17:2267–2276. - PubMed

Publication types

MeSH terms