. 2018 Jan 10;23(1):77-88.e5.
doi: 10.1016/j.chom.2017.11.007. Epub 2017 Dec 28.

Bacteria Facilitate Enteric Virus Co-infection of Mammalian Cells and Promote Genetic Recombination

Affiliations

Bacteria Facilitate Enteric Virus Co-infection of Mammalian Cells and Promote Genetic Recombination

Andrea K Erickson et al. Cell Host Microbe. .

Abstract

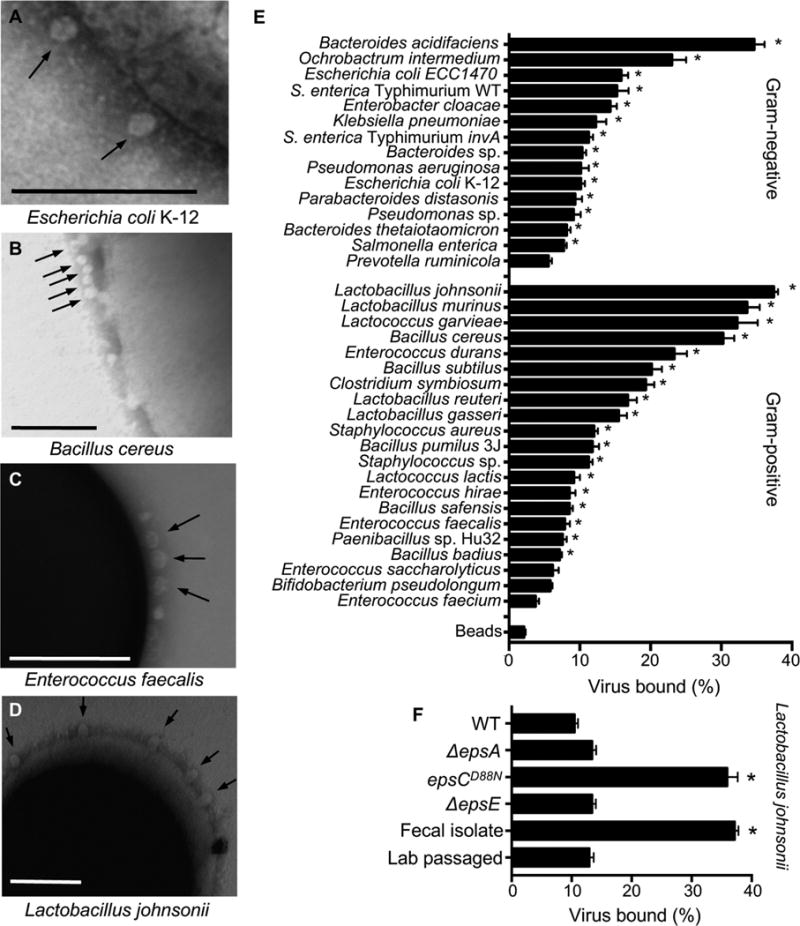
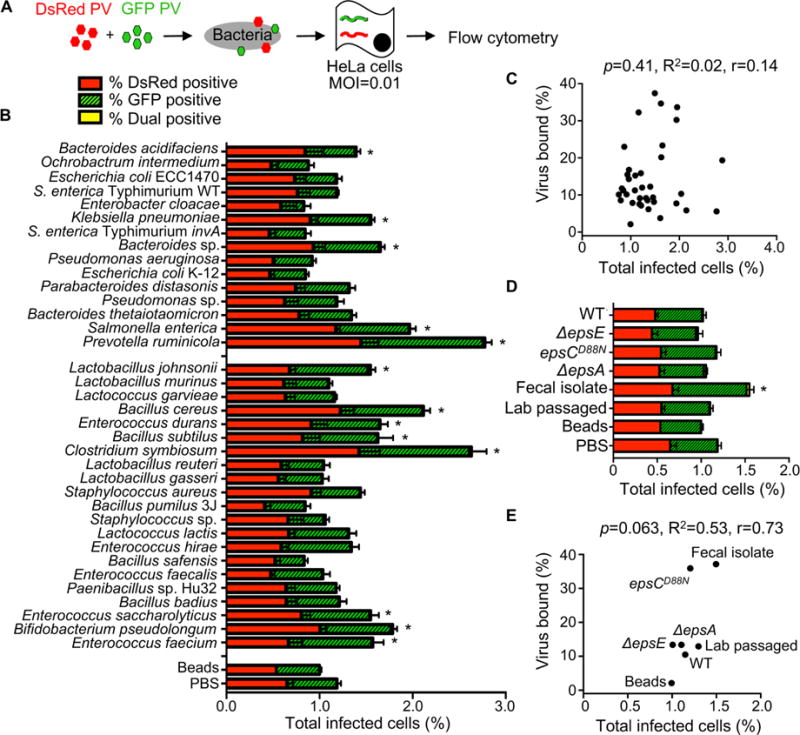
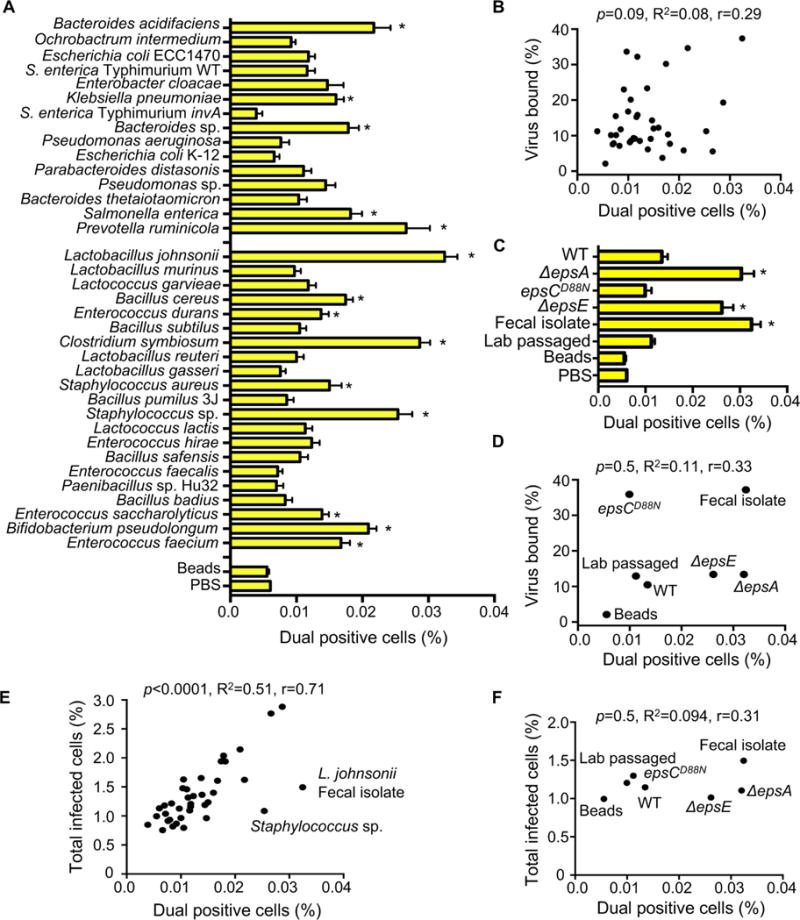
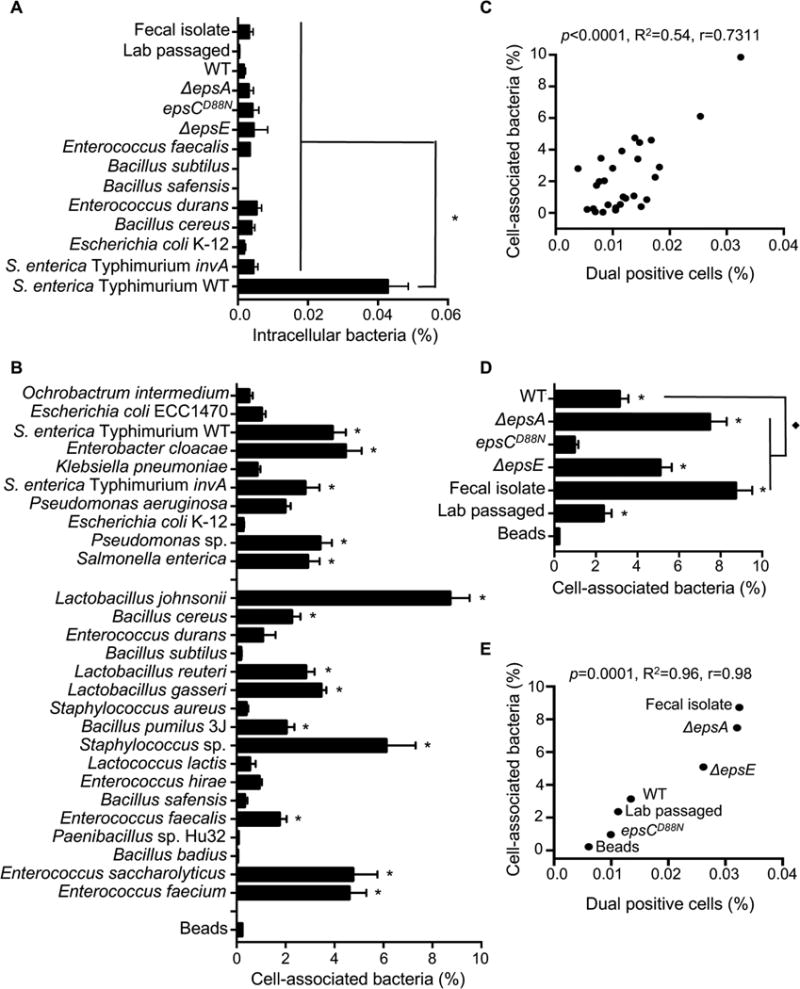
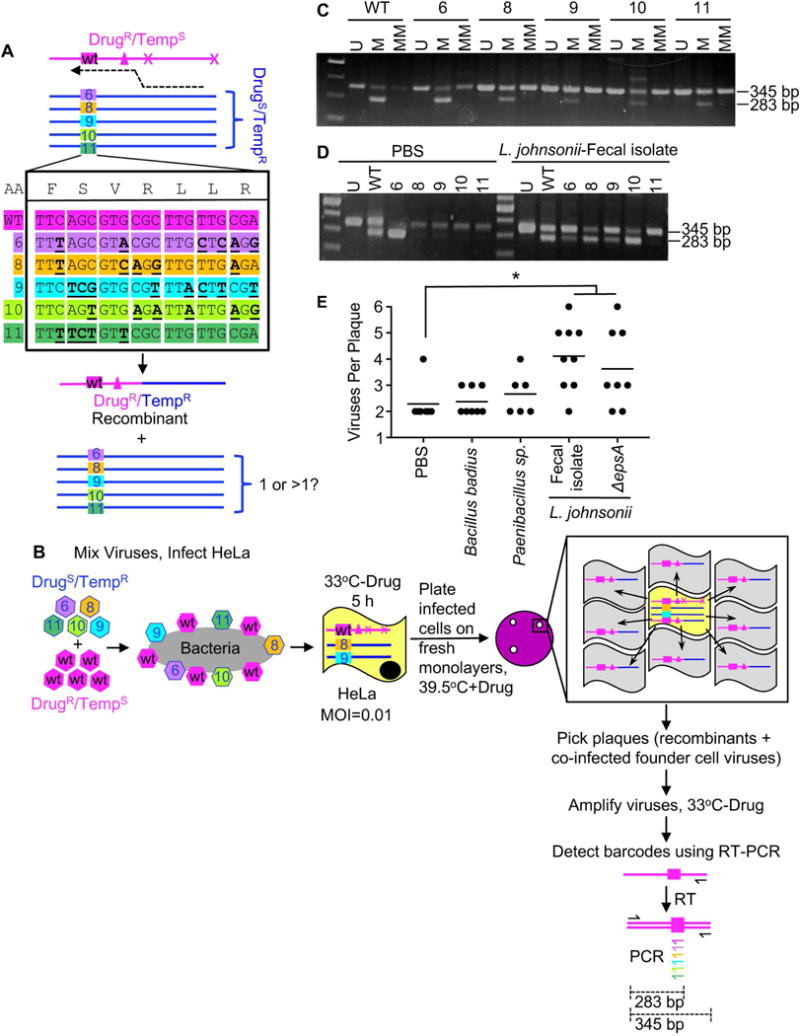
RNA viruses exist in genetically diverse populations due to high levels of mutations, many of which reduce viral fitness. Interestingly, intestinal bacteria can promote infection of several mammalian enteric RNA viruses, but the mechanisms and consequences are unclear. We screened a panel of 41 bacterial strains as a platform to determine how different bacteria impact infection of poliovirus, a model enteric virus. Most bacterial strains, including those extracted from cecal contents of mice, bound poliovirus, with each bacterium binding multiple virions. Certain bacterial strains increased viral co-infection of mammalian cells even at a low virus-to-host cell ratio. Bacteria-mediated viral co-infection correlated with bacterial adherence to cells. Importantly, bacterial strains that induced viral co-infection facilitated genetic recombination between two different viruses, thereby removing deleterious mutations and restoring viral fitness. Thus, bacteria-virus interactions may increase viral fitness through viral recombination at initial sites of infection, potentially limiting abortive infections.

Keywords: bacteria; co-infection; enteric virus; evolution; fitness; microbiota; poliovirus; recombination.


Figures

Figure 1
Figure 1. Poliovirus Binding to Bacteria
Bacteria were isolated from mouse cecal contents (n=22) or were acquired from collaborators or the ATCC (n=14)(Fig. S1A). (A–D) Electron micrographs of poliovirus bound to the surface of bacteria: 1×10⁶ CFUs of Escherichia coli K-12 (A), Bacillus cereus (B), Enterococcus faecalis (C), and Lactobacillus johnsonii- Fecal isolate (D) were incubated with 1×10⁷ PFU of purified poliovirus for 1 h prior to fixation, staining, and imaging. Arrows show poliovirus on the bacterial surface. Scale bars represent 200 nm. (E) Pull down assay. 1×10⁶ PFU/5,000 CPM of 35S-labeled poliovirus was incubated with 1×10⁹ CFU of bacteria or inert beads for 1 h prior to centrifugation, washing, and scintillation counting of bacteria-associated 35S. Data are represented as mean ± SEM of the percent of input virus bound to the bacterial pellet. *p<0.05 versus Beads (one-way ANOVA followed by Dunnet’s multiple comparison test). (F) Quantification of poliovirus binding by L. johnsonii strains. Several L. johnsonii strains were used in this work, including: Fecal isolate (isolated from mouse cecal contents), Lab passaged (a version of the Fecal isolate that was serially passaged; a lab-adapted strain), WT (FI9785, isolated from poultry)(Horn et al., 2013), ΔepsA (FI10938, WT strain lacking epsA, produces no EPS)(Dertli et al., 2016), epsCD88N (FI10386, WT strain with a mutation in the putative chain length and polymerization protein EpsC, overproduces EPS and alters phenotype)(Horn et al., 2013), ΔepsE (FI10844, WT strain lacking epsE, produces altered/reduced EPS)(Horn et al., 2013). Data are represented as mean ± SEM (n≥14, ≥3 independent experiments). *p<0.05 versus WT (one-way ANOVA followed by Dunnet’s multiple comparison test). See also Figure S1.
Figure 2
Figure 2. The Impact of Bacteria on Viral Infectivity
(A) Schematic of flow cytometry infectivity assay that applies to Figures 2 and 3. 1×10⁴ DsRed- and/or GFP-expressing polioviruses were incubated with or without 1×10⁸ CFU bacteria for 1 h at 37°C prior to infection of 1×10⁶ HeLa cells (MOI of 0.01), bacteria and remaining virus were removed from cells by washing, infection proceeded for a single cycle (16 h), and DsRed and GFP positive cells were quantified by flow cytometry. Each experiment counted ≥5×10⁵ events. (B) Total percentage of infected cells. Bars indicate the total percent of infected cells, which includes DsRed+ cells, GFP+ cells, or dual-positive cells. Bars are shaded to show the percentages of DsRed, GFP, and DsRed and GFP (dual) positive cells. Note that dual positive cells were a small fraction of the total; thus, the yellow shaded portions are small. Data are represented as mean± SEM (n=8–26). *p<0.05 versus PBS (one-way ANOVA followed by Dunnet’s multiple comparison test). (C) Scatter plot for correlation of total percent of infected cells and the percentage of virus bound. Data points are the mean values presented in Figures 2B and 1E. p=0.41, R2=0.02, r=0.14 (Pearson’s correlation coefficient). (D) The total percent of infected cells after viral incubation with or without L. johnsonii strains. Data are represented as mean ± SEM, n≥8. *p<0.05 versus PBS (one-way ANOVA followed by Dunnet’s multiple comparison test). (E) Scatter plot to test for correlation of total percent of infected cells and the percentage of virus bound for each L. johnsonii strain. Data points are the mean values presented in Figures 2D and 1F. p=0.06, R2=0.53, r=0.73 (Pearson’s correlation coefficient). See also Figure S2.
Figure 3
Figure 3. The Impact of Bacteria on Viral Co-infection
(A) Percentage of dual infected cells positive for both DsRed and GFP determined using the flow cytometry assay described in Figure 2. Data are represented as mean ± SEM (n=8–52, ≥3 independent experiments). *p<0.05 versus Beads (one-way ANOVA followed by Dunnet’s multiple comparison test). (B) Scatter plot to test for correlation between the percentage of dual infected cells and the percentage of virus bound for each bacterial strain. Data points are the mean values presented in Figures 3A and 1E. p=0.1, R2=0.08, r=0.3 (Pearson’s correlation coefficient calculation). (C) Percentage of dual infected cells for L. johnsonii strains. Data are represented as mean ± SEM (n≥6). *p<0.05 versus Beads (one-way ANOVA followed by Dunnet’s multiple comparison test). (D) Scatter plot to test for correlation between the percentage of dual infected cells and the percentage of virus bound for each L. johnsonii strain. Data points are the mean values presented in Figures 3C and 1F. p=0.5, R2=0.1, r=0.3 (Pearson’s correlation coefficient calculation). (E) Scatter plot to test for correlation between the percentage of dual infected cells and the total percent of infected cells. Data points are the mean values presented in Figures 3A and 2B. p<0.0001, R2=0.5, r=0.71 (Pearson’s correlation coefficient calculation). (F) Scatter plot to test for correlation between the percentage of dual infected cells and the total percent of infected cells for each L. johnsonii strain. Data points are the mean values presented in Figures 3C and 2D. p=0.5, R2=0.1, r=0.31 (Pearson’s correlation coefficient calculation). See also Figure S3.
Figure 4
Figure 4. Bacterial Adherence to HeLa Cells and Impact on Viral Co-infection
(A) Bacterial invasion assay. 1×10⁵ HeLa cells were incubated with 1×10⁶ CFU bacteria for 1 h, washed, and treated with or without gentamicin to kill extracellular bacteria. HeLa cells were lysed and the number of intracellular bacteria determined from CFU counts, and data are reported as percentage of input CFU. Data are represented as mean ± SEM (n≥3). *p<0.0001 versus S. enterica serovar Typhimurium WT (one-way ANOVA followed by Dunnet’s multiple comparison test). (B) Bacterial attachment to HeLa cells. 1×10⁵ HeLa cells were incubated with 1×10⁶ CFU bacteria for 1 h, washed, and the number of cell-associated bacteria was enumerated by CFU counts in HeLa lysates. The percent of cell-associated bacteria is shown as the percentage of total input CFU. The percent of cell-association for inert beads was determined from OD600 values of lysed Hela cells before (input) and after (attached) washing of the cell monolayers and are represented as percentage of input. Data are represented as mean ± SEM (n≥6). *p<0.05 versus beads (one-way ANOVA). (C) Scatter plot to test for correlation between the percentage of dual infected cells and the percentage of cell-associated bacteria. Data points are the mean values presented in Figures 3A and 4B. p<0.0001, R2=0.54, r=0.73 (Pearson’s correlation coefficient calculation). (D) Percentages of cell-associated bacteria for L. johnsonii strains. Data are represented as mean ± SEM (n≥6). *p<0.05 versus Beads or ◆p<0.05 versus WT (one-way ANOVA followed by Dunnet’s multiple comparison test). (E) Scatter plot to test for correlation between the percentage of dual infected cells and the percentage of cell-associated bacteria for L. johnsonii strains. Data points are the mean values presented in Figures 3C and 4D. p=0.0001, R2=0.96, r=0.98 (Pearson’s correlation coefficient calculation). See also Figure S4.
Figure 5
Figure 5. Effect of Bacterial Strains on Poliovirus Recombination Frequency
(A) Diagram of recombination between DrugR/TempS and DrugS/TempR parental polioviruses. Triangle denotes mutation conferring guanidine (Drug) resistance and x denotes site of temperature sensitive mutations inhibiting replication at 39.5°C (Kirkegaard and Baltimore, 1986). The dotted line indicates the location of recombination events that create progeny that are able to grow at 39.5°C in the presence of 1 mM guanidine (DrugR/TempR). (B) Schematic of recombination assay. 1×10⁵ PFU of each parental virus was mixed and incubated with 1×10⁸ CFU bacteria prior to infection of 1×10⁷ HeLa cells (MOI of 0.01). Infection proceeded for 8 h under permissive conditions for both viruses (33°C without drug) and progeny viruses were quantified by plaque assay at both permissive and restrictive conditions to determine yields of individual parental viruses and recombinants. (C) Recombination frequencies after exposure to bacterial strains. Recombination frequencies are shown as the viral titers (PFU/mL) at 39.5°C+Drug divided by viral titers at 33°C−drug. HeLa cells were also infected in parallel with each parental virus alone as controls to calculate the frequency of reversion and de novo mutation acquisition. Data are represented as the mean ± SEM (n=4–12), from at least 2 independent experiments. *p<0.01 versus the mix of parental viruses in PBS (Student’s unpaired t test). (D) Scatter plot to test for correlation between the percentage of dual infected cells and the recombination frequency. Data points are the mean values presented in Figures 5C, 3A and 3C. p<0.0001, R2=0.93, r=0.97 (Pearson’s correlation coefficient calculation). See also Figure S5.
Figure 6
Figure 6. Examining the Number of Virions Delivered to Co-Infected Host Cells
(A) Using barcoded viruses to discriminate founding viruses in co-infected cells. Five viruses (6, 8, 9, 10, 11) with silent mutation “barcodes” were used as the DrugS/TempR parental virus in recombination crosses with the DrugR/TempS virus, which contained a WT barcode. Based on the constellation of barcodes and phenotypic markers, legitimate recombinants contain the WT barcode and the DrugR/TempR markers, and we assessed whether viruses with other barcodes were present. (B) Using barcoded viruses and recombinant virus plaques to assess the number of founding viruses in co-infected cells. 2×10⁴ PFU of each DrugS/TempR barcode virus (6, 8, 9, 10, 11) was mixed with 1×10⁵ PFU of the DrugR/TempS virus with the WT barcode and the virus mixtures were incubated with or without 1×10⁸ CFU bacteria prior to infection of 2×10⁷ HeLa cells (MOI of 0.01). Infection proceeded for 5 h under permissive conditions (33°C without drug). Prior to release of progeny viruses, infected cells were harvested and dilutions of the cells were plated on fresh monolayers, agar overlays were added, and plates were incubated at 39.5°C in the presence of 1 mM guanidine to select for products of recombination. Only recombinant viruses spread radially (gray cells) from the initially co-infected cell (yellow), but the plaques contain the founder viruses in the center cell. Plaques were picked and viruses were amplified in naïve cells for 18 h, followed by extraction of RNA and cDNA synthesis using a universal poliovirus antisense primer. PCR was performed with a universal poliovirus sense primer and barcode-specific (colored) or universal (black) antisense primers. (C) Amplification specificity for viral barcodes. PCR was performed with cDNA from each individual virus with the universal sense primer and three different antisense primers: 1) the universal antisense primer (“U”, positive control, 345 bp product), 2) the matched antisense primer (“M”, 283 bp product from specific amplification, 345 bp product from carry-over universal antisense primer used in cDNA synthesis), or 3) a mixture of the primers to detect the other barcodes (“MM” for mismatched, 283 bp product only if non-specific amplification, 345 bp product from carry-over universal antisense primer used in cDNA synthesis). (D) Representative gel showing multiple barcode virus PCR products from two individual plaques. (E) Number of barcoded viruses per recombinant virus plaque. All recombinant plaques had the DrugR/TempR recombinant (WT barcode) and at least one additional barcode virus (6, 8, 9, 10, 11). Data points are individual plaques (n=6–9) with mean number of viruses per plaque shown. *p<0.05 versus the mix of parental viruses in PBS (Student’s unpaired t test).

Comment in

References

    1. Aguilera ER, Erickson AK, Jesudhasan PR, Robinson CM, Pfeiffer JK. Plaques Formed by Mutagenized Viral Populations Have Elevated Coinfection Frequencies. MBio. 2017;8 - PMC - PubMed
    1. Almand EA, Moore MD, Outlaw J, Jaykus LA. Human norovirus binding to select bacteria representative of the human gut microbiota. PLoS One. 2017;12:e0173124. - PMC - PubMed
    1. Baldridge MT, Nice TJ, McCune BT, Yokoyama CC, Kambal A, Wheadon M, Diamond MS, Ivanova Y, Artyomov M, Virgin HW. Commensal microbes and interferon-lambda determine persistence of enteric murine norovirus infection. Science. 2015;347:266–269. - PMC - PubMed
    1. Chen YH, Du W, Hagemeijer MC, Takvorian PM, Pau C, Cali A, Brantner CA, Stempinski ES, Connelly PS, Ma HC, et al. Phosphatidylserine vesicles enable efficient en bloc transmission of enteroviruses. Cell. 2015;160:619–630. - PMC - PubMed
    1. Combe M, Garijo R, Geller R, Cuevas JM, Sanjuan R. Single-Cell Analysis of RNA Virus Infection Identifies Multiple Genetically Diverse Viral Genomes within Single Infectious Units. Cell Host Microbe. 2015;18:424–432. - PMC - PubMed