. 2018 Jan 22;44(2):165-178.e6.
doi: 10.1016/j.devcel.2017.12.004. Epub 2017 Dec 28.

Engineered Tissue Folding by Mechanical Compaction of the Mesenchyme

Affiliations

Engineered Tissue Folding by Mechanical Compaction of the Mesenchyme

Alex J Hughes et al. Dev Cell. .

Abstract

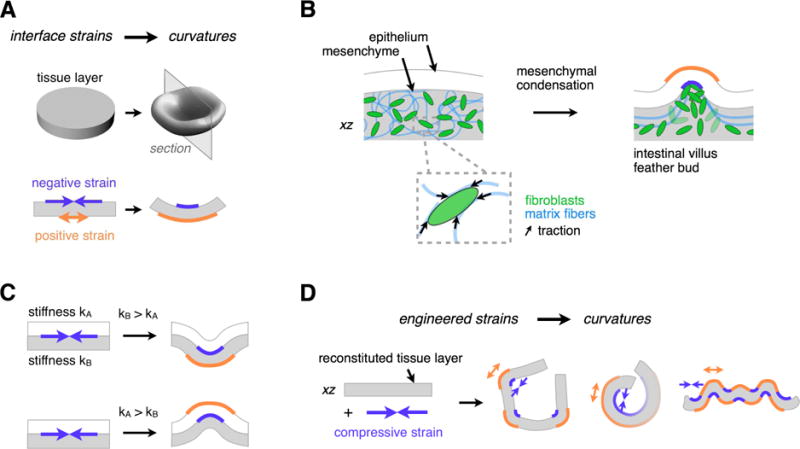
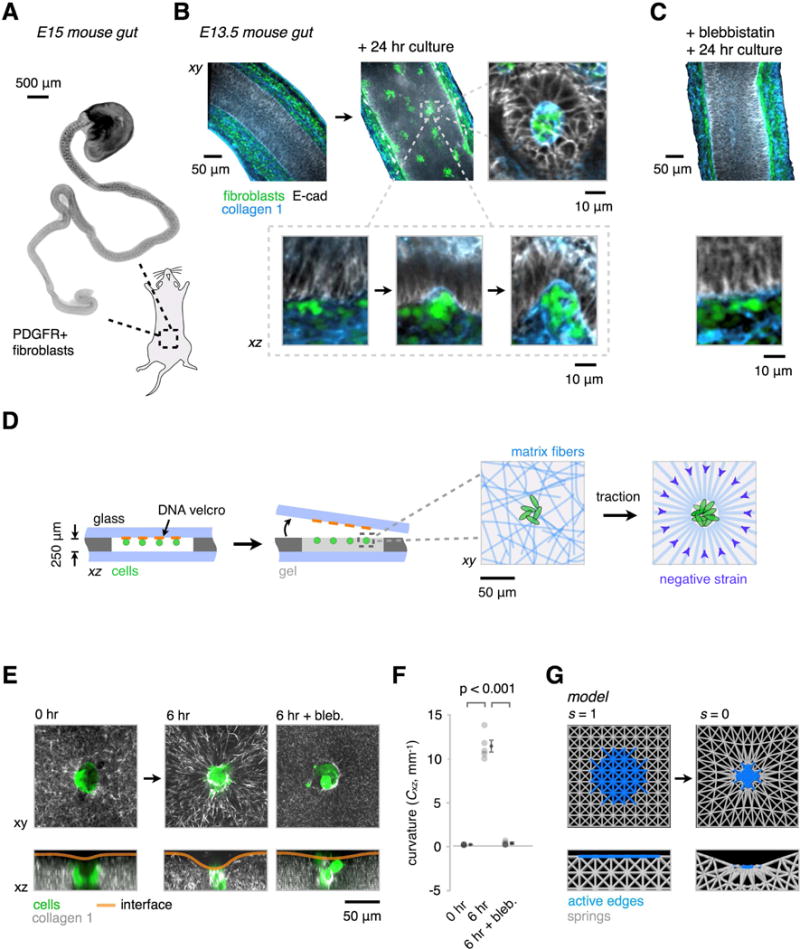
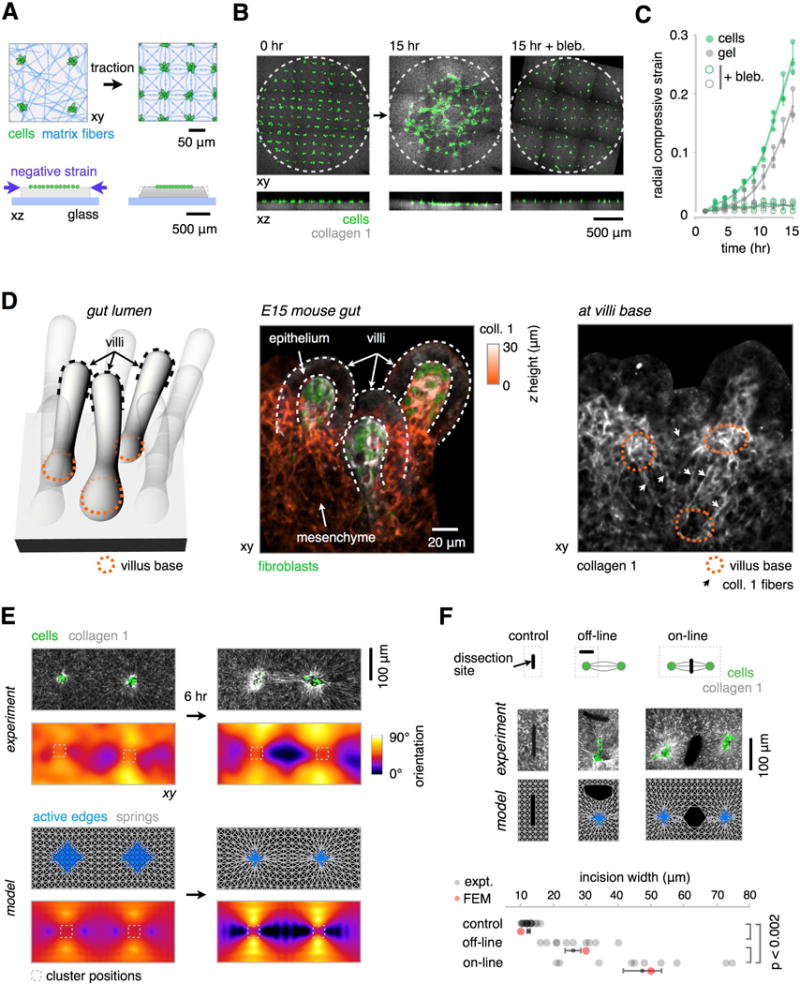
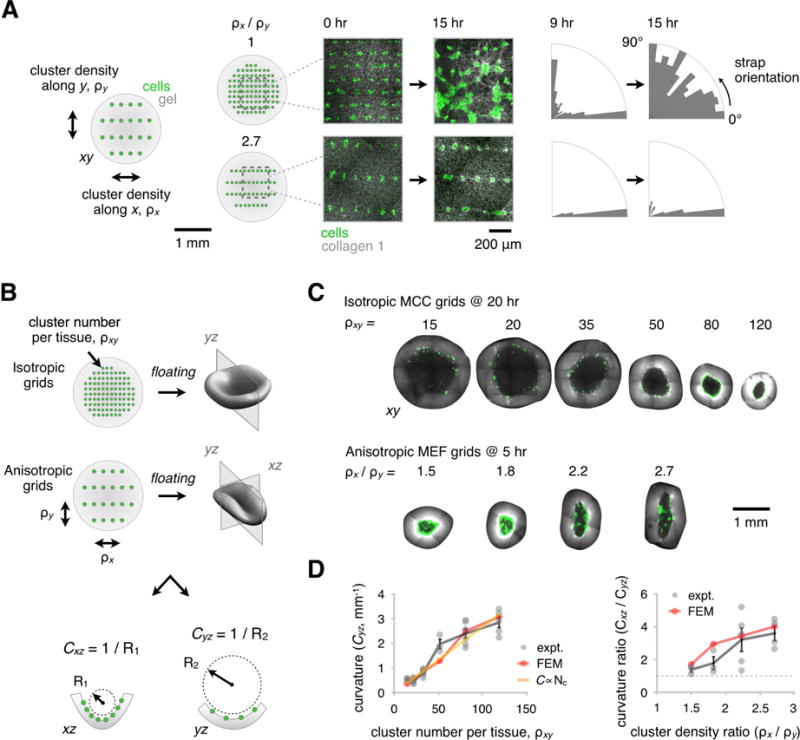
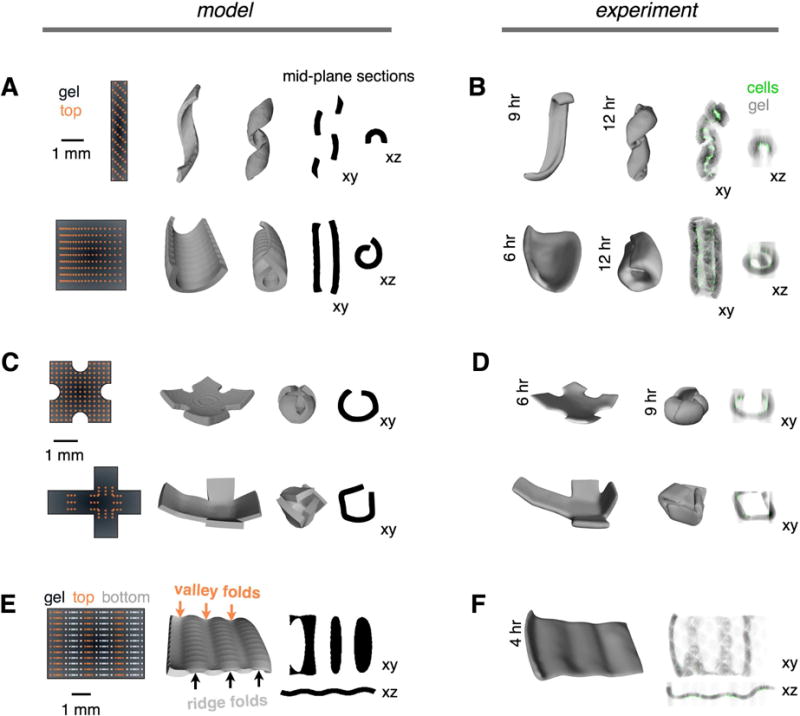
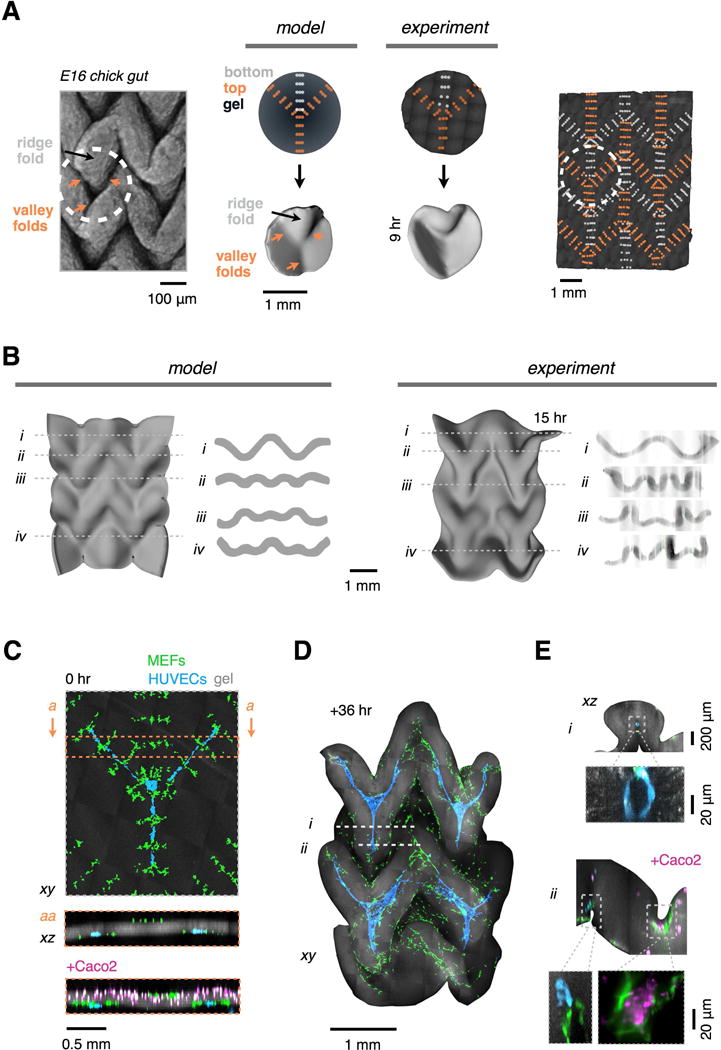
Many tissues fold into complex shapes during development. Controlling this process in vitro would represent an important advance for tissue engineering. We use embryonic tissue explants, finite element modeling, and 3D cell-patterning techniques to show that mechanical compaction of the extracellular matrix during mesenchymal condensation is sufficient to drive tissue folding along programmed trajectories. The process requires cell contractility, generates strains at tissue interfaces, and causes patterns of collagen alignment around and between condensates. Aligned collagen fibers support elevated tensions that promote the folding of interfaces along paths that can be predicted by modeling. We demonstrate the robustness and versatility of this strategy for sculpting tissue interfaces by directing the morphogenesis of a variety of folded tissue forms from patterns of mesenchymal condensates. These studies provide insight into the active mechanical properties of the embryonic mesenchyme and establish engineering strategies for more robustly directing tissue morphogenesis ex vivo.

Keywords: intestinal villi; mechanobiology; mesenchymal condensation; smart materials; soft matter; soft robotics; synthetic biology; tissue engineering; tissue folding.


Conflict of interest statement

DECLARATION OF INTERESTS

A.J.H. and Z.J.G. are inventors on intellectual property related to engineered tissue folding.

Figures

Figure 1
Figure 1. Tissue Folding Requires Patterns of Negative and Positive Strain at Tissue Interfaces
(A) Curvature at tissue interfaces is associated with a decrease in length (negative strain) at concave interfaces, and an increase in length (positive strain) at convex interfaces. (B) Strains at the epithelial-mesenchymal interface are associated with folding events in the intestinal villi and feather bud. Strained regions of tissue occur adjacent to mesenchymal condensates in these tissues. As mesenchymal cells generate traction forces on nearby ECM, they could participate in driving such folding events. (C) Negative strain at the interface between two tissue layers can drive invagination or evagination according to the relative bending stiffnesses of the adhered layers (see also Figure S1). (D) Patterns of mesenchymal condensates could be mapped to corresponding patterns of tissue strains, creating a programmable approach to engineered folding of reconstituted tissues.
Figure 2
Figure 2. Signatures of Mesenchymal Condensation in the Mouse Gut, and their Reconstitution In Vitro and In Silico
(A) Whole-mount wide-field fluorescence microscopy image of the embryonic day 15 (E15) mouse intestine showing PDGFR+ fibroblast clusters forming in an anterior to posterior wave. (B) Optical sections from whole-mount confocal immunofluorescence images showing PDGFR+ cells (green) and collagen I fibers (blue) in E13.5 explants cultured for 0 or 24 hr in vitro. Detail shows intermediate stages of PDGFR+ cluster formation against the basal surface of the epithelium (E-cadherin, gray), along the wave of condensation. Successive stages of cluster formation show progressive collagen I accumulation and localized curvature at the basal surface of the epithelium (see also Figure S2). (C) Intestine explant cultures as in (B) show reduced cell clustering, collagen I accumulation, and interface curvature in the presence of 30 μM blebbistatin (a myosin II inhibitor). See Figure S2A-C for further quantitation. (D) Schematic of reconstitution strategy using DNA-programmed assembly of cells (DPAC) to build loose clusters of mesenchymal cells near the surface of ECM gels containing collagen I and matrigel. Detail at right illustrates the hypothesized traction-mediated compaction and alignment of ECM fibers around cell clusters. (E) GFP-expressing MEF clusters (green) were patterned in AF555-labeled collagen I-containing gels (gray) as in (D). Live confocal microscopy of condensing clusters and collagen I reveals ECM compaction, radial collagen I fiber alignment, and the emergence of curvature of the gel-medium interface (see also Figure S3). These phenomena are blocked by treatment with 30 μM blebbistatin. (F) Quantification of the interfacial curvatures proximal to the condensates shown in (E) (mean ± SEM, n = 5, one-way ANOVA with Holm-Sidak’s multiple comparisons test). (G) Snapshots from a finite-element model containing passive elastic elements (gray) and active edges (blue) whose length s can be reduced to simulate local gel strains by cell clusters.
Figure 3
Figure 3. Mechanical Coupling Between Mesenchymal Condensates In Vivo and In Vitro
(A) Schematic for measuring cell migration and ECM compaction contributions to reconstituted tissue condensation. A grid of GFP-expressing MEF clusters (green) is patterned just below the surface of a gel containing collagen I (gray), and the motion of fluorescent collagen fibers and cells are tracked by time-lapse confocal microscopy. (B) Maximum intensity projections and xz sections from a representative time-lapse confocal microscopy experiment showing, left, untreated MEF cluster grid (green) and AF555-labeled collagen I (gray) converging towards a central focus over 15 h, middle, and in the presence of 30 μM blebbistatin (bleb.), right. The dotted lines mark the initial spatial extent of the grid. (C) Quantification of the data in (B), showing radial strain of the cell grid (green) and ECM (gray) in the presence and absence of 30 μM blebbistatin (mean ± SEM, n = 3). (D) (Left) Schematic illustrating the developing mouse intestine shown in the images to the right. Dark dotted lines indicate the location of three villi “caps”, and orange dotted lines indicate the position of three villi bases. (Center) Immunofluorescence image of the embryonic day 15 (E15) mouse intestine showing three representative villi as in the diagram to the left. Data is shown as a maximum intensity projection of labeled collagen I fibers within these villi, color coded according to their height in the confocal stack. PDGFR+ fibroblast clusters (green) are also shown. (Right) One section from the base of the stack illustrating regions of collagen I alignment (white arrows) around villi bases (orange dotted lines). (E) (Top) GFP-expressing MEF clusters (green) were patterned using DPAC at fixed distances within a gel containing collagen I (gray). Collagen alignment is evident after 6 hr; the pixel-wise angle of average orientation was used to generate the heat-maps below each microscopy image (see also Figure S4). (Bottom) Qualitatively similar patterns of elastic edge alignment (gray) were observed between contractile nodes (blue) in the finite-element model (FEM). (F) (Top) Schematic of an assay for retraction of the gel surface after laser ablation in three regions around pairs of interacting condensates. (Middle, Top) confocal micrographs of gel surface in three corresponding regions after cutting with a UV laser. (Middle, Bottom) Similar views from a 2D FEM with simulated cuts. (Bottom) Qualitatively similar retraction behavior in the FEM implies that collagen straps bear greater tension than the less aligned regions of the gel (mean ± SEM, n > 9 incisions per group, one-way ANOVA with Holm-Sidak’s multiple comparisons test).
Figure 4
Figure 4. Patterns of Condensates Mechanically Couple over Large Distances and Quantitatively Encode the Trajectory of Tissue Curvature
(A) (Left) Isotropic and anisotropic grids of GFP-expressing MEF clusters (green) were patterned using DPAC into gels containing AF555-labeled collagen I (gray), adhered to a glass substrate, and imaged using time-lapse confocal microscopy. The density of clusters along the horizontal and vertical axes are denoted ρx and ρy, respectively. The emergence of collagen straps (center) was observed over 9 to 15 hr (see also Figure S5). (Right) Radial bar charts illustrating the alignment of tension-bearing straps relative to the horizontal axis at 9 and 15 hr. Straps extend only between nearest neighbors in the vertical and horizontal directions, until later timepoints when the clusters begin to merge. (B) Schematic depicting how curvature is measured in the xz and yz planes of floating gels containing either isotropic cell cluster grids (with total cluster density ρxy) or anisotropic grids. (C) Representative confocal microscopy sections through the mid-plane of invaginating reconstituted tissues patterned with different total cluster densities and combinations of densities in the horizontal and vertical directions. Graded patterns of curvature emerge for the indicated density and anisotropy of cell clusters. (D) Curvature measurements for the experimental data shown in (C). (Left) Curvature as a function of total cluster density and (right) curvature anisotropy as a function of anisotropy in cluster density along x and y. These data constitute quantitative calibration relationships (mean ± SEM, n > 2 per grid geometry) that parameterize a finite element model (FEM) relating “blueprint” patterns of contractile nodes to folding trajectories of reconstituted tissues.
Figure 5
Figure 5. Networks of Mechanically Active Mesenchymal Condensates Program the Autonomous Folding of Diverse 3D Tissue Architectures
(A) (Left) DPAC blueprints of MEF cluster positions in x and y for a coiled object (top) and rolled tube object (bottom). (Center) Snapshots from the FEM showing intermediates along the predicted folding trajectories. (Right) Mid-plane sections from the FEM snapshots (see also Figure S6). (B) Shell surfaces and mid-plane sections of reconstituted tissues corresponding to the model objects in (A) at two imaging timepoints. Shell surfaces were reconstructed from confocal micrographs (MEFs, green; AF555-collagen I, gray). (C),(D) Spherical and cubic FEM objects and corresponding reconstituted tissues, imaged and analyzed as in (A) and (B). (E) (Left) DPAC blueprint encoding an opposing curvature motif incorporates MEF clusters on both the top (orange) and bottom (white) surfaces of the gel. (Center) FEM showing predicted opposing ridge and valley folds, and (right) mid-plane sections. (F) Shell surface and mid-plane sections of a reconstituted tissue corresponding to the model in (E).
Figure 6
Figure 6. Mesenchymal Condensates Drive the Autonomous Folding of Tessellated Tissue Patterns Incorporating Multiple Cell Types
(A) (Left) Macro-confocal micrograph of Ethidium Bromide-stained embryonic day 16 (E16) chick gut lumen exhibiting a tessellated four-fold vertex pattern that incorporates three valley folds and one ridge fold converging on a single point (see also Figure S7). (Middle) FEM and as-printed DPAC blueprints, FEM snapshot, and shell surface of a reconstituted four-fold vertex tissue (AF555-labeled collagen I in gel, dark gray). (Right) As-printed DPAC blueprint encoding a tesselated architecture similar to the chick gut lumen and Miura origami fold. (B) (Left) FEM snapshot and cross-sections of the Miura object. (Right) Shell surface and cross-sections of the corresponding reconstituted tissue after 15 hr in vitro. (C) Confocal micrographs and sections showing the DPAC output for a Miura folding pattern as in (B), but incorporating human umbilical vein endothelial cells (HUVECs) patterned as 3-pronged cords at programmed folds and/or Caco2 cells distributed uniformly at the top surface of the gel. (D) Maximum intensity confocal projection of the folded architecture of HUVEC-containing gel after 36 hr in culture. (E) (Top, i) Representative confocal cross-sections of the object in (D) showing lumenized HUVEC cords enveloped by Miura folds and (bottom, ii) Caco2 cells in a different HUVEC-containing Miura tissue deposited as in (C, bottom). Caco2 cell clusters form atop contractile fibroblasts within concave folds.

Comment in

References

    1. Armon S, Efrati E, Kupferman R, Sharon E. Geometry and Mechanics in the Opening of Chiral Seed Pods. Science. 2011;333:1726–1730. - PubMed
    1. Bajaj P, Schweller RM, Khademhosseini A, West JL, Bashir R. 3D Biofabrication Strategies for Tissue Engineering and Regenerative Medicine. Annu Rev Biomed Eng. 2014;16:247–276. - PMC - PubMed
    1. Baker BM, Trappmann B, Wang WY, Sakar MS, Kim IL, Shenoy VB, Burdick JA, Chen CS. Cell-mediated fibre recruitment drives extracellular matrix mechanosensing in engineered fibrillar microenvironments. Nat Mater. 2015;14:1262–1268. - PMC - PubMed
    1. Bender J, Müller M, Otaduy MA, Teschner M, Macklin M. A Survey on Position-Based Simulation Methods in Computer Graphics. Computer Graphics Forum. 2014;33:228–251.
    1. Bhattacharjee T, Zehnder SM, Rowe KG, Jain S, Nixon RM, Sawyer WG, Angelini TE. Writing in the granular gel medium. Science Advances. 2015;1:e1500655–e1500655. - PMC - PubMed

Publication types