. 2018 Jan 22;44(2):217-232.e11.
doi: 10.1016/j.devcel.2017.11.024. Epub 2017 Dec 28.

CCPG1 Is a Non-canonical Autophagy Cargo Receptor Essential for ER-Phagy and Pancreatic ER Proteostasis

Affiliations

CCPG1 Is a Non-canonical Autophagy Cargo Receptor Essential for ER-Phagy and Pancreatic ER Proteostasis

Matthew D Smith et al. Dev Cell. .

Abstract

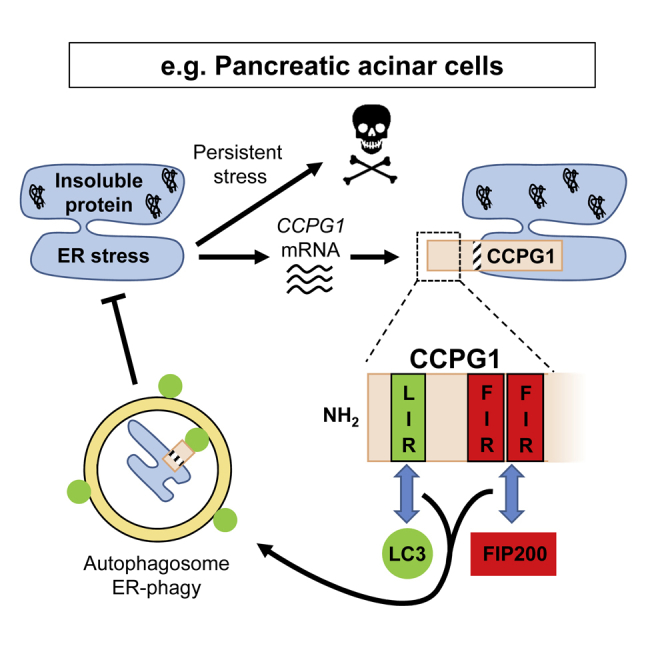
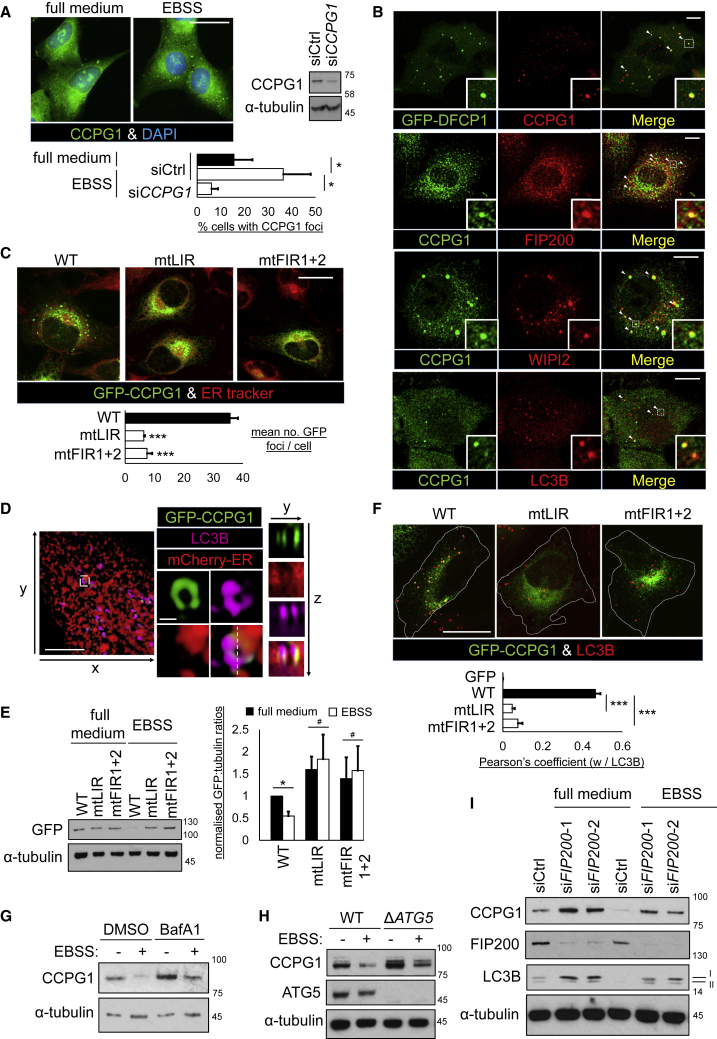
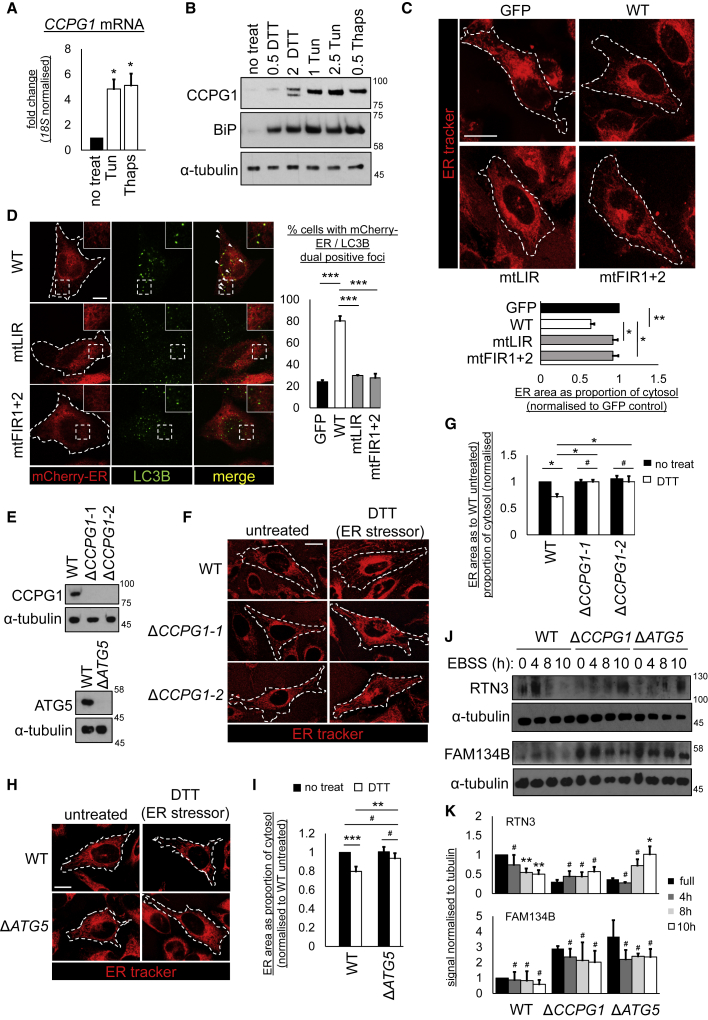
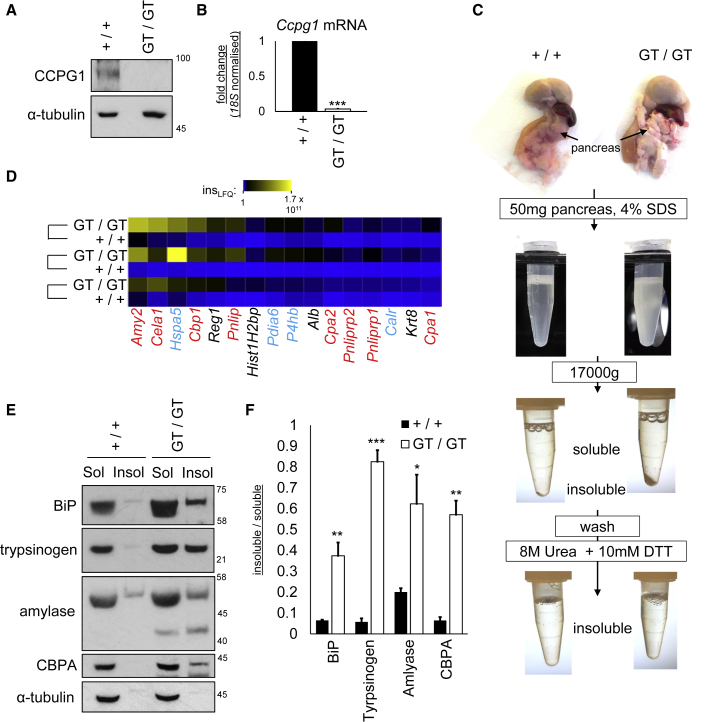
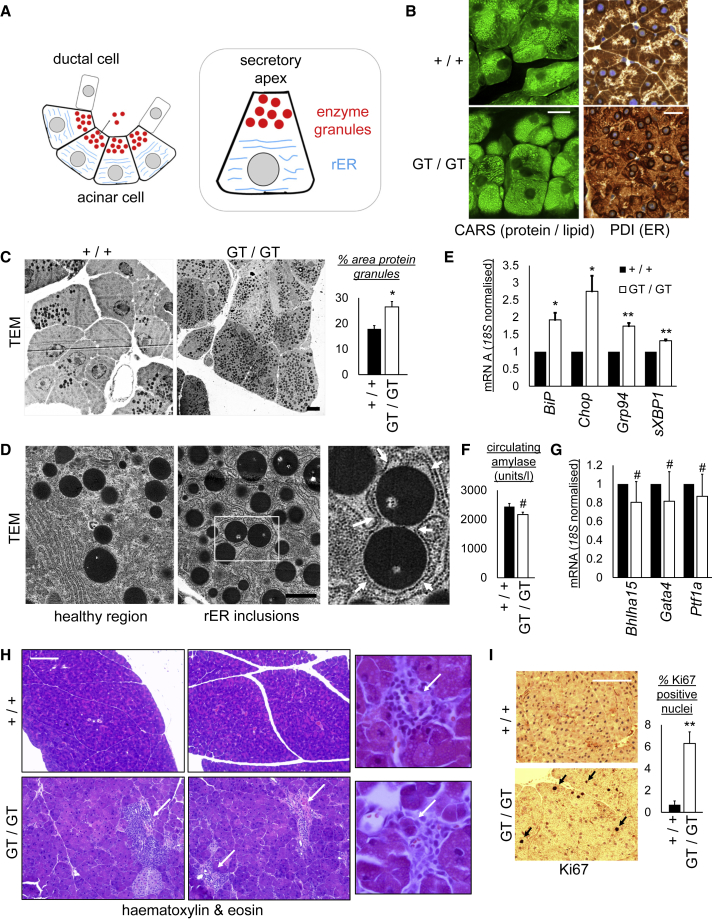
Mechanisms of selective autophagy of the ER, known as ER-phagy, require molecular delineation, particularly in vivo. It is unclear how these events control ER proteostasis and cellular health. Here, we identify cell-cycle progression gene 1 (CCPG1), an ER-resident protein with no known physiological role, as a non-canonical cargo receptor that directly binds to core autophagy proteins via an LIR motif to mammalian ATG8 proteins and, independently and via a discrete motif, to FIP200. These interactions facilitate ER-phagy. The CCPG1 gene is inducible by the unfolded protein response and thus directly links ER stress to ER-phagy. In vivo, CCPG1 protects against ER luminal protein aggregation and consequent unfolded protein response hyperactivation and tissue injury of the exocrine pancreas. Thus, via identification of this autophagy protein, we describe an unexpected molecular mechanism of ER-phagy and provide evidence that this may be physiologically relevant in ER luminal proteostasis.

Keywords: Atg8; CCPG1; ER-phagy; FIP200; autophagy; pancreas; proteostasis; tissue homeostasis; unfolded protein response.


Figures

None
Graphical abstract
Figure 1
Figure 1
CCPG1 Is an LIR Motif-Containing Interactor of Human ATG8 Orthologs (A) Schematic of CCPG1 structure (NTD, N-terminal amino acids 1–230; TM, transmembrane anchor). (B) GST or GST fusions of ATG8 orthologs (LC3B, LC3C, and GABARAP) were used in affinity precipitation (AP) of transfected myc-CCPG1 from HEK293 cells. (C) GST or GST-GABARAP (mtLDS, LIR-docking site mutant) were used in AP of transfected myc-CCPG1 NTD from HEK293 cells. (D) Bacterially expressed GST or GST-CCPG1 NTD proteins were pre-purified on glutathione Sepharose beads and incubated with purified His-GABARAP before GST AP. (E) Human CCPG1 amino acids 6–21 aligned to tryptophan-containing LIR motifs from other human proteins. Important hydrophobic residues at LIR positions 0 and 3 are highlighted in red. (F) Alignment of the N terminus of human CCPG1 to other vertebrate CCPG1 proteins (human numbering). (G) HEK293 cells were transfected with the indicated GFP fusions of CCPG1, and AP of these fusions with GST-LC3B or GST-GABARAP was tested.
Figure 2
Figure 2
CCPG1 Is a FIP200-Interacting Protein (A) A549 NTAP (FLAG-HA)-CCPG1 cells were immunoprecipitated for tagged CCPG1 using anti-HA antibody and immunoprecipitates subjected to LC-MS/MS and CompPASS analysis (see the STAR Methods and Table S1). Interacting proteins at a cut-off of WDN score 0.8 are shown here. (B) A549 cells stably expressing NTAP empty vector (−) or NTAP-CCPG1 (+) were immunoprecipitated for tagged CCPG1 with anti-FLAG beads and immunoblotted for indicated proteins. (C) A549 cells were EBSS starved or left untreated for 1 hr, prior to lysis and endogenous immunoprecipitation of CCPG1 and subsequent immunoblotting (IgG, negative control IgG). (D) HEK293 cells were transfected with FLAG-FIP200 and indicated variants of full-length (FL) GFP-CCPG1 (ΔNTD, amino acids 231–757). Immunoprecipitation was performed with GFP-Trap and immunoblotting performed with indicated antibodies. (E) Recombinant FIP200 was incubated with either glutathione Sepharose beads alone, or with pre-purified GST or GST-CCPG1 NTD bound beads. Affinity precipitation (AP) followed by immunoblotting was then performed to assess direct interaction. See also Figure S1 and Table S1.
Figure 3
Figure 3
Identification of a Linear Peptide Motif in CCPG1 for Binding to FIP200 C-Terminal Region (A) A 15-mer peptide array (peptides 1–55) was probed with recombinant FIP200. Bound FIP200 was detected by indirect immunodetection. Peptide sequences corresponding to binding regions A–C are shown below the array. (B and C) HEK293 cells were transfected with FLAG-FIP200 and indicated myc-tagged deletions or truncations of CCPG1 NTD prior to anti-myc immunoprecipitation and immunoblotting (EV, empty vector). (D) Sequence alignment of the region from amino acids 97 to 118 of human CCPG1 against vertebrate orthologs (upper) or of regions amino acids 99–113 and 17–31 of human CCPG1 (lower). Conserved S/T and acidic residues are blue, hydrophobic residues are red. Asterisks indicate evolutionary conservation of residues. Black boxes indicate residues identical between FIR1 and FIR2. (E) HeLa ΔCCPG1-1 cells (Figure 5E) were transfected with FLAG-FIP200 and indicated variants of full-length myc-tagged CCPG1 (mtFIR1, S22A D23A I24A E25A; mtFIR2, S104A D105A I106A L109A), and immunoprecipitated on myc. (F) HEK293 cells were transfected with FLAG-FIP200 (1,279–1,594) and indicated variants of full-length myc-tagged CCPG1, and immunoprecipitated on myc. See also Figures S1 and S2.
Figure 4
Figure 4
CCPG1 Is Recruited into Autophagosomes from the ER (A) A549 cells were transfected with siCtrl or siCCPG1 and, at 24 hr post-transfection, either left untreated or starved for 1 hr in EBSS, then stained for endogenous CCPG1. Cells with CCPG1 foci were scored (n = 3, ± SEM, p < 0.05, two-tailed paired sample t tests). Scale bar, 20 μm. (B) A549 or A549 GFP-DFCP1 cells were starved for 1 hr in EBSS and co-stained for endogenous CCPG1 and, for A549 cells, the indicated marker, then imaged by confocal microscopy. Arrowheads indicate co-localizing foci. Scale bars, 10 μm. (C) HeLa GFP-CCPG1 cells (wild-type [WT]) or indicated ATG8 (mtLIR) or FIP200 (mtFIR1+2) binding-deficient variants were starved, stained with ER tracker, and imaged by confocal microscopy. Automated quantification of GFP foci per cell was performed as described in the STAR Methods (n = 3, ± SEM, ∗∗∗p < 0.001, one-way ANOVA with Tukey's post-hoc test). Scale bar, 20 μm. (D) HeLa GFP-CCPG1 mCherry-ER cells were starved, stained for LC3B, and then imaged by 3D-SIM. Top left panel shows a reconstructed region of cell observed from above. The rightmost panels are zoomed images of the white boxed region. Lower panels show a cross-section along the white dashed line. Scale bars, 5 μm and 0.5 μm (zoomed). (E) HeLa GFP or GFP-CCPG1 cells, WT or indicated mutants, introduced in (D), were starved for 3 hr and blotted for GFP (left). Blots were quantified by densitometry for GFP:tubulin ratios (right) (n = 3, ± SEM, p < 0.05, #not significant, two-tailed t test). (F) HeLa GFP or GFP-CCPG1 cells (WT or indicated mutants) were starved for 1 hr, co-stained for LC3B, and imaged by confocal microscopy. Pearson's coefficient for colocalization of GFP foci with LC3B was derived as described in the STAR Methods. White dashed lines indicate the outline of GFP-positive cells (n = 3, ± SEM, ∗∗∗p < 0.001, one-way ANOVA with Tukey's post-hoc test). Scale bar, 20 μm. (G) A549 cells were left untreated or starved for 4 hr in EBSS with or without 0.1 μM bafilomycin A1 (BafA1) and immunoblotted. (H) WT or ΔATG5 A549 clones were left untreated or starved for 4 hr in EBSS and immunoblotted. (I) A549 cells were transfected with siRNA for 48 hr and then starved and immunoblotted as shown (I and II indicate unlipidated and lipidated forms of LC3B, respectively). See also Figure S3.
Figure 5
Figure 5
CCPG1 Is a UPR-Inducible Gene that Remodels the ER (A) A549 cells were treated with indicated ER stressors for 16 hr (Tun, tunicamycin, 2.5 μg/mL and Thaps, thapsigargin, 0.5 μM). qRT-PCR was performed for CCPG1 (n = 3, ± SEM, p < 0.05, one-way ANOVA followed by Tukey's post-hoc test). (B) HeLa cells were treated with indicated ER stressors (DTT, 0.5 or 2 mM, and Tun at 1 or 2.5 μg/mL, or Thaps at 0.5 μM) for 16 hr and then immunoblotted. (C) HeLa GFP-CCPG1 cells and variants were analyzed for ER peripheral morphology after ER tracker staining and confocal microscopy, as described in the STAR Methods. Values are given as area of ER in periphery as a proportion of cytosolic area. White dashed lines indicate the outline of GFP-positive cells (n = 3, ± SEM, p < 0.05, ∗∗p < 0.01, one-way ANOVA with Tukey's post-hoc test). Scale bar, 20 μm. (D) HeLa GFP-CCPG1 cells and variants were transfected with mCherry-ER to mark ER membranes and immunostained for LC3B. mCherry-ER/LC3B double-positive foci-containing cells were scored by confocal microscopy, as described in the STAR Methods. White dashed lines indicate the outline of GFP-positive cells. Arrows indicate double-positive foci (n = 3, ± SEM, ∗∗∗p < 0.001, one-way ANOVA with Tukey's post-hoc test). Scale bar, 10 μm. (E–I) HeLa parental cells or CRISPR/Cas9 subclones deleted for CCPG1CCPG1-1 and ΔCCPG1-2) or ATG5ATG5) were (E) immunoblotted for CCPG1 or ATG5, or (F–I) analyzed for peripheral ER content after ER tracker staining as described above, either with or without 8 hr of 0.5 mM DTT treatment. White dashed lines indicate the outline of cells as determined by bright-field images (n = 3, ± SEM, ∗∗∗p < 0.001, ∗∗p < 0.01, p < 0.05, #not significant, two-way ANOVA with Tukey's post-hoc test). Scale bars, 10 μm. (J and K) HeLa parental cells or deletants were starved with EBSS for indicated times and then immunoblotted. (K) Blots were quantified by densitometry for RTN3:tubulin (n = 4) or FAM134B:tubulin ratios (n = 3, ± SEM, ∗∗p < 0.01, p < 0.05, #not significant, two-tailed t tests). See also Figure S4.
Figure 6
Figure 6
Defective Proteostasis in the Pancreas of Ccpg1 Hypomorphic Mice (A and B) Whole pancreata from littermate 6-week-old WT (+/+) or Ccpg1 hypomorphic (GT/GT) mice were immunoblotted for CCPG1 or subjected to RNA extraction and qRT-PCR for Ccpg1 (n = 3 pairs, ± SEM, ∗∗∗p < 0.001, two-tailed t test). (C and D) Fifty mg of whole pancreata from littermate pairs of 6-week-old WT and Ccpg1 hypomorphic mice were homogenized in SDS. Insoluble protein was pelleted, washed and extracted in 8 M urea +10 mM DTT. Pellet samples were normalized according to protein concentration in the soluble fraction and subjected to label-free LC-MS/MS quantification. A median absolute deviation analysis is presented as a heatmap here to show species changing significantly between pairs of mice (pairs joined by connecting brackets). Secretory enzymes are in red, ER luminal chaperones/oxidoreductases are in blue. (E and F) Detergent soluble and insoluble samples prepared as above were immunoblotted and ratios of insoluble to soluble protein species obtained via densitometry (n = 3 pairs, ± SEM, p < 0.05, ∗∗p < 0.01, ∗∗∗p < 0.001, two-tailed t tests). See also Figure S5 and Table S2.
Figure 7
Figure 7
Loss of Cell Polarization and ER Homeostasis, and Consequent Tissue Injury, in Ccpg1 Hypomorphic Exocrine Pancreata (A) The acinar unit of the exocrine pancreas. Polarized acinar cells secrete condensed enzyme (zymogen) granules into ducts from their apical stores. These enzymes are initially synthesized in the expansive rough ER (rER), which occupies the basolateral regions of the cell. (B) CARS imaging or immunohistochemical staining for the ER (protein disulfide isomerase, PDI) in pancreatic tissue from 6-week-old littermate WT (+/+) or Ccpg1 hypomorphic (GT/GT) mice. Punctate CARS signals indicate protein or lipid inclusions. Scale bars, 20 μm. (C) Transmission electron microscopy (TEM) of pancreata from 6-week-old littermate pairs. Scale bar, 5 μm. Analysis of percent cytosolic area occupied by osmophilic protein granules was performed in ImageJ (n = 4 pairs, ± SEM, p < 0.05, two-tailed t test). (D) High magnification TEM of a Ccpg1 hypomorphic mouse reveals that the rER is distended and many supernumerary inclusions are in fact intracisternal granule-like structures (arrows in zoomed inset). Scale bar, 1 μm. (E) RNA from pancreata of 6-week-old littermate pairs of mice was assayed by qRT-PCR for levels of indicated UPR-inducible transcripts (n = 4 pairs, ± SEM, p < 0.05, ∗∗p < 0.01, two-tailed t tests). (F) Plasma from pancreata of 32-day-old mice was analyzed for circulating amylase levels as described in the STAR Methods (n = 8, ± SEM, #not significant, two-tailed t tests). (G) RNA from pancreata of 6-week-old littermate pairs of mice was assayed by qRT-PCR for levels of indicated pancreatic acinar cell differentiation-associated transcripts (n = 4 pairs, ± SEM, #not significant, two-tailed t tests). (H) H&E staining of representative samples from 40-week-old mice. Arrows highlight frequent inflammatory infiltrates observed in Ccpg1 hypomorphic mice and, in zoomed panels, dead acinar cells often observed within the center of such infiltrates. Scale bar, 200 μm. (I) Immunohistochemical detection of proliferative cells (Ki67-positive nuclei) in formalin-fixed paraffin-embedded sections from 20-week-old littermate pairs of mice (n = 3 pairs, ± SEM, ∗∗ = p < 0.01, two-tailed t test). Arrows indicate Ki67-positive nuclei. Scale bar, 200 μm. See also Figures S5–S7.

Comment in

References

    1. Adamson B., Norman T.M., Jost M., Cho M.Y., Nunez J.K., Chen Y., Villalta J.E., Gilbert L.A., Horlbeck M.A., Hein M.Y. A multiplexed single-cell CRISPR screening platform enables systematic dissection of the unfolded protein response. Cell. 2016;167:1867–1882.e21. - PMC - PubMed
    1. Antonucci L., Fagman J.B., Kim J.Y., Todoric J., Gukovsky I., Mackey M., Ellisman M.H., Karin M. Basal autophagy maintains pancreatic acinar cell homeostasis and protein synthesis and prevents ER stress. Proc. Natl. Acad. Sci. USA. 2015;112:E6166–E6174. - PMC - PubMed
    1. Axe E.L., Walker S.A., Manifava M., Chandra P., Roderick H.L., Habermann A., Griffiths G., Ktistakis N.T. Autophagosome formation from membrane compartments enriched in phosphatidylinositol 3-phosphate and dynamically connected to the endoplasmic reticulum. J. Cell Biol. 2008;182:685–701. - PMC - PubMed
    1. B'Chir W., Maurin A.C., Carraro V., Averous J., Jousse C., Muranishi Y., Parry L., Stepien G., Fafournoux P., Bruhat A. The eIF2alpha/ATF4 pathway is essential for stress-induced autophagy gene expression. Nucleic Acids Res. 2013;41:7683–7699. - PMC - PubMed
    1. Behrends C., Sowa M.E., Gygi S.P., Harper J.W. Network organization of the human autophagy system. Nature. 2010;466:68–76. - PMC - PubMed

Publication types

MeSH terms