. 2018 Jan 4;69(1):100-112.e6.
doi: 10.1016/j.molcel.2017.12.002. Epub 2017 Dec 28.

Reciprocal Regulation of the TOR Kinase and ABA Receptor Balances Plant Growth and Stress Response

Affiliations

Reciprocal Regulation of the TOR Kinase and ABA Receptor Balances Plant Growth and Stress Response

Pengcheng Wang et al. Mol Cell. .

Abstract

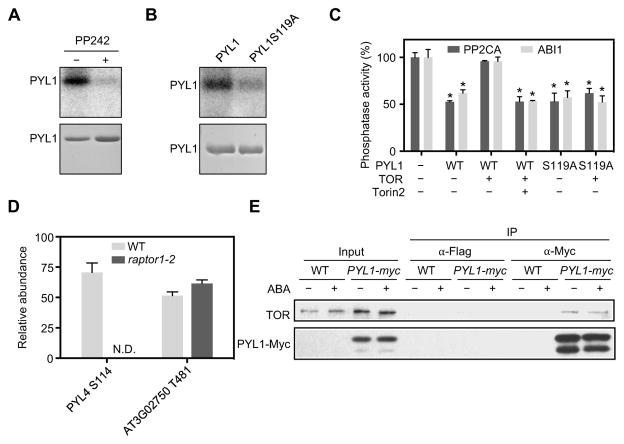
As sessile organisms, plants must adapt to variations in the environment. Environmental stress triggers various responses, including growth inhibition, mediated by the plant hormone abscisic acid (ABA). The mechanisms that integrate stress responses with growth are poorly understood. Here, we discovered that the Target of Rapamycin (TOR) kinase phosphorylates PYL ABA receptors at a conserved serine residue to prevent activation of the stress response in unstressed plants. This phosphorylation disrupts PYL association with ABA and with PP2C phosphatase effectors, leading to inactivation of SnRK2 kinases. Under stress, ABA-activated SnRK2s phosphorylate Raptor, a component of the TOR complex, triggering TOR complex dissociation and inhibition. Thus, TOR signaling represses ABA signaling and stress responses in unstressed conditions, whereas ABA signaling represses TOR signaling and growth during times of stress. Plants utilize this conserved phospho-regulatory feedback mechanism to optimize the balance of growth and stress responses.

Keywords: ABA receptor; Raptor; SnRK2; Target of Rapamycin; abscisic acid; phosphorylation.


Figures

Figure 1
Figure 1. PYL Phosphorylation and the Effects of Non-Phosphorylatable and Phosphomimic Mutations on PYL Function In Vitro
(A) Quantitative analysis of phosphopeptide containing Ser114 in PYL4 in seedlings with or without ABA treatment. A phosphopeptide containing phosphorylated Thr481 in AT3G02750 was used as a control. N.D., not identified in the samples. Error bars indicate s.e.m. (n = 3). (B) Phosphomimic mutations of PYL1 and PYL4 abolished their activity in transient reporter gene expression assays in protoplasts. RD29B::LUC and ZmUBQ::GUS were used as the ABA-responsive reporter and internal control, respectively. After transfection, protoplasts were incubated for 5 hours under light and in the absence of ABA (open bars) or in the presence of 5 μM ABA (filled bars). Error bars indicate s.e.m. (n = 3). Anti-His tag immunoblot shows the levels of histidine-tagged wild type and mutated PYL1 and PYL4 proteins in the protoplasts. (C) PYL1S119D is an inactive ABA receptor and cannot inhibit ABI1 in an in vitro reconstitution of the ABA signaling pathway. The autoradiography (upper panel) and coomassie staining (lower panel) show ABF2 fragment phosphorylation and protein loading, respectively. (D) Phosphomimic mutants of PYL1 and PYL4 cannot inhibit ABI1 phosphatase activity. Error bars indicate s.e.m. (n = 3). (E) PYL1 and PYL1S119A but not the phosphomimic mutant PYL1S119D interact with ABI1 in a yeast two-hybrid assay. (F) Dose-dependent curves show the effect of mutations at Ser119 on ABA binding affinity of PYL1 in TSA assay. Data shown is representative of three independent experiments. (G–I) Binding isotherms showing the effect of mutations at Ser119 on ABA binding affinity of PYL1 in MST assay. Equilibrium dissociation constant (KD) used to indicate the binding affinity between PYL protein and ABA. Data shown is representative of two independent experiments. See also Figure S1.
Figure 2
Figure 2. Phosphomimic Mutations Abolish PYL Activities
(A) Phosphomimic mutants of PYL10 cannot inhibit the phosphatase activity of HAB1. Error bars indicate s.e.m. (n = 3). (B and C) Phosphomimic mutants of PYL10 cannot interact with HAB1(B) or ABI1(C) in alpha screen assay. Error bars indicate s.e.m. (n = 3). (D) Dose-dependent curves showing the effect of mutations at Ser88 on the binding affinity of PYL10 for ABA in TAS assay. Data shown is representative of three independent experiments. Error bars indicate s.e.m. (n = 3). (E and F) Binding isotherms showing the effect of mutations at Ser88 on the binding affinity of PYL10 for ABA in MST assay. Data shown is representative of two independent experiments. See also Figure S2.
Figure 3
Figure 3. Effects of Non-Phosphorylatable and Phosphomimic Mutations on PYL1 Function In Vivo
(A) Photographs of seeds after 5 days of germination and growth on 1/2 Murashige-Skoog (MS) medium containing 3 μM ABA. (B) 10-day-old seedlings grown on 1/2 MS medium with 10 μM ABA (right panel) or without ABA (left panel). (C) Photographs of seedlings after 5 days of growth recovery. The seedlings grown on 1/2 MS medium containing 10 μM ABA were transferred to 1/2 MS medium without ABA. Data shown is representative of six independent experiments. (D) Fresh weight of seedlings after 3 days recovery growth on 1/2 MS medium. Error bars indicate s.e.m. (n = 6). * p < 0.05, Student’s t-test. (E) Rosetta diameter of seedlings after indicated time of recovery growth on 1/2 MS medium. Error bars indicate s.e.m. (n = 6). * p < 0.05, Student’s t-test. See also Figure S3.
Figure 4
Figure 4. TOR Kinase Phosphorylates PYLs
(A) Immunoprecipitated TOR kinase phosphorylates recombinant PYL1 and TOR inhibitor PP242 inhibit the PYL1 phosphorylation. Autoradiograph (upper panel) and Coomassie staining (lower panel) show phosphorylation and loading of purified PYL1. (B) Phosphorylation of recombinant wild type PYL1 and PYL1S119A by immunoprecipitated TOR kinase. Autoradiograph (upper panel) and Coomassie staining (lower panel) show phosphorylation and loading of purified PYL1 and PYL1S119A. (C) Phosphorylation by TOR kinase inhibits the activity of PYL1 but not PYLS119A. Inhibition of ABI1 and PP2CA phosphatase activity was used to indicate the PYL1 activity. Error bars indicate s.e.m. (n = 3). * p < 0.05, Student’s t-test. (D) Quantitative analysis of PYL4 phosphopeptide in wild type and raptor1-2 seedlings. A phosphopeptide containing phosphorylated Thr481 in AT3G02750 was used as a control. N.D., not identified in the samples. Error bars indicate s.e.m. (n = 3). (E) Co-immunoprecipitation assay showing the interaction between TOR and PYL1 in pyr1pyl124-PYL1-Myc transgenic plants. See also Figure S4.
Figure 5
Figure 5. TOR Kinase Inhibition Enhances ABA Signaling
(A) Chlorophyll content of WT and es-tor seedlings 6 days after growing in a liquid medium or a medium supplemented with different ABA concentrations. Error bars indicate s.e.m. (n = 6). * p < 0.05, Student’s t-test. (B) Total chlorophyll content of the seedlings 8 days after transfer to the medium containing 10 μM ABA. Error bars indicate s.e.m. (n = 6). * p < 0.05, Student’s t-test. (C) Photographs of WT and raptor1 plants after 5 days of germination and growth on 1/2 MS medium or 1/2 MS medium containing 0.5 μM ABA. (D) In-gel kinase assay showing SnRK2 activity in the es-tor line, raptor1 mutant or wild type after 0, 10 or 30 min of 10 μM ABA treatment. The position of SnRK2.6 is indicated by an arrowhead. Radioactivity levels of the band (arrowhead) were normalized using wild type after 10 min treatment. Error bars indicate s.e.m. (n = 3). * p < 0.05, Student’s t-test. Anti-TOR and anti-SnRK2.6 immunoblots show TOR and SnRK2 protein levels in the samples. (E) In-gel kinase assay showing ABA induced SnRK2 activity in wild type seedlings preincubated with DMSO, Rapamycin or PP242. The position of SnRK2.6 is indicated by an arrowhead. Radioactivity levels of the band (arrowhead) were normalized using wild type after 10 min treatment. Error bars indicate s.e.m. (n = 3). * p < 0.05, Student’s t-test. Anti-TOR and anti-SnRK2.6 immunoblots show TOR and SnRK2 protein levels in the samples. (F) In-gel kinase assay showing the activities of SnRK2s in the es-tor seedlings with 3 days of DMSO or estradiol incubation. Arrowhead indicates the position of SnRK2.6. Radioactivity of the band indicated by arrowhead was normalized by comparing the radioactivity band in the DMSO treated sample. Error bars indicate s.e.m. (n = 3). * p < 0.05, Student’s t-test. Anti-TOR and anti-SnRK2.6 immunoblots show TOR and SnRK2 protein levels in the samples. (G) ABA responsive gene expression in the es-tor and raptor1 seedlings with 3 days of DMSO or estradiol treatment or with 6 hours treatment with rapamycin. Error bars indicate s.e.m. (n = 3). * p < 0.05, Student’s t-test. (H) Osmotic stress sensitivity as measured by electrolyte leakage in wild type, es-tor and raptor1 plants treated with 30% PEG. Error bars indicate s.d. (n = 6). See also Figure S5.
Figure 6
Figure 6. ABA and Stress Inhibits TOR Kinase Activity
(A) In vitro kinase assay showing ABA inhibition of PYL1 and PYL4 phosphorylation. TOR was immunoprecipitated from 7-day-old seedlings incubated with or without ABA and incubated with recombinant His-Sumo-PYL1 and His-Sumo-PYL4 proteins as substrates. TOR protein levels are indicated by the anti-TOR immunoblot. PYL1/PYL4 protein levels are indicated by Coomassie-stained gel. Band radioactivity levels were normalized to control without ABA and Torin2 treatment. Error bars indicate s.d. (n = 3). (B) ABA represses phosphorylation of S6K1 at T449 site in seedlings. S6K1-HA was overexpressed in the seedlings to facilitate S6K1 detection using anti-HA immunoblot. (C) Phosphorylation level of T449 of S6K1 was decreased by mannitol treatment in seedlings. S6K1-HA was overexpressed in the seedlings to facilitate S6K1 detection using anti-HA immunoblot. (D) ABA inhibition on TOR kinase activity was almost abolished in pyr1pyl12458 sextuple and snrk2.2/3/6 triple mutants. S6K1-HA was expressed in protoplasts made from WT, pyr1pyl12458 sextuple and snrk2.2/3/6 triple mutants. (E) SnRK2.6 but not CDKF phosphorylates a Raptor fragment in vitro. Recombinant GST-Tag fused SnRK2.6 and CDKF were used to phosphorylate AtRaptorB fragment (aa 487-1057) expressed and purified in E. coli in the presence of [γ-32P]ATP. Autoradiograph (Left) and Coomassie staining (Right) show phosphorylation and loading of purified SnRK2.6, CDKF, and RaptorB. Asterisk indicates partially degraded AtRaptorB. (F) Quantitative analysis of phosphopeptides containing S897 and S941 in wild type and snrk2 decuple mutant seedlings, with or without ABA treatment. The relative abundance of individual phosphopeptides was normalized to the amount of S941 phosphopeptide in the snrk2 decuple mutant samples with ABA treatment. N.D., not identified in the samples. Error bars indicate s.d. (n = 3). (G) Phosphorylation of recombinant wild type and S897A mutated AtRaptorB fragments by recombinant SnRK2.6 protein kinase. Autoradiograph (left panel) and Coomassie staining (right panel) show phosphorylation and loading of purified SnRK2.6 and RaptorB fragments. Asterisk indicates partially degraded AtRaptorB. (H and I) ABA inhibitory effect on TOR kinase can be suppressed by RaptorB overexpression. S6K1-Flag and RaptorB-HA were expressed in protoplasts made from raptor1-2. Band intensities of ABA treated samples were normalized to samples without ABA treatment. Error bars indicate s.d (n = 3). * p < 0.05, Student’s t-test. (J) Less RaptorB co-immunoprecipitated with TOR after ABA treatment. CoIP assays were performed using ABA treated or untreated seedlings. Band intensities from ABA treated samples were normalized to samples without ABA treatment. Error bars indicate s.d (n = 3). *** p < 0.001, Student’s t-test. See also Figure S6.
Figure 7
Figure 7
Model illustrating how TOR kinase and PYL phosphorylation balances growth and stress response in plants

Comment in

References

    1. Achard P, Cheng H, De Grauwe L, Decat J, Schoutteten H, Moritz T, Van Der Straeten D, Peng J, Harberd NP. Integration of plant responses to environmentally activated phytohormonal signals. Science. 2006;311:91–94. - PubMed
    1. Antoni R, Rodriguez L, Gonzalez-Guzman M, Pizzio GA, Rodriguez PL. News on ABA transport, protein degradation, and ABFs/WRKYs in ABA signaling. Curr Opin Plant Biol. 2011;14:547–553. - PubMed
    1. Assmann SM, Jegla T. Guard cell sensory systems: recent insights on stomatal responses to light, abscisic acid, and CO2. Curr Opin Plant Biol. 2016;33:157–167. - PubMed
    1. Bogre L, Henriques R, Magyar Z. TOR tour to auxin. EMBO J. 2013;32:1069–1071. - PMC - PubMed
    1. Cai Z, Liu J, Wang H, Yang C, Chen Y, Li Y, Pan S, Dong R, Tang G, Barajas-Lopez JdD, et al. GSK3-like kinases positively modulate abscisic acid signaling through phosphorylating subgroup III SnRK2s in Arabidopsis. Proc Natl Acad Sci USA. 2014;111:9651–9656. - PMC - PubMed

Publication types

MeSH terms