. 2017 Dec 27;4(6):ENEURO.0264-17.2017.
doi: 10.1523/ENEURO.0264-17.2017. eCollection 2017 Nov-Dec.

Developmental Emergence of Phenotypes in the Auditory Brainstem Nuclei of Fmr1 Knockout Mice

Affiliations

Developmental Emergence of Phenotypes in the Auditory Brainstem Nuclei of Fmr1 Knockout Mice

Sarah E Rotschafer et al. eNeuro. .

Abstract

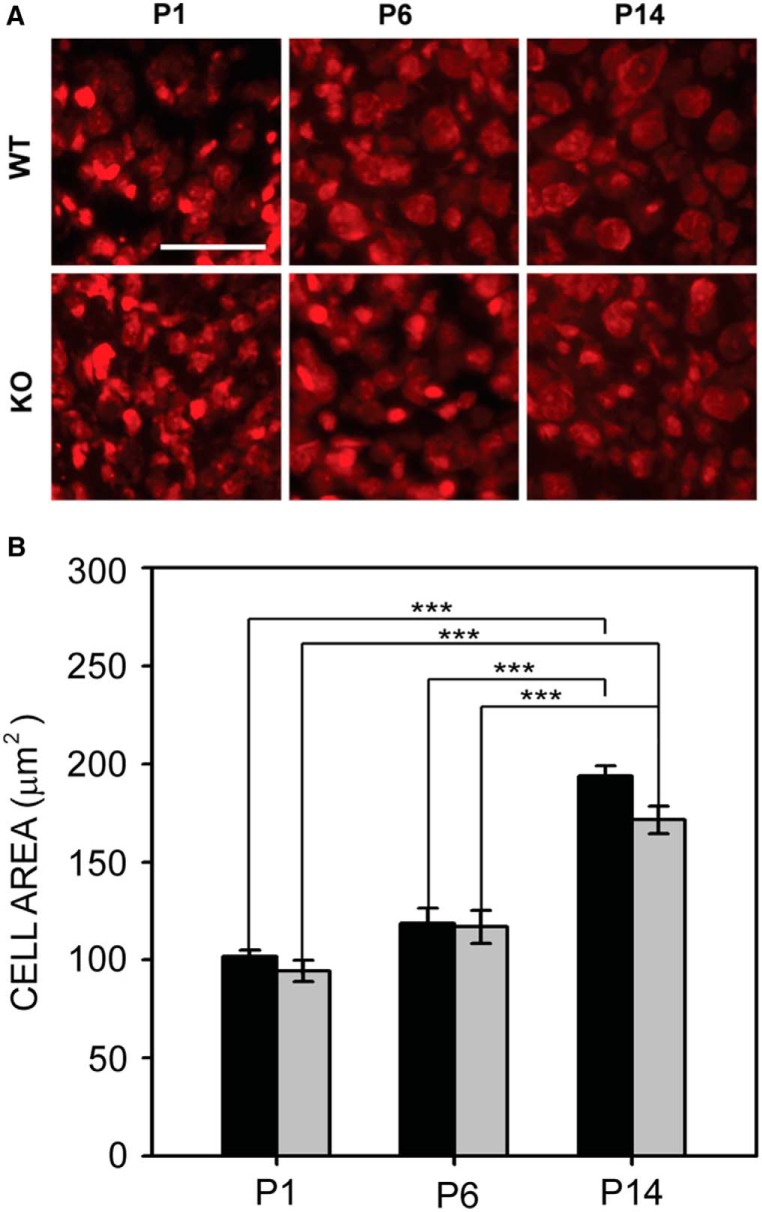
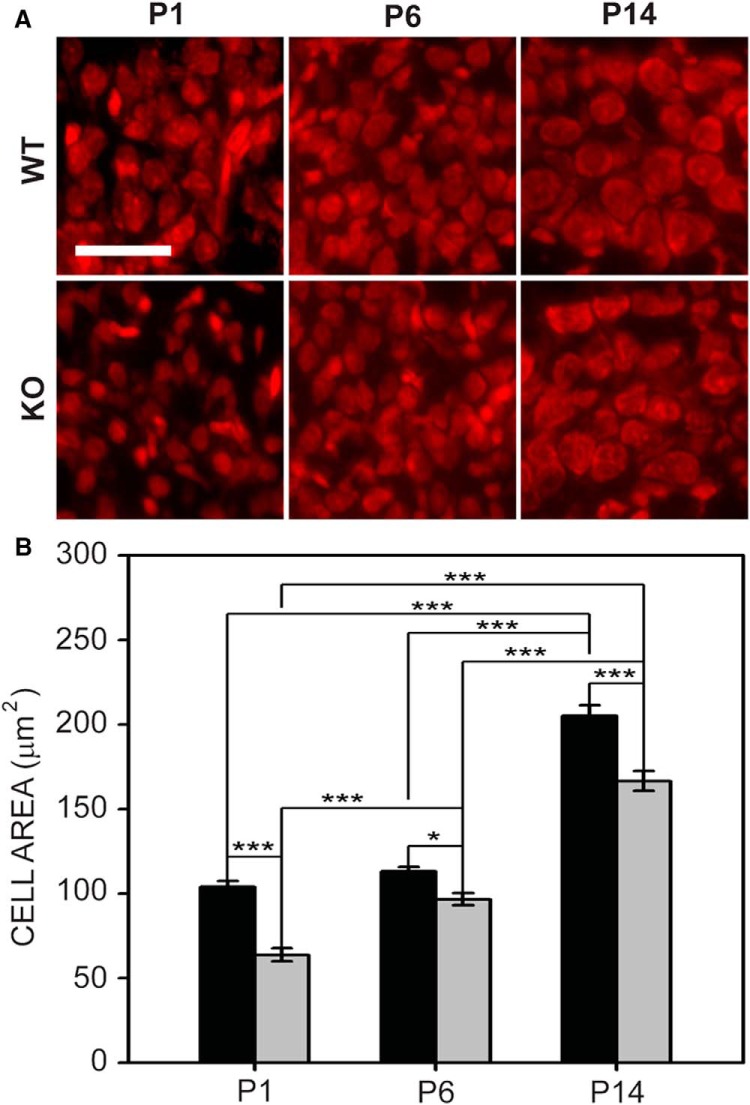
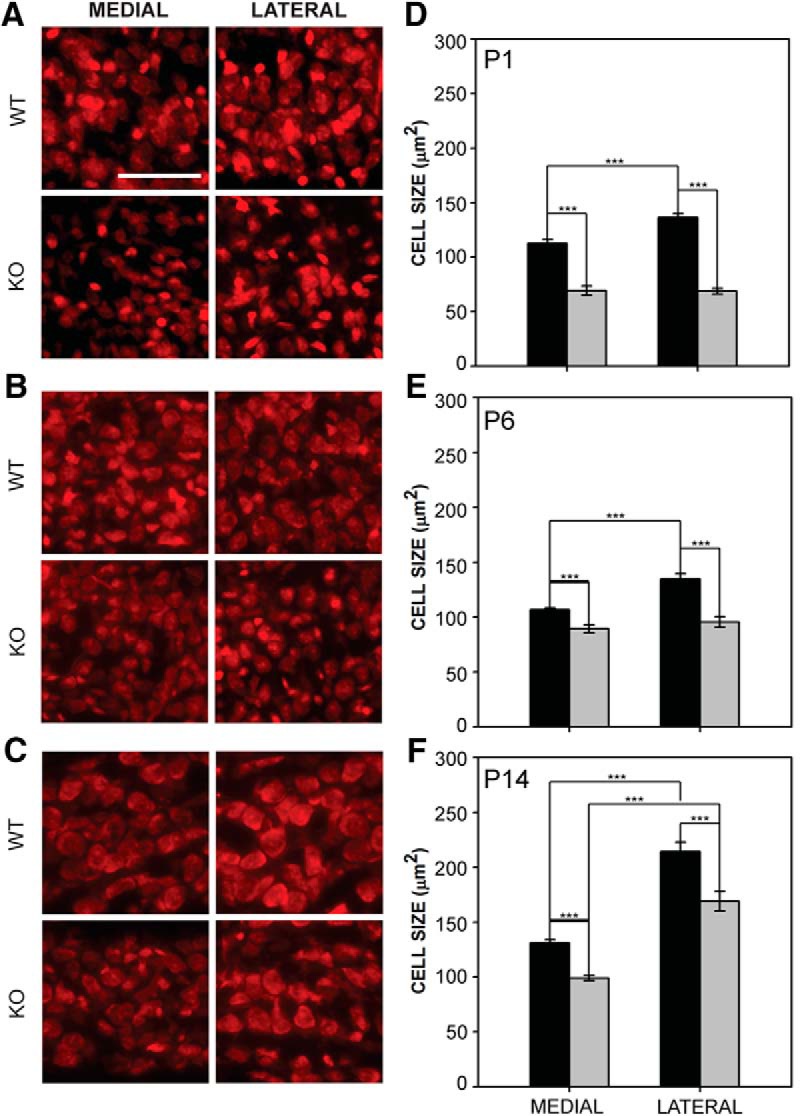
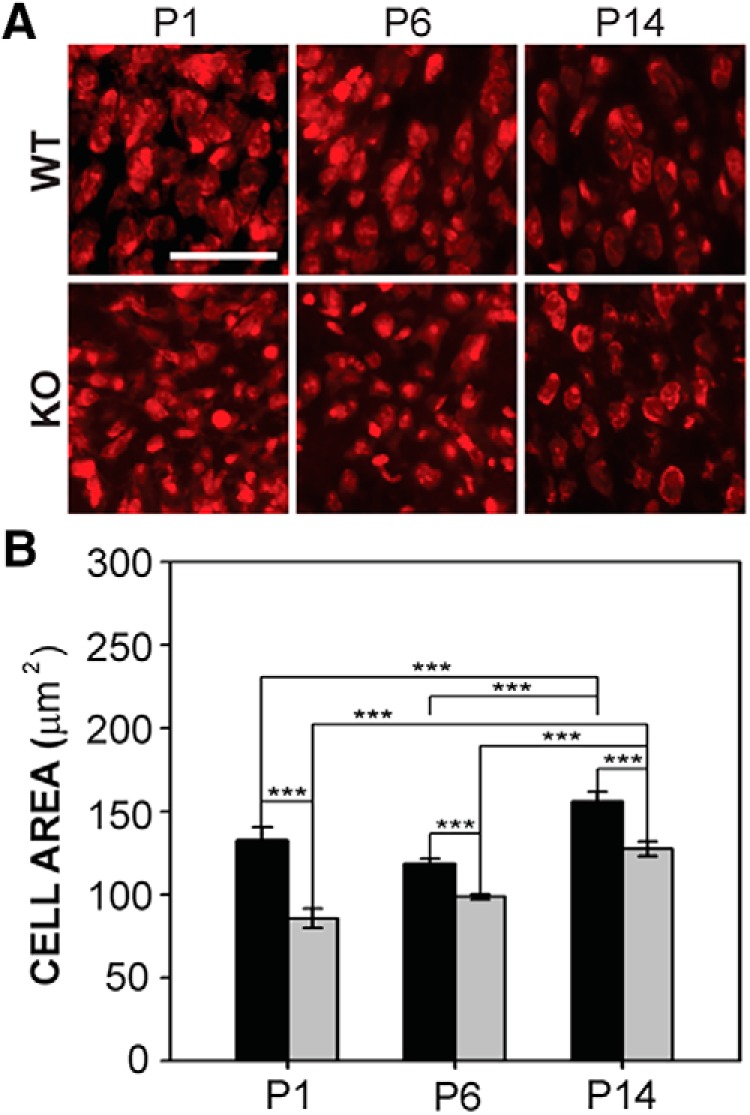
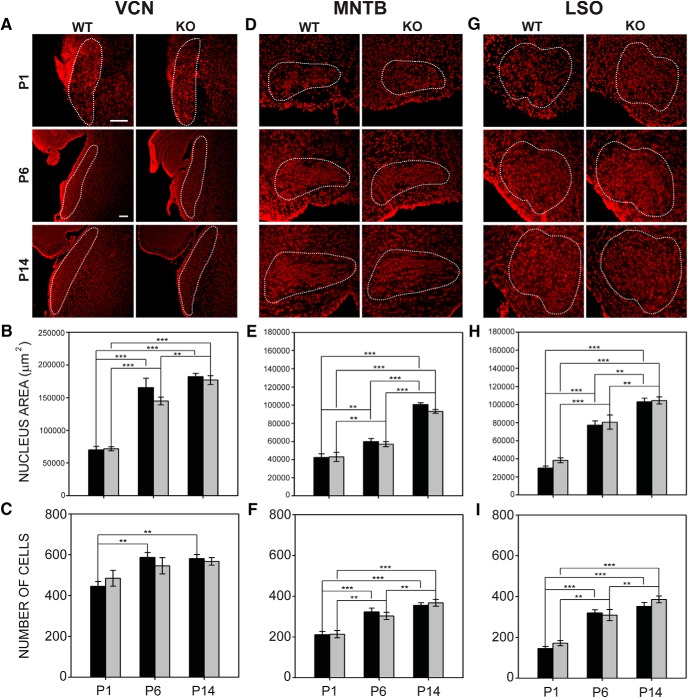
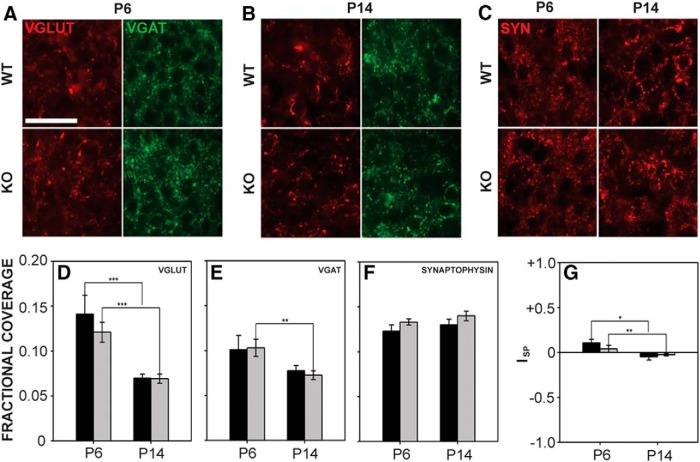
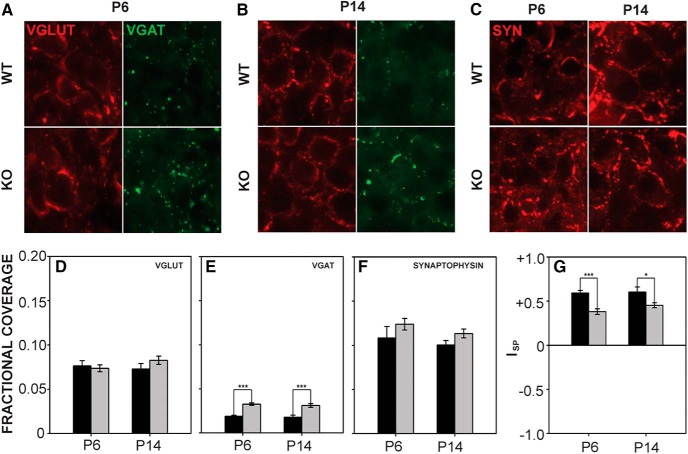
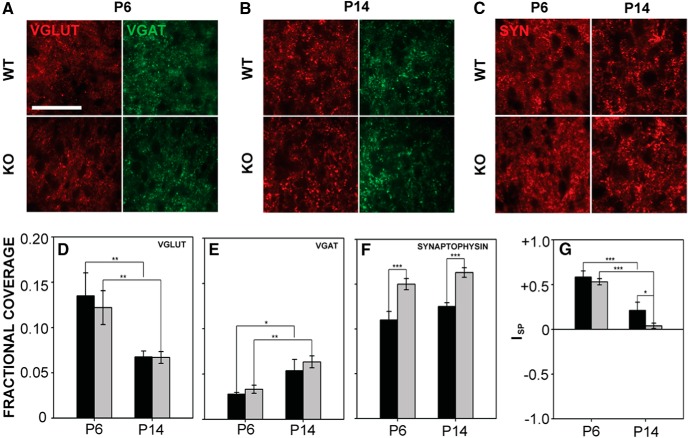
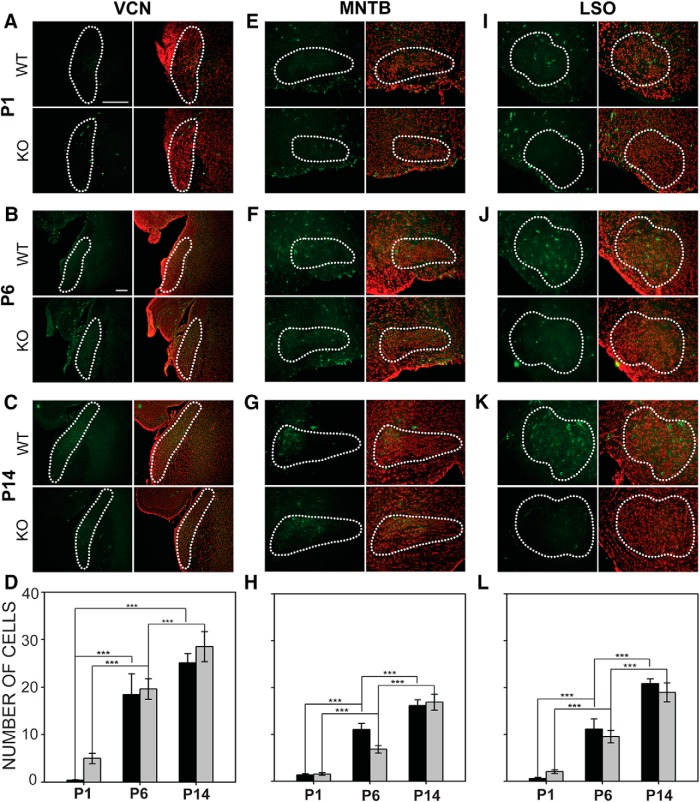
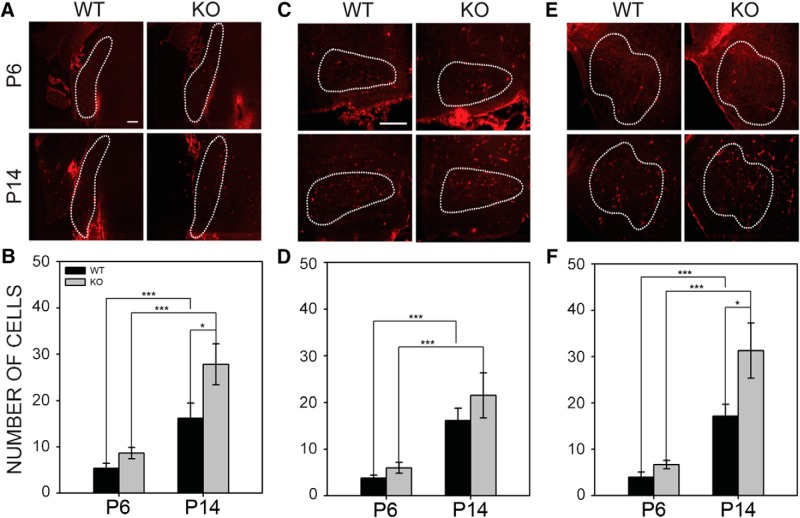
Fragile X syndrome (FXS), the most common monogenic cause of autism, is often associated with hypersensitivity to sound. Several studies have shown abnormalities in the auditory brainstem in FXS; however, the emergence of these auditory phenotypes during development has not been described. Here, we investigated the development of phenotypes in FXS model [Fmr1 knockout (KO)] mice in the ventral cochlear nucleus (VCN), medial nucleus of the trapezoid body (MNTB), and lateral superior olive (LSO). We studied features of the brainstem known to be altered in FXS or Fmr1 KO mice, including cell size and expression of markers for excitatory (VGLUT) and inhibitory (VGAT) synapses. We found that cell size was reduced in the nuclei with different time courses. VCN cell size is normal until after hearing onset, while MNTB and LSO show decreases earlier. VGAT expression was elevated relative to VGLUT in the Fmr1 KO mouse MNTB by P6, before hearing onset. Because glial cells influence development and are altered in FXS, we investigated their emergence in the developing Fmr1 KO brainstem. The number of microglia developed normally in all three nuclei in Fmr1 KO mice, but we found elevated numbers of astrocytes in Fmr1 KO in VCN and LSO at P14. The results indicate that some phenotypes are evident before spontaneous or auditory activity, while others emerge later, and suggest that Fmr1 acts at multiple sites and time points in auditory system development.

Keywords: auditory; brainstem; fragile x; lateral superior olive; medial nucleus of the trapezoid body; ventral cochlear nucleus:.


Conflict of interest statement

Authors report no conflict of interest.

Figures

Figure 1.
Figure 1.
VCN cell size in wild-type and Fmr1 KO mice. A, VCN cells stained with fluorescent Nissl in wild-type (top) and Fmr1 KO (bottom) mice at P1, P6, and P14. Scale bar = 100 μm. B, Cell size did not differ between wild-type mice (black bars) and Fmr1 KO mice (gray bars) at P1, P6, or P14. Both genotypes showed increases in cell size between P1 and P14, and between P6 and P14. *, p < 0.05; **, p < 0.01; and ***, p < 0.001.
Figure 2.
Figure 2.
MNTB cell size in wild-type and Fmr1 KO mice. A, MNTB cells in wild-type mice (top) and Fmr1 KO mice (bottom) at P1, P6, and P14. Scale bar = 100 μm. B, The cross-sectional area of Fmr1 KO neurons was significantly reduced compared to wild-type mice at all ages tested. *, p < 0.05; **, p < 0.01; and ***, p < 0.001.
Figure 3.
Figure 3.
MNTB cell size was reduced and medial-lateral cell size gradient development delayed in Fmr1 KO mice. A–C, Cell area in wild-type and Fmr1 KO MNTB at P1, P6, and P14. D–F, Cells in the Fmr1 KO medial and lateral MNTB were smaller than those found in wild-type mice at P1, P6, and P14. In P1 and P6 wild-type mice, medial MNTB cells were significantly smaller than lateral MNTB cells, but in Fmr1 KO mice, this difference was not observed. By P14, both genotypes showed significantly smaller cell size in medial MNTB compared to lateral MNTB. Scale bar in A = 100 μm; applies to A–C. *, p < 0.05; **, p < 0.01; and ***, p < 0.001.
Figure 4.
Figure 4.
LSO cell size in wild-type and Fmr1 KO mice. A, Fluorescent Nissl stain in LSO in wild-type mice (top) and Fmr1 KO mice (bottom) at P1, P6, and P14. Scale bar = 100 μm. B, Fmr1 KO cell size was significantly smaller than those in wild-type mice at all ages tested. *, p < 0.05; **, p < 0.01; and ***, p < 0.001.
Figure 5.
Figure 5.
Nucleus growth and cell acquisition in wild-type and Fmr1 KO mice. A, Outlines of VCN in coronal sections at P1, P6, and P14. Medial is to the right. B, In VCN, both wild-type mice and Fmr1 KO mice show age-related increases in nucleus area. C, The number of cells in the wild-type VCN increased with age. Increases in cell number in Fmr1 KO mice did not reach significance. D, Outlines of MNTB in wild-type and Fmr1 KO mice at P1, P6, and P14. E, In MNTB, wild-type and Fmr1 KO mice both showed significant increases in nucleus size at all ages tested. F, Both wild-type mice and Fmr1 KO mice showed age-dependent increases in cell number in MNTB. G, Outlines of LSO in wild-type and Fmr1 KO mice at P1, P6, and P14. H, LSO grew in size at each age in both wild-type and Fmr1 KO mice. I, The number of cells in LSO in both wild-type mice and Fmr1 KO mice increased significantly with age. Top row in A: 100-μm scale bar applies to P1 images (20× magnification). Second row in A: 100-μm scale bar applies to for P6 and P14 images (10× magnification). *, p < 0.05; **, p < 0.01; and ***, p < 0.001.
Figure 6.
Figure 6.
VGLUT, VGAT, and synaptophysin expression in VCN. A, B, VGLUT and VGAT immunofluorescence in VCN in wild-type (top) and Fmr1 KO (bottom) mice at P6 (A) and P14 (B). C, Synaptophysin expression in VCN in wild-type (top) and Fmr1 KO (bottom) mice at P6 (left) and P14 (right). D, In VCN in both wild-type and Fmr1 KO mice, VGLUT fractional coverage was reduced at P14 compared to P6, but did not vary between genotypes. E, VGAT fractional coverage decreased significantly from P6 to P14 in Fmr1 KO mice. F, Synaptophysin fractional coverage did not differ with age or genotype. G, VGLUT relative to VGAT expression (ISP) did not differ significantly between genotypes, but ISP values decreased significantly from P6 to P14. Scale bar in A = 50 μm; applies to A–C. *, p < 0.05; **, p < 0.01; and ***, p < 0.001.
Figure 7.
Figure 7.
VGLUT, VGAT, and synaptophysin expression in MNTB. A, B, VGLUT and VGAT expression in wild-type and Fmr1 KO MNTB at P6 (A) and P14 (B). C, Synaptophysin expression in MNTB in wild-type (top) and Fmr1 KO (bottom) mice. D, VGLUT fractional coverage did not vary between genotypes or ages. E, VGAT fractional coverage was significantly greater in Fmr1 KO MNTB at both P6 and P14. F, Synaptophysin coverage did not differ significantly by age or by genotype. G, ISP values were significantly smaller in Fmr1 KO mice at both P6 and P14. Scale bar in A = 50 μm; applies to A–C. *, p < 0.05; **, p < 0.01; and ***, p < 0.001.
Figure 8.
Figure 8.
VGLUT, VGAT, and synaptophysin expression in LSO. A, B, Expression of VGLUT (left) and VGAT (right) at P6 and P14 in LSO. C, Synaptophysin expression at P6 and P14 in wild-type and mutant mice. D, In both wild-type and Fmr1 KO LSO, VGLUT expression decreased with age but did not differ between genotypes. E, VGAT fractional coverage increased between P6 and P14 in both genotypes but did not differ between genotypes. F, Synaptophysin fractional coverage was significantly greater in Fmr1 KO mice at both ages tested and did not change significantly between these ages. G, ISP values decreased significantly between P6 and P14. ISP was significantly smaller in Fmr1 KO mice than in wild-type mice at P14. Scale bar in A = 50 μm; applies to A–C. *, p < 0.05; **, p < 0.01; and ***, p < 0.001.
Figure 9.
Figure 9.
Emergence of microglia in the auditory brainstem nuclei in wild-type and Fmr1 KO mice. A–C, Increase in microglial population was studied in the VCN at P1, P6, and P14. Left column, Iba1 immunofluorescence in green; right column, Iba1 together with fluorescent Nissl. Nucleus outline is shown in dashed lines. D, The number of microglia in VCN increased with age in both wild-type and Fmr1 KO mice, but no difference was seen between the genotypes. E–G, Emergence of microglia was evaluated in MNTB using Iba1 immunofluorescence (left) together with Nissl (right). H, Wild type and Fmr1 KO mice both showed significant increases in the number of microglia present in MNTB each age tested, but no significant differences were found between genotypes. I–K, Emergence of microglia in LSO during development. L, The number of microglia expressed steadily increased at each age tested in both wild-type and Fmr1 KO mice. As for VCN and MNTB, no difference in numbers of microglia were seen between the genotypes. Scale bar in A = 100 μm, applies to A, E, and I. Scale bar in B = 10 0μm, applies to B, C, F, G, and J–K. *, p < 0.05; **, p < 0.01; and ***, p < 0.001.
Figure 10.
Figure 10.
Emergence of astrocytes in the wild-type and Fmr1 KO auditory brainstem. A, The number of astrocytes in the VCN was evaluated at P6 and P14 using ALDH1L1 immunofluorescence. B, Numbers of ALDH1L1-positive astrocytes in VCN increased between P6 and P14 in both genotypes. At P14, there were significantly more astrocytes in VCN in Fmr1 KO mice than in wild-type mice. C, Astrocytes labeled in MNTB at P6 and P14. D, Astrocyte numbers increased significantly in MNTB in both wild-type and Fmr1 KO mice, but no difference were seen between the genotypes. E, ALDH1L1 immunolabeled astrocytes in LSO. F, Astrocytes increased in number between P6 and P14 in both genotypes, and significantly more astrocytes were present in the Fmr1 KO LSO at P14. Scale bar in A = 100 μm; scale bar in C = 100 μm, applies to C and E. *, p < 0.05; **, p < 0.01; and ***, p < 0.001.

Similar articles

Cited by

References

    1. Albrecht O, Dondzillo A, Mayer F, Thompson JA, Klug A (2014) Inhibitory projections from the ventral nucleus of the trapezoid body to the medial nucleus of the trapezoid body in the mouse. Front Neural Circuits 8:83. 10.3389/fncir.2014.00083 - DOI - PMC - PubMed
    1. Arcuri C, Mecca C, Bianchi R, Giambanco I, Donato R (2017) The pathophysiological role of microglia in dynamic surveillance, phagocytosis and structural remodeling of the developing CNS. Front Mol Neurosci 10:191. 10.3389/fnmol.2017.00191 - DOI - PMC - PubMed
    1. Bailey DB, Hatton DD, Skinner M (1998) Early developmental trajectories of males with fragile X syndrome. Am J Ment Retard 103:29–39. 10.1352/0895-8017(1998)103&lt;0029:EDTOMW&gt;2.0.CO;2 - DOI - PubMed
    1. Baranek GT, Danko CD, Skinner ML, Bailey DB, Jr., Hatton DD, Roberts JE, Mirrett PL (2005) Video analysis of sensory-motor features in infants with fragile X syndrome at 9-12 months of age. J Autism Dev Disord 35:645–656. 10.1007/s10803-005-0008-7 - DOI - PubMed
    1. Bassell GJ, Warren ST (2008) Fragile X syndrome: loss of local mRNA regulation alters synaptic development and function. Neuron 60:201–214. 10.1016/j.neuron.2008.10.004 - DOI - PMC - PubMed

Publication types

MeSH terms

Substances