

TFPIα interacts with FVa and FXa to inhibit prothrombinase during the initiation of coagulation
- PMID: 29291252
- PMCID: PMC5745139
- DOI: 10.1182/bloodadvances.2017011098
TFPIα interacts with FVa and FXa to inhibit prothrombinase during the initiation of coagulation
Abstract
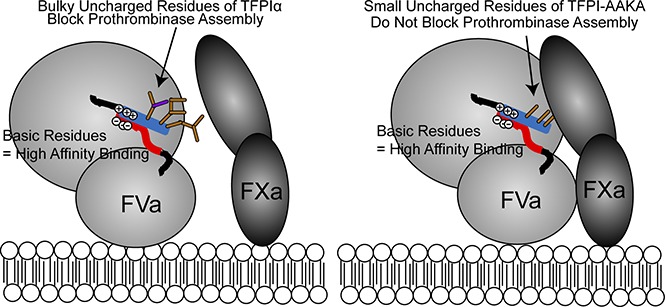
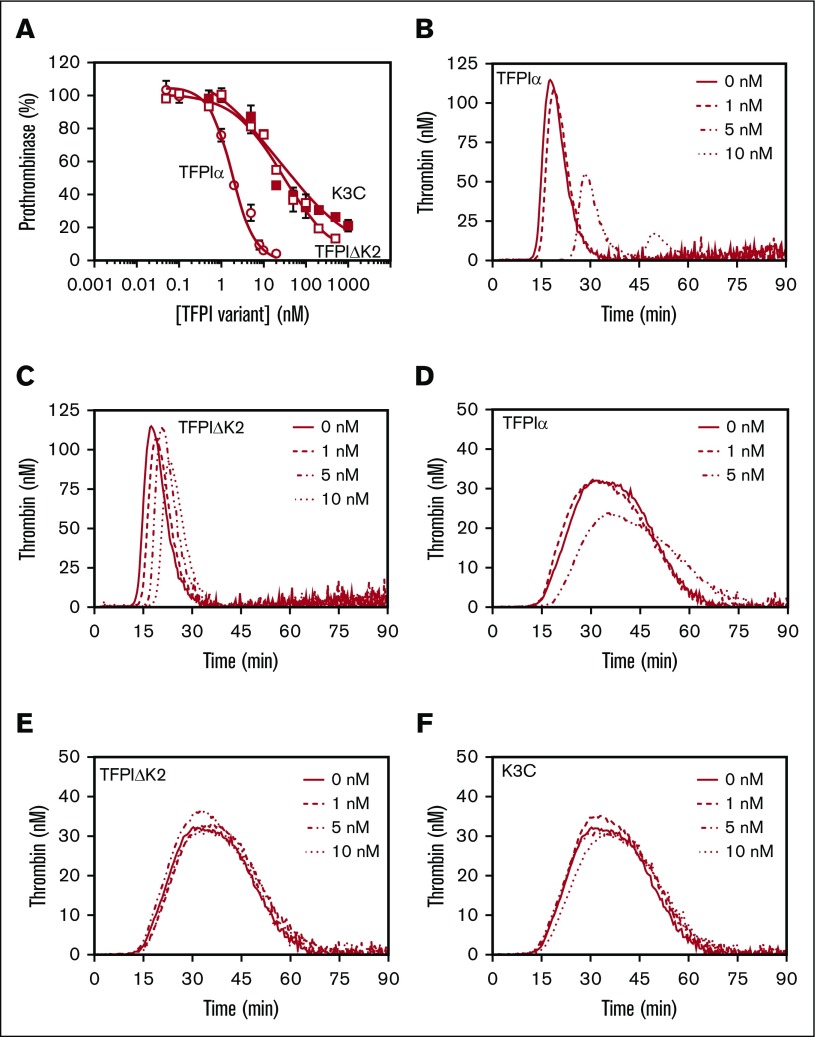
Tissue factor pathway inhibitor α (TFPIα) inhibits prothrombinase, the thrombin-generating complex of factor Xa (FXa) and factor Va (FVa), during the initiation of coagulation. This inhibition requires binding of a conserved basic region within TFPIα to a conserved acidic region in FXa-activated and platelet-released FVa. In this study, the contribution of interactions between TFPIα and the FXa active site and FVa heavy chain to prothrombinase inhibition were examined to further define the inhibitory biochemistry. Removal of FXa active site binding by mutation or by deletion of the second Kunitz domain (K2) of TFPIα produced 17- or 34-fold weaker prothrombinase inhibition, respectively, establishing that K2 binding to the FXa active site is required for efficient inhibition. Substitution of the TFPIα basic region uncharged residues (Leu252, Ile253, Thr255) with Ala (TFPI-AAKA) produced 5.8-fold decreased inhibition. This finding was confirmed using a basic region peptide (Leu252-Lys261) and Ala substitution peptides, which established that the uncharged residues are required for prothrombinase inhibitory activity but not for binding the FVa acidic region. This suggests that the uncharged residues mediate a secondary interaction with FVa subsequent to acidic region binding. This secondary interaction seems to be with the FVa heavy chain, because the FV Leiden mutation weakened prothrombinase inhibition by TFPIα but did not alter TFPI-AAKA inhibitory activity. Thus, efficient inhibition of prothrombinase by TFPIα requires at least 3 intermolecular interactions: (1) the TFPIα basic region binds the FVa acidic region, (2) K2 binds the FXa active site, and (3) Leu252-Thr255 binds the FVa heavy chain.
Conflict of interest statement
Conflict-of-interest disclosure: A.E.M. receives grant support from Novo Nordisk. H.H.P., B.Y., X.W., and I.H. are employees of Novo Nordisk A/S. J.P.W. declares no competing financial interests.
Figures


Similar articles
-
The C-terminus of tissue factor pathway inhibitor-α inhibits factor V activation by protecting the Arg1545 cleavage site.J Thromb Haemost. 2017 Jan;15(1):140-149. doi: 10.1111/jth.13559. Epub 2016 Dec 3. J Thromb Haemost. 2017. PMID: 27801970
-
Tissue factor pathway inhibitor-alpha inhibits prothrombinase during the initiation of blood coagulation.Proc Natl Acad Sci U S A. 2013 Oct 29;110(44):17838-43. doi: 10.1073/pnas.1310444110. Epub 2013 Oct 14. Proc Natl Acad Sci U S A. 2013. PMID: 24127605 Free PMC article.
-
Activated protein C, protein S, and tissue factor pathway inhibitor cooperate to inhibit thrombin activation.Thromb Res. 2023 Oct;230:84-93. doi: 10.1016/j.thromres.2023.08.012. Epub 2023 Aug 23. Thromb Res. 2023. PMID: 37660436 Free PMC article.
-
Novel insights into the regulation of coagulation by factor V isoforms, tissue factor pathway inhibitorα, and protein S.J Thromb Haemost. 2017 Jul;15(7):1241-1250. doi: 10.1111/jth.13665. J Thromb Haemost. 2017. PMID: 28671348 Review.
-
Biology of tissue factor pathway inhibitor.Blood. 2014 May 8;123(19):2934-43. doi: 10.1182/blood-2013-11-512764. Epub 2014 Mar 11. Blood. 2014. PMID: 24620349 Free PMC article. Review.
Cited by
-
Platelet anticoagulant proteins: Modulators of thrombosis propensity within a procoagulant cell.J Thromb Haemost. 2020 Sep;18(9):2083-2086. doi: 10.1111/jth.14995. Epub 2020 Jul 30. J Thromb Haemost. 2020. PMID: 32729671 Free PMC article. No abstract available.
-
Maintaining extraembryonic expression allows generation of mice with severe tissue factor pathway inhibitor deficiency.Blood Adv. 2019 Feb 12;3(3):489-498. doi: 10.1182/bloodadvances.2018018853. Blood Adv. 2019. PMID: 30755437 Free PMC article.
-
Regulation of coagulation by tissue factor pathway inhibitor: Implications for hemophilia therapy.J Thromb Haemost. 2022 Jun;20(6):1290-1300. doi: 10.1111/jth.15697. Epub 2022 Mar 27. J Thromb Haemost. 2022. PMID: 35279938 Free PMC article. Review.
-
Post-transcriptional control of haemostatic genes: mechanisms and emerging therapeutic concepts in thrombo-inflammatory disorders.Cardiovasc Res. 2023 Jul 6;119(8):1624-1640. doi: 10.1093/cvr/cvad046. Cardiovasc Res. 2023. PMID: 36943786 Free PMC article. Review.
-
The contribution of TFPIα to the hemostatic response to injury in mice.J Thromb Haemost. 2021 Sep;19(9):2182-2192. doi: 10.1111/jth.15430. Epub 2021 Jul 14. J Thromb Haemost. 2021. PMID: 34160126 Free PMC article.
References
-
- Mann KG, Nesheim ME, Church WR, Haley P, Krishnaswamy S. Surface-dependent reactions of the vitamin K-dependent enzyme complexes. Blood. 1990;76(1):1-16. - PubMed
-
- Miletich JP, Kane WH, Hofmann SL, Stanford N, Majerus PW. Deficiency of factor Xa-factor Va binding sites on the platelets of a patient with a bleeding disorder. Blood. 1979;54(5):1015-1022. - PubMed
-
- Zhu H, Toso R, Camire RM. Inhibitory sequences within the B-domain stabilize circulating factor V in an inactive state. J Biol Chem. 2007;282(20):15033-15039. - PubMed
Grants and funding
LinkOut - more resources
Full Text Sources
Other Literature Sources
Miscellaneous
