. 2018 May:195:25-47.
doi: 10.1016/j.trsl.2017.12.002. Epub 2017 Dec 12.

Unique metabolomic signature associated with hepatorenal dysfunction and mortality in cirrhosis

Affiliations

Unique metabolomic signature associated with hepatorenal dysfunction and mortality in cirrhosis

Ayse L Mindikoglu et al. Transl Res. 2018 May.

Abstract

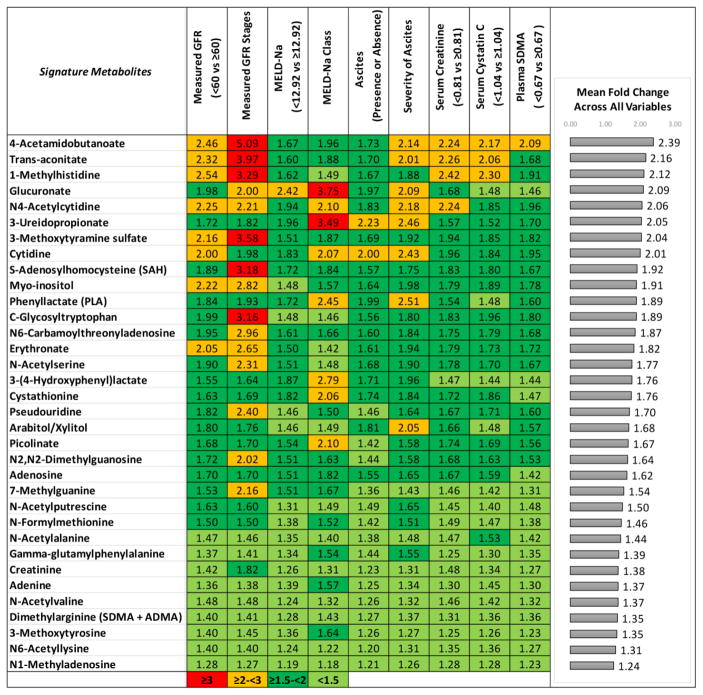
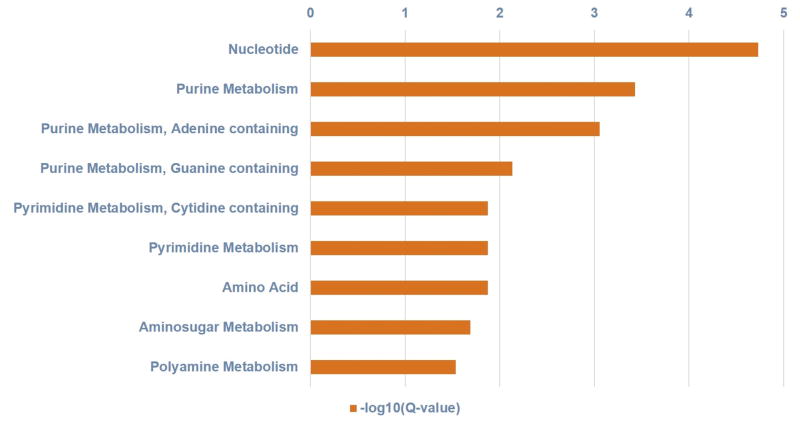
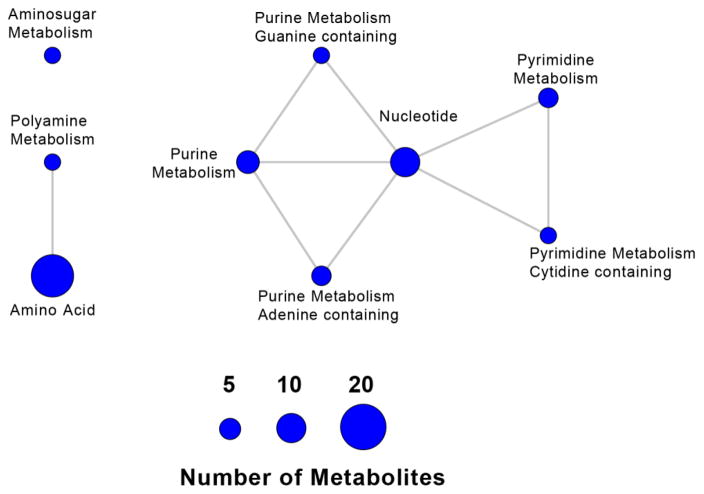
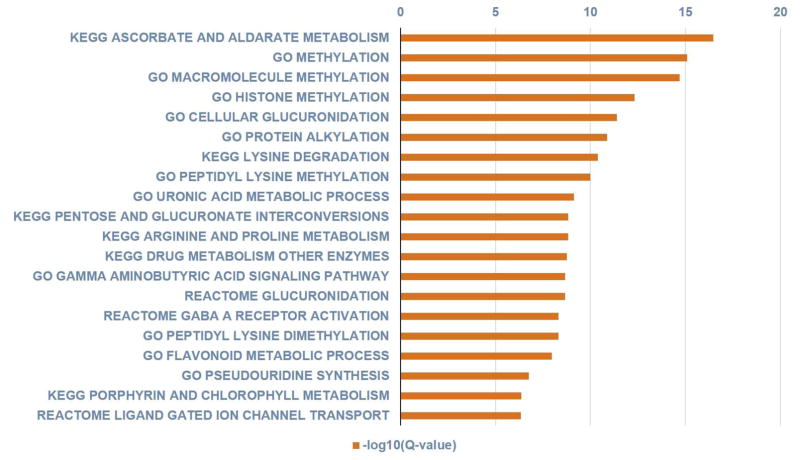
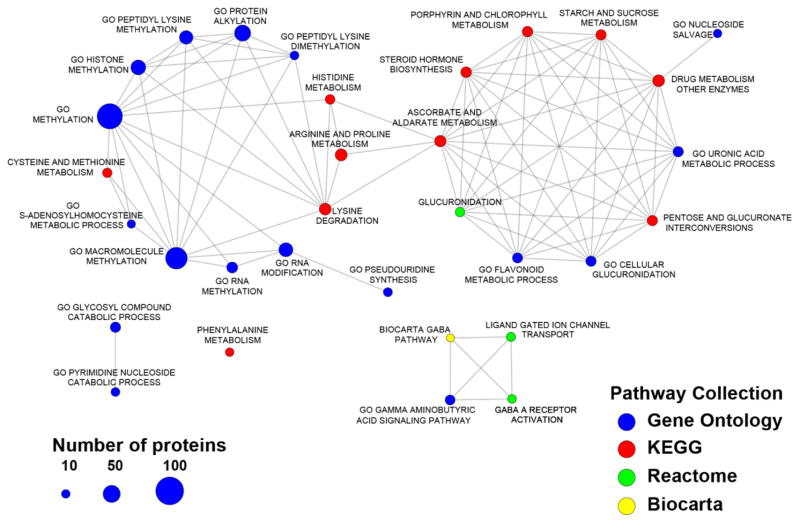
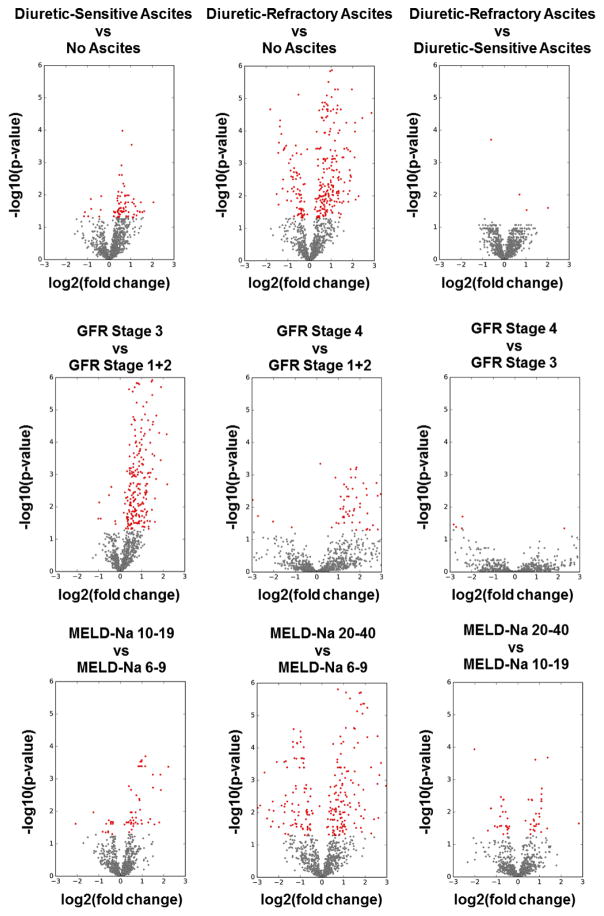
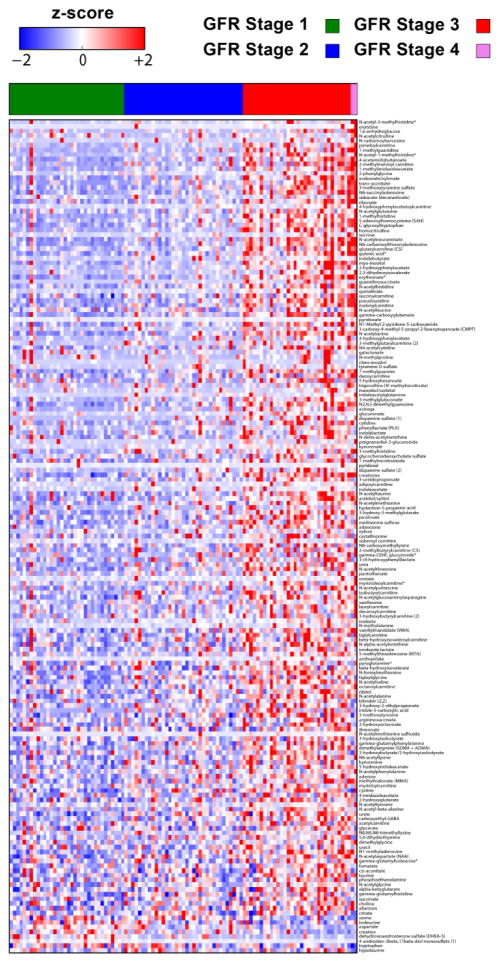
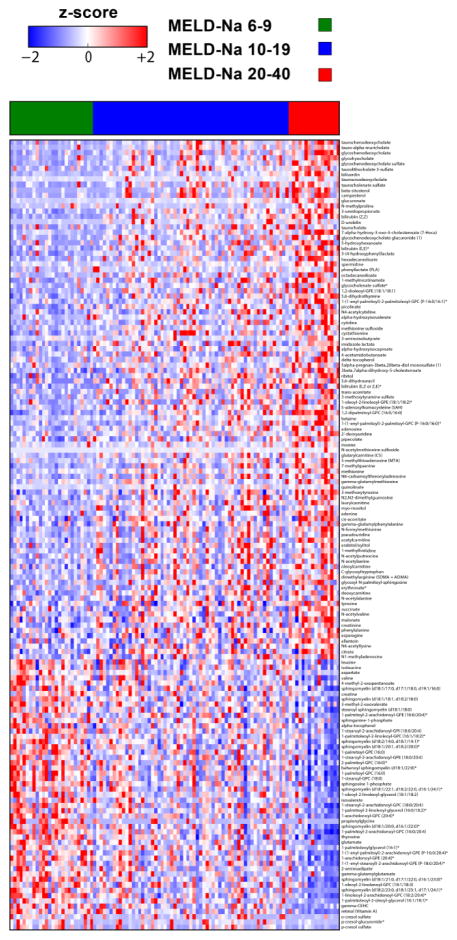
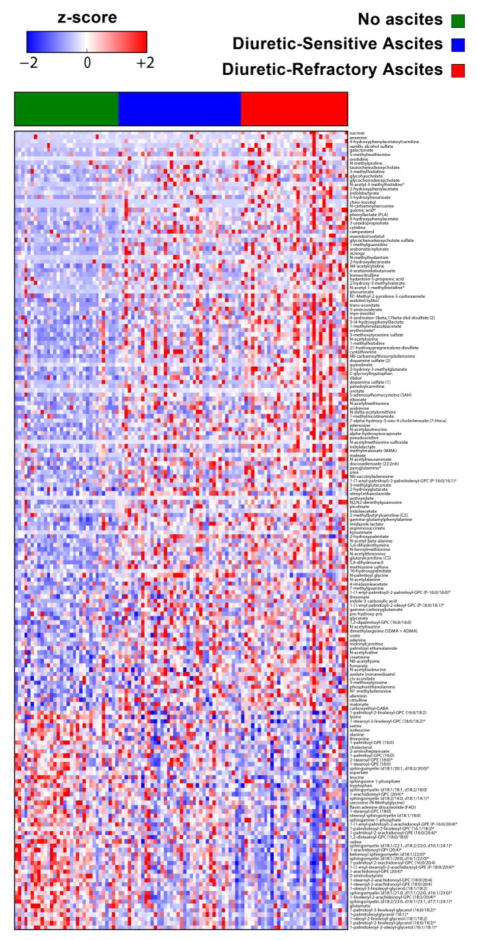
The application of nontargeted metabolomic profiling has recently become a powerful noninvasive tool to discover new clinical biomarkers. This study aimed to identify metabolic pathways that could be exploited for prognostic and therapeutic purposes in hepatorenal dysfunction in cirrhosis. One hundred three subjects with cirrhosis had glomerular filtration rate (GFR) measured using iothalamate plasma clearance, and were followed until death, transplantation, or the last encounter. Concomitantly, plasma metabolomic profiling was performed using ultrahigh performance liquid chromatography-tandem mass spectrometry to identify preliminary metabolomic biomarker candidates. Among the 1028 metabolites identified, 34 were significantly increased in subjects with high liver and kidney disease severity compared with those with low liver and kidney disease severity. The highest average fold-change (2.39) was for 4-acetamidobutanoate. Metabolite-based enriched pathways were significantly associated with the identified metabolomic signature (P values ranged from 2.07E-06 to 0.02919). Ascorbate and aldarate metabolism, methylation, and glucuronidation were among the most significant protein-based enriched pathways associated with this metabolomic signature (P values ranged from 1.09E-18 to 7.61E-05). Erythronate had the highest association with measured GFR (R-square = 0.571, P <0.0001). Erythronate (R = 0.594, P <0.0001) and N6-carbamoylthreonyladenosine (R = 0.591, P <0.0001) showed stronger associations with measured GFR compared with creatinine (R = 0.588, P <0.0001) even after controlling for age, gender, and race. The 5 most significant metabolites that predicted mortality independent of kidney disease and demographics were S-adenosylhomocysteine (P = 0.0003), glucuronate (P = 0.0006), trans-aconitate (P = 0.0018), 3-ureidopropionate (P = 0.0021), and 3-(4-hydroxyphenyl)lactate (P = 0.0047). A unique metabolomic signature associated with hepatorenal dysfunction in cirrhosis was identified for further investigations that provide potentially important mechanistic insights into cirrhosis-altered metabolism.


Figures

Figure 1
Figure 1
Among the 1028 metabolites identified in plasma, 34 were significantly increased and associated with all the nine clinical and laboratory variables indicative of liver and kidney disease severity.
Figure 2
Figure 2
Figure shows the metabolite-based enriched pathways, in descending order, nucleotide, purine, pyrimidine, amino acid, amino sugar and polyamine metabolisms that were significantly associated with the metabolomic signature (hypergeometric distribution; Q values ranged from 1.86E-05 to 0.02919).
Figure 3
Figure 3
Pathway network representation of the metabolite-based enriched pathways for the 34 metabolites associated with low vs. high liver and kidney disease severity. Nodes correspond to significant pathways, with node size associated with the number of significant metabolites in each pathway; edges indicate common metabolites between two pathways. We identified significant groups of processes including a) polyamine metabolism and amino acid; b) purine metabolism, pyrimidine metabolism, and nucleotides.
Figure 4
Figure 4
Figure shows the 20 most significantly associated protein-based enriched pathways in descending order of significance (hypergeometric distribution; Q values ranged from 3.49E-17 to 7.61E-05).
Figure 5
Figure 5
Network of enriched pathways for the 34 metabolites associated with low vs. high hepatic and kidney disease severity, based on functionally-related proteins. Nodes correspond to significant pathways, with node size associated with the number of associated proteins in each pathway; edges indicate common proteins between two pathways. We identified significant groups of processes including a) methylation; b) glucuronidation; c) GABA-ergic pathways.
Figure 6
Figure 6
Volcano plots for the statistical analysis of metabolites vs clinical variables. Shown in the figure are the scatterplots of P value as a function of fold change for severity of ascites, GFR stages, and MELD-Na score classes. Overall, the plots show robust separation of metabolite values with clinical variables. Red color: significant metabolites. Gray color: detected metabolites, not significant.
Figure 7
Figure 7
Figure shows the heatmap of the metabolites that significantly changed across GFR stages.
Figure 8
Figure 8
Figure shows the heatmap of the metabolites that significantly changed across MELD-Na score classes. While mean value of several metabolite levels shown in the first 2/3 of the heat map increased in subjects with MELD-Na score 20–40 compared with those with lower MELD-Na scores, mean values of several other metabolites (e.g. sphingomyelins, glycerophosphocholines and glycerophosphoethanolamines) in the last 1/3 of the heat map decreased.
Figure 9
Figure 9
Figure shows the heatmap of the metabolites that significantly changed across severity of ascites. While mean value of several metabolite levels shown in the first 2/3 of the heat map significantly increased in subjects with diuretic-refractory ascites compared with those without ascites and with diuretic-sensitive ascites, mean value of several other metabolites (e.g. sphingomyelins, glycerophosphocholines and glycerophosphoethanolamines) in the last 1/3 of the heat map decreased.

References

    1. Mindikoglu AL, Pappas SC. New Developments in Hepatorenal Syndrome. Clin Gastroenterol Hepatol. 2018;16(2):162–177. - PMC - PubMed
    1. Kim WR, Biggins SW, Kremers WK, Wiesner RH, Kamath PS, Benson JT, et al. Hyponatremia and mortality among patients on the liver-transplant waiting list. N Engl J Med. 2008;359(10):1018–26. - PMC - PubMed
    1. Malinchoc M, Kamath PS, Gordon FD, Peine CJ, Rank J, ter Borg PC. A model to predict poor survival in patients undergoing transjugular intrahepatic portosystemic shunts. Hepatology. 2000;31(4):864–71. - PubMed
    1. Francoz C, Prie D, Abdelrazek W, Moreau R, Mandot A, Belghiti J, et al. Inaccuracies of creatinine and creatinine-based equations in candidates for liver transplantation with low creatinine: impact on the model for end-stage liver disease score. Liver Transpl. 2010;16(10):1169–77. - PubMed
    1. Mindikoglu AL, Dowling TC, Weir MR, Seliger SL, Christenson RH, Magder LS. Performance of chronic kidney disease epidemiology collaboration creatinine-cystatin C equation for estimating kidney function in cirrhosis. Hepatology. 2014;59(4):1532–42. - PMC - PubMed

Publication types