Comparative Study
. 2018 Feb;50(2):229-237.
doi: 10.1038/s41588-017-0009-4. Epub 2018 Jan 1.

Multi-trait analysis of genome-wide association summary statistics using MTAG

Collaborators, Affiliations
Comparative Study

Multi-trait analysis of genome-wide association summary statistics using MTAG

Patrick Turley et al. Nat Genet. 2018 Feb.

Erratum in

Abstract

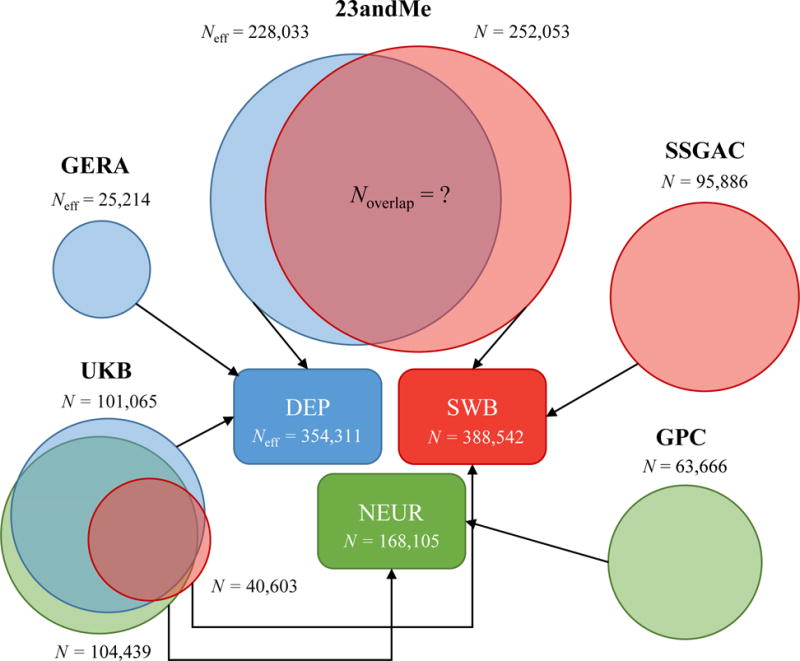
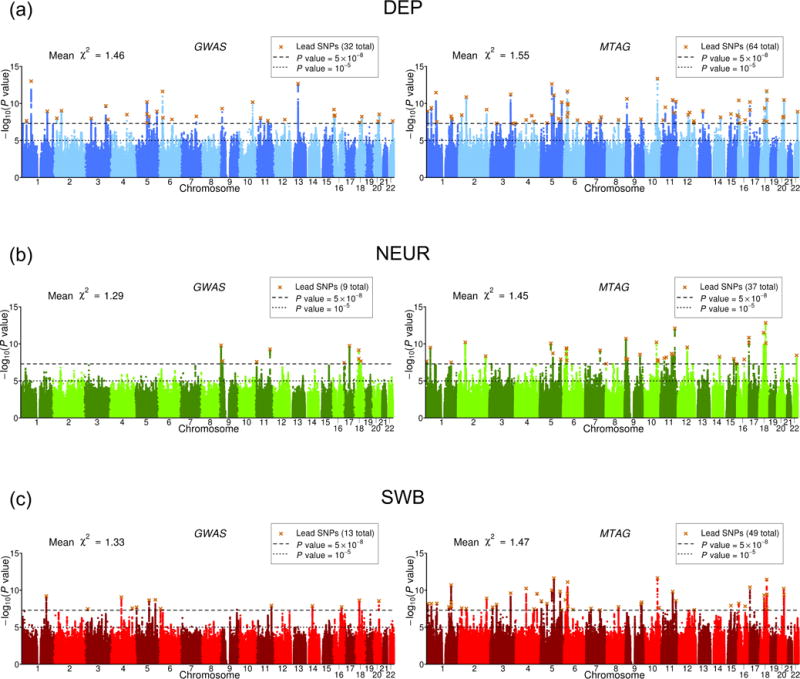
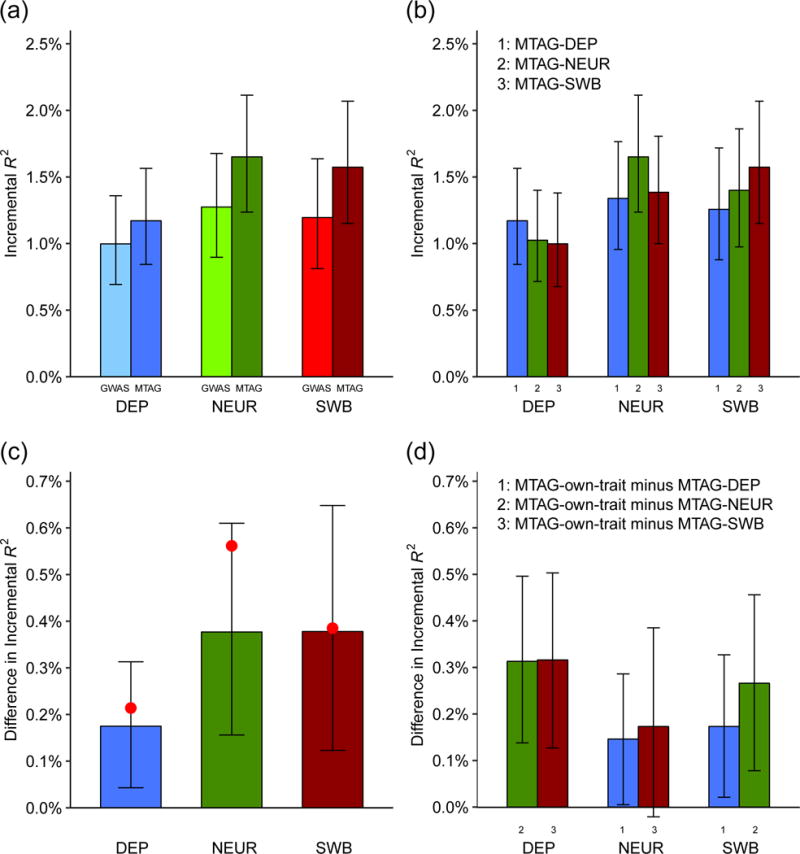
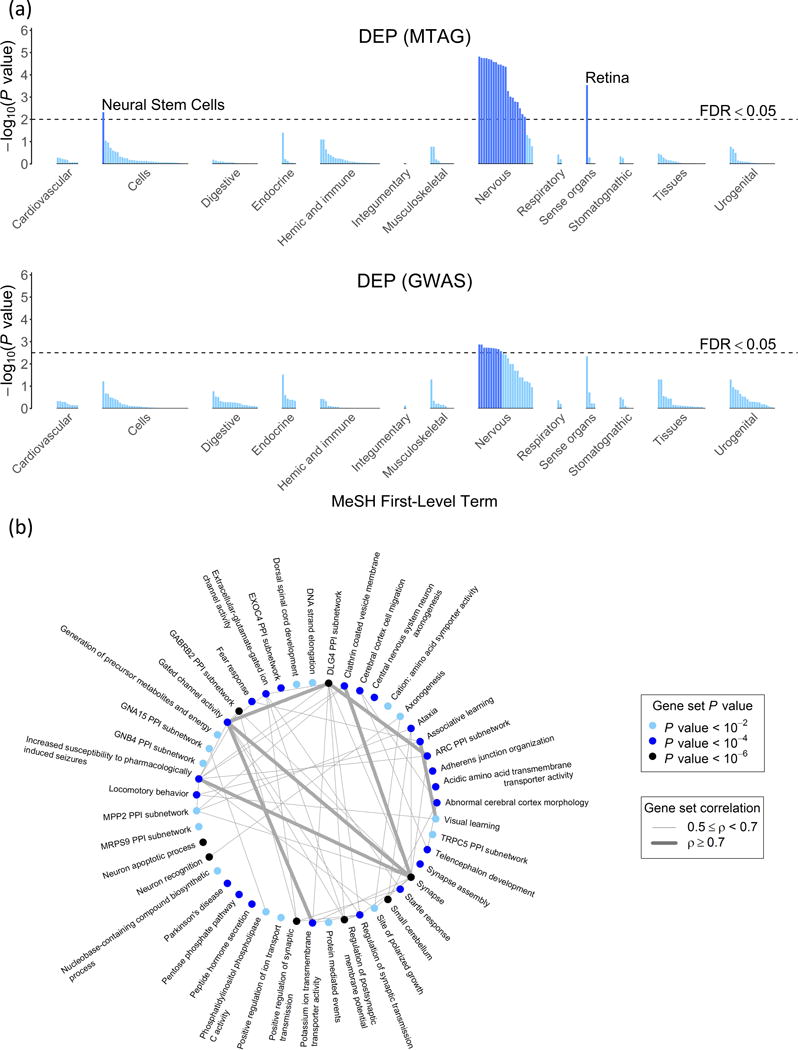
We introduce multi-trait analysis of GWAS (MTAG), a method for joint analysis of summary statistics from genome-wide association studies (GWAS) of different traits, possibly from overlapping samples. We apply MTAG to summary statistics for depressive symptoms (N eff = 354,862), neuroticism (N = 168,105), and subjective well-being (N = 388,538). As compared to the 32, 9, and 13 genome-wide significant loci identified in the single-trait GWAS (most of which are themselves novel), MTAG increases the number of associated loci to 64, 37, and 49, respectively. Moreover, association statistics from MTAG yield more informative bioinformatics analyses and increase the variance explained by polygenic scores by approximately 25%, matching theoretical expectations.


Conflict of interest statement

COMPETING FINANCIAL INTERESTS: The authors declare no competing financial interests.

Figures

Fig. 1
Fig. 1. Bias in standard errors from ignoring sampling variation in ^ and Ω^
The y-axis is the percent increase in (χ21) of the MTAG test statistics from using estimated values of and Ω rather than the true values. Each line corresponds to results from applying MTAG to identically powered single-trait GWASs of T traits. For every pair of traits, the correlation in true effect sizes is (a) rβ=0, (b) rβ=0.7. Complete results for the full set of simulation scenarios can be found in Supplementary Note.
Fig. 2
Fig. 2. Evaluation of MTAG’s standard errors when there is sample overlap
The x-axis is a SNP’s z-statistic from a baseline GWAS conducted in UK Biobank. The y-axis is a SNP’s z-statistic from applying MTAG to three GWASs of each trait conducted on equally sized subsamples of the baseline sample, in which every pair of samples has 50% overlap. (a) Height. (b) Depressive symptoms. The figure illustrates near-perfect alignment. See Supplementary Note for details and results from analogous analyses on additional phenotypes.
Fig. 3
Fig. 3. Cohorts included in GWAS meta-analyses for DEP, NEUR, and SWB
In UKB, the sample overlap in the summary statistics across the traits is known, whereas in 23andMe, the sample overlap in the summary statistics is unknown. MTAG accounts for both sources of overlap. SSGAC results, GPC results, GERA results, and 23andMe results for DEP all come from previously published work. The data from 23andMe for SWB are newly analyzed data for this paper. Data from the UKB for all three traits has been previously published, although we re-analyze it in this paper with slightly different protocols. Neff is used instead of N when the cohort has case-control data (Supplementary Note). The sample size listed for each cohort corresponds to the maximum sample size across all SNPs available for that cohort. The total sample size for each trait corresponds to the maximum sample size among the SNPs available after applying MTAG filters. For details, see Supplementary Note.
Fig. 4
Fig. 4. Manhattan plots of GWAS and MTAG results
(a) DEP, (b) NEUR, (c) SWB. The left and right plots display the GWAS and MTAG results, respectively, for a fixed set of SNPs. The x-axis is chromosomal position, and the y-axis is the significance on a − log10scale. The upper dashed line marks the threshold for genome-wide significance ( P=5×10⁸), and the lower line marks the threshold for nominal significance ( P=105). Each approximately independent genome-wide significant association (“lead SNP”) is marked by ×. The mean χ2-statistic across all SNPs included in the analysis is displayed in the top left corner of each plot.
Fig. 5
Fig. 5. Regression-based test of replicability of MTAG-identified loci
For each trait and in each of two independent replication cohorts (HRS and Add Health, combined N = 12,641), we regressed the estimated effect sizes of the MTAG-identified loci on their winner’s-curse-adjusted MTAG effect sizes. The intercept is constrained to zero in these regressions. The plotted regression coefficients are the sample-size-weighted means across the replication cohorts, with 95% intervals. See Supplementary Note for details and cohort-level results.
Fig. 6
Fig. 6. Predictive power of GWAS- and MTAG-based polygenic scores
Incremental R2 is the increase in R2 from a linear regression of the trait on the polygenic score and covariates, relative to a linear regression of the trait on only covariates. The plotted incremental R2’s (and differences in incremental R2’s) are the sample-size-weighted means across the replication cohorts (HRS and Add Health, combined N = 12,641), with 95% intervals. See Supplementary Note for details and cohort-level results. (a) Incremental R2 of MTAG-based and GWAS-based polygenic scores. (b) Incremental R2 of polygenic scores constructed from the MTAG results for the predicted trait (“own-trait score”) or MTAG results for each of the other traits (“other-trait score”). The x-axis indicates the trait being predicted, and the bar color indicates which trait’s polygenic score is used. (c) Difference in incremental R2 between the GWAS- and the MTAG-based PGS. Red dots indicate the theoretically predicted gains in prediction accuracy (Online Methods). (d) Difference in incremental R2 between own-trait scores and the mean of the incremental R2’s from the other-trait scores.
Fig. 7
Fig. 7. Biological annotation for DEP using the bioinformatics tool DEPICT
(a) Results of the tissue-enrichment analysis based on the GWAS and MTAG results. The x-axis lists the tissues tested for enrichment, grouped by the location of the tissue. The y-axis is statistical significance on a − log10 scale. The horizontal dashed line corresponds to a false discovery rate of 0.05, which is the threshold used to identify prioritized tissues. (b) Gene-set clusters as defined by the Affinity Propagation algorithm over the gene sets from the MTAG results. The algorithm names clusters after an exemplary member of the gene set. The color of the point signifies the P value of the most significant gene set in the cluster. The line thickness between the gene-set clusters corresponds to the correlation between the named gene sets for each pair of clusters.

References

    1. Galesloot TE, Van Steen K, Kiemeney LALM, Janss LL, Vermeulen SH. A comparison of multivariate genome-wide association methods. PLoS One. 2014;9:e95923. - PMC - PubMed
    1. Porter HF, O’Reilly PF. Multivariate simulation framework reveals performance of multi-trait GWAS methods. Sci Rep. 2017;7:38837. - PMC - PubMed
    1. Maier R, et al. Joint analysis of psychiatric disorders increases accuracy of risk prediction for schizophrenia, bipolar disorder, and major depressive disorder. Am J Hum Genet. 2015;96:283–94. - PMC - PubMed
    1. Hu Y, et al. Joint modeling of genetically correlated diseases and functional annotations increases accuracy of polygenic risk prediction. PLoS Genet. 2017;13:e1006836. - PMC - PubMed
    1. Baselmans BML, et al. Multivariate Genome-Wide and Integrated Transcriptome and Epigenome-Wide Analyses of the Well-being Spectrum. bioRxiv. 2017 at < http://biorxiv.org/content/early/2017/03/11/115915.abstract>.

Publication types

MeSH terms