. 2018 Jan;18 Suppl 1(Suppl 1):18-113.
doi: 10.1111/ajt.14557.

OPTN/SRTR 2016 Annual Data Report: Kidney

Affiliations

OPTN/SRTR 2016 Annual Data Report: Kidney

A Hart et al. Am J Transplant. 2018 Jan.

Abstract

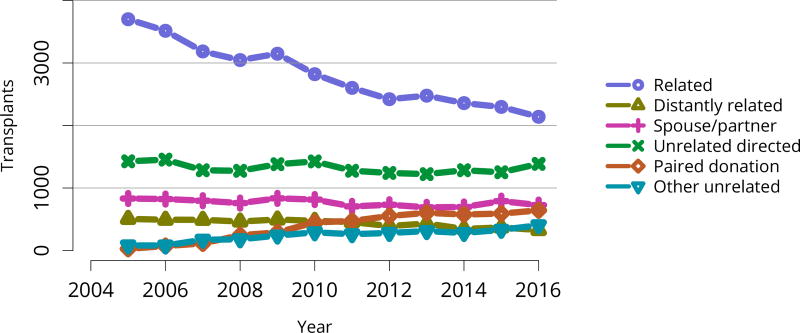
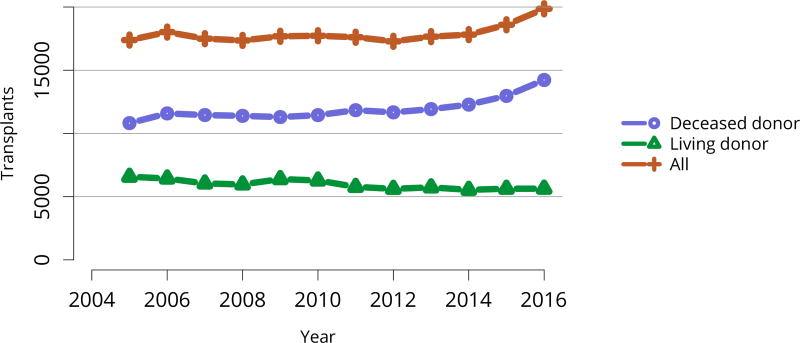
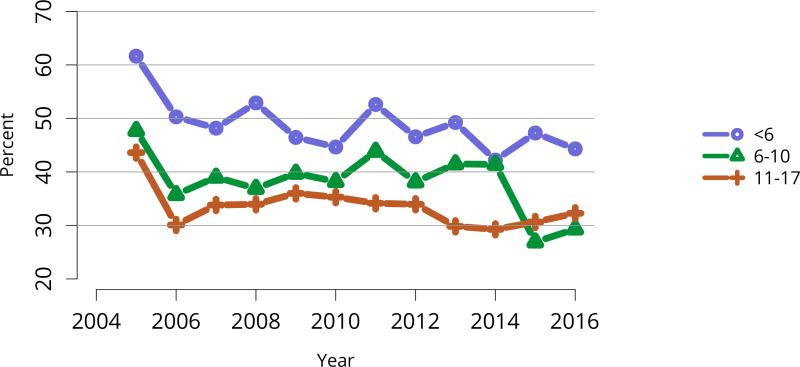
Data from 2016 show ongoing positive trends in short- and long-term allograft survival, and a decrease in the number of active listed candi- dates for the first time in more than a decade, with a concomitant in- crease in deceased donor kidney transplants. Transplant rates that had changed dramatically for some groups after implementation of the new kidney allocation system in 2014 are stabilizing, allowing for evaluation of new steady states and trends. Many challenges remain in adult kid- ney transplantation, including stagnant rates of living donor transplant, geographic disparities in access to transplant, racial disparities in living donor transplant, and overall a continuing demand for kidneys that far outpaces the supply. For pediatric recipients, a decline in the proportion of living donor transplants is of concern. In 2016, only 34.2% of pediatric transplants were from living donors, compared with 47.2% in 2005. The number of related donors decreased dramatically over the past decade, and the number of unrelated directed transplants performed in pediatric candidates remained low (50).


Figures

Figure KI 1
Figure KI 1. New adult candidates added to the kidney transplant waiting list
A new candidate is one who first joined the list during the given year, without having been listed in a previous year. Previously listed candidates who underwent transplant and subsequently relisted are considered new. Candidates concurrently listed at multiple centers are counted once. Active and inactive patients are included; active status is determined on day 7 after first listing. Includes kidney and kidney-pancreas listings.
Figure KI 2
Figure KI 2. Adults listed for kidney transplant on December 31 each year
Candidates concurrently listed at multiple centers are counted once. Those with concurrent listings and active at any program are considered active. Includes kidney and kidney-pancreas listings.
Figure KI 3
Figure KI 3. Distribution of adults waiting for kidney transplant by age
Candidates waiting for transplant at any time in the given year. Candidates listed concurrently at multiple centers are counted once. Age is determined at the later of listing date or January 1 of the given year. Active and inactive candidates are included.
Figure KI 4
Figure KI 4. Distribution of adults waiting for kidney transplant by race
Candidates waiting for transplant at any time in the given year. Candidates listed concurrently at multiple centers are counted once. Active and inactive candidates are included.
Figure KI 5
Figure KI 5. Distribution of adults waiting for kidney transplant by diagnosis
Candidates waiting for transplant at any time in the given year. Candidates listed concurrently at multiple centers are counted once. Active and inactive candidates are included. CKD, cystic kidney disease; DM, diabetes. HTN, hypertension. GN, glomerulonephritis.
Figure KI 6
Figure KI 6. Distribution of adults waiting for kidney transplant by waiting time
Candidates waiting for transplant at any time in the given year. Candidates listed concurrently at multiple centers are counted once. Time on the waiting list is determined at the earlier of December 31 or removal from the waiting list. Active and inactive candidates are included.
Figure KI 7
Figure KI 7. Distribution of adults waiting for kidney transplant by C/PRA
Candidates waiting for transplant at any time in the given year. Candidates listed concurrently at multiple centers are counted once. From December 5, 2007, through September 30, 2009, CPRA was used if greater than 0; otherwise, the maximum pretransplant PRA was used. Before December 5, 2007, the maximum pretransplant PRA was used unconditionally. CPRA is used after September 30, 2009. C/PRA is the highest value during the year. Active and inactive candidates are included.
Figure KI 8
Figure KI 8. Distribution of adults waiting for kidney transplant by time on dialysis
Candidates waiting for transplant at any time in the given year. Candidates listed concurrently at multiple centers are counted once. Time on dialysis begins at the more recent of first ESRD service date and most recent graft failure, and ends at the earlier of December 31 or removal from the waiting list. Active and inactive candidates are included.
Figure KI 9
Figure KI 9. Distribution of adults waiting for kidney transplant by willingness to accept ECD or KDPI > 85% kidney
Candidates waiting for transplant at any time in the given year. Candidates listed concurrently at multiple centers are counted once. Active and inactive candidates are included. Willingness to accept ECD at time of listing or willingness to accept a local non-zero HLA mismatch KDPI >85% kidney for at least one day during the year, beginning in 2014. ECD, expanded criteria donor.
Figure KI 10
Figure KI 10. Prevalent dialysis patients waitlisted for kidney transplant by age
Estimated percentage of prevalent dialysis patients waitlisted for kidney or kidney-pancreas transplant. Percentage calculated as the sum of point prevalent waitlist candidates divided by the sum of point prevalent dialysis patients on December 31 of each year. Dialysis data from the Consolidated Renal Operations in a Web-enabled Network (CROWN) dataset. Age calculated on December 31 of given year.
Figure KI 11
Figure KI 11. Deceased donor kidney transplant rates among active adult waitlist candidates by age
Transplant rates are computed as the number of deceased donor transplants per 100 patient-years of active wait time in a given year. Individual listings are counted separately. Age is determined at the later of listing date or January 1 of the given year. Rates with less than 10 patient-years of exposure are not shown.
Figure KI 12
Figure KI 12. Deceased donor kidney transplant rates among active adult waitlist candidates by diagnosis
Transplant rates are computed as the number of deceased donor transplants per 100 patient-years of active wait time in a given year. Individual listings are counted separately. Rates with less than 10 patient-years of exposure are not shown. GN, glomerulonephritis.
Figure KI 13
Figure KI 13. Deceased donor kidney transplant rates among active adult waitlist candidates by C/PRA
Transplant rates are computed as the number of deceased donor transplants per 100 patient-years of active wait time in a given year. Individual listings are counted separately. From December 5, 2007, through September 30, 2009, CPRA was used if greater than 0; otherwise, the maximum pretransplant PRA was used. Before December 5, 2007, the maximum pretransplant PRA was used unconditionally. CPRA is used after September 30, 2009. Rates with less than 10 patient-years of exposure are not shown.
Figure KI 14
Figure KI 14. Deceased donor kidney transplant rates among active adult waitlist candidates by blood type
Transplant rates are computed as the number of deceased donor transplants per 100 patient-years of active wait time in a given year. Individual listings are counted separately. Rates with less than 10 patient-years of exposure are not shown.
Figure KI 15
Figure KI 15. Deceased donor kidney transplant rates among active adult waitlist candidates by time on the waitlist
Transplant rates are computed as the number of deceased donor transplants per 100 patient-years of active wait time in a given year. Individual listings are counted separately. Rates with less than 10 patient-years of exposure are not shown.
Figure KI 16
Figure KI 16. Three-year outcomes for adults waiting for kidney transplant, new listings in 2013
Adults waiting for any kidney transplant and first listed in 2013. Candidates concurrently listed at more than one center are counted once, from the time of earliest listing to the time of latest removal. Removed from list includes all reasons except transplant and death. DD, deceased donor; LD, living donor.
Figure KI 17
Figure KI 17. Percentage of adults who underwent deceased donor kidney transplant within a given time period of listing
Candidates concurrently listed at more than one center are counted once, from the time of earliest listing to the time of latest removal.
Figure KI 18
Figure KI 18. Percentage of adults who underwent deceased donor kidney transplant within 5 years of listing in 2011 by DSA
Candidates listed concurrently in a single DSA are counted once in that DSA, from the time of earliest listing to the time of latest removal; candidates listed in multiple DSAs are counted separately per DSA.
Figure KI 19
Figure KI 19. Adults willing to accept a kidney designated ECD or KDPI > 85% by age
Adults waiting for kidney transplant on December 31 of the given year. Candidates concurrently listed at more than one center are counted once, from the time of earliest listing to the time of latest removal. Willingness to accept ECD at time of listing or willingness to accept a local non-zero HLA mismatch KDPI >85% kidney for at least one day during the year, beginning in 2014. ECD, expanded criteria donor.
Figure KI 20
Figure KI 20. Pretransplant mortality rates among adults waitlisted for kidney transplant by age
Mortality rates are computed as the number of deaths per 100 patient-years of waiting in the given year. Individual listings are counted separately. Rates with less than 10 patient-years of exposure are not shown. Age is determined at the later of listing date or January 1 of the given year.
Figure KI 21
Figure KI 21. Pretransplant mortality rates among adults waitlisted for kidney transplant by race
Mortality rates are computed as the number of deaths per 100 patient-years of waiting in the given year. Individual listings are counted separately. Rates with less than 10 patient-years of exposure are not shown.
Figure KI 22
Figure KI 22. Pretransplant mortality rates among adults waitlisted for kidney transplant by diagnosis
Mortality rates are computed as the number of deaths per 100 patient-years of waiting in the given year. Individual listings are counted separately. Rates with less than 10 patient-years of exposure are not shown. CKD, cystic kidney disease; DM, diabetes. HTN, hypertension. GN, glomerulonephritis.
Figure KI 23
Figure KI 23. Pretransplant mortality rates among adults waitlisted for kidney transplant in 2016, by DSA
Mortality rates are computed as the number of deaths per 100 patient-years of waiting in the given year. Patients censored at waitlist removal. Individual listings are counted separately. Rates with less than 10 patient-years of exposure are not shown.
Figure KI 24
Figure KI 24. Deaths within six months after removal among adult kidney waitlist candidates
Denominator includes only candidates removed from the waiting list for reasons other than transplant or death while on the list.
Figure KI 25
Figure KI 25. Deceased kidney donors by age
Deceased donors with at least one kidney recovered for transplant. Donors whose kidneys were recovered en-bloc are counted once, and donors whose kidneys were recovered separately are counted twice.
Figure KI 26
Figure KI 26. Deceased kidney donors by race
Deceased donors with at least one kidney recovered for transplant. Donors whose kidneys were recovered en-bloc are counted once, and donors whose kidneys were recovered separately are counted twice.
Figure KI 27
Figure KI 27. Deceased donor kidney donation rates (per 1000 deaths) by state, 2013–2015
Numerator: Deceased donors aged < 70 years, by state of death, whose kidneys were recovered for transplant from 2013 through 2015. Denominator: US deaths aged < 70 years, by state of death, from 2013 through 2015. State death data by age obtained through agreement with NAPHSIS (https://www.naphsis.org/research-requests). Donors whose kidneys were recovered en-bloc are counted once, and donors whose kidneys were recovered separately are counted twice.
Figure KI 28
Figure KI 28. Rates of kidneys recovered for transplant and not transplanted by age
Percentages of kidneys not transplanted out of all kidneys recovered for transplant. Kidneys recovered en-bloc are counted once, and kidneys recovered separately are counted twice.
Figure KI 29
Figure KI 29. Rates of kidneys recovered for transplant and not transplanted by diabetes status
Percentages of kidneys not transplanted out of all kidneys recovered for transplant. Kidneys recovered en-bloc are counted once, and kidneys recovered separately are counted twice.
Figure KI 30
Figure KI 30. Rates of kidneys recovered for transplant and not transplanted by hypertension status
Percentages of kidneys not transplanted out of all kidneys recovered for transplant. Kidneys recovered en-bloc are counted once, and kidneys recovered separately are counted twice.
Figure KI 31
Figure KI 31. Rates of kidneys recovered for transplant and not transplanted by terminal creatinine
Percentages of kidneys not transplanted out of all kidneys recovered for transplant. Kidneys recovered en-bloc are counted once, and kidneys recovered separately are counted twice.
Figure KI 32
Figure KI 32. Rates of kidneys recovered for transplant and not transplanted by biopsy status
Percentages of kidneys not transplanted out of all kidneys recovered for transplant. Kidneys recovered en-bloc are counted once, and kidneys recovered separately are counted twice.
Figure KI 33
Figure KI 33. Rates of kidneys recovered for transplant and not transplanted by cause of death
Percentages of kidneys not transplanted out of all kidneys recovered for transplant. Kidneys recovered en-bloc are counted once, and kidneys recovered separately are counted twice. CNS, central nervous system; CVA, cerebrovascular accident.
Figure KI 34
Figure KI 34. Rates of kidneys recovered for transplant and not transplanted by DCD status
Percentages of kidneys not transplanted out of all kidneys recovered for transplant. Kidneys recovered en-bloc are counted once, and kidneys recovered separately are counted twice. DBD, donation after brain death; DCD, donation after circulatory death.
Figure KI 35
Figure KI 35. Rates of kidneys recovered for transplant and not transplanted by KDPI
Percentages of kidneys not transplanted out of all kidneys recovered for transplant, by KDPI classification. The reference population for the KDRI to KDPI conversion is all deceased donor kidneys recovered for transplant in the US in 2016. Kidneys recovered en-bloc are counted once. KDPI, kidney donor profile index; KDRI, kidney donor risk index.
Figure KI 36
Figure KI 36. Donor-specific components of the kidney donor risk index
Donors with at least one transplanted kidney. The donor-specific components of the kidney donor risk index are shown, except for donor height and hepatitis C virus status. CVA, cerebrovascular accident; DCD, donation after circulatory death; SCr, serum creatinine.
Figure KI 37
Figure KI 37. Average kidney donor risk index
Kidneys recovered for transplant. Kidney donor risk index is computed using only donor-specific components.
Figure KI 38
Figure KI 38. Average kidney donor risk index by biopsy status
Kidneys recovered for transplant. Kidney donor risk index is computed using only donorspecific components, and is not converted to KDPI.
Figure KI 39
Figure KI 39. Cause of death among deceased kidney donors
Deceased donors whose kidneys were transplanted. Each donor is counted once. CNS, central nervous system; CVA, cerebrovascular accident.
Figure KI 40
Figure KI 40. Kidney transplants from living donors by donor relation
As reported on the OPTN Living Donor Registration Form.
Figure KI 41
Figure KI 41. Living kidney donors by age
As reported on the OPTN Living Donor Registration Form.
Figure KI 42
Figure KI 42. Living kidney donors by sex
As reported on the OPTN Living Donor Registration Form.
Figure KI 43
Figure KI 43. Living kidney donors by race
As reported on the OPTN Living Donor Registration Form.
Figure KI 44
Figure KI 44. Intended living kidney donor procedure type
As reported on the OPTN Living Donor Registration Form.
Figure KI 45
Figure KI 45. Rehospitalization in the first 6 weeks, 6 months, and 1 year among living kidney donors, 2011–2015
Cumulative hospital readmission. The 6-week time point is recorded at the earliest of discharge or 6 weeks after donation.
Figure KI 46
Figure KI 46. Kidney complications among living kidney donors, 2011–2015
Complications reported on the OPTN Living Donor Registration and Living Donor Follow-up Forms at each time point. Complications include readmission, re-operation, vascular complications, and other complications requiring intervention. Multiple complications may be reported at any time point.
Figure KI 47
Figure KI 47. BMI among living kidney donors
Donor height and weight reported on the OPTN Living Donor Registration Form.
Figure KI 48
Figure KI 48. Total kidney transplants
All kidney transplant recipients, including adult and pediatric, retransplant, and multi-organ recipients.
Figure KI 49
Figure KI 49. Total kidney transplants by age
All kidney transplant recipients, including adult and pediatric, retransplant, and multi-organ recipients.
Figure KI 50
Figure KI 50. Total kidney transplants by sex
All kidney transplant recipients, including adult and pediatric, retransplant, and multi-organ recipients.
Figure KI 51
Figure KI 51. Total kidney transplants by race
All kidney transplant recipients, including adult and pediatric, retransplant, and multi-organ recipients.
Figure KI 52
Figure KI 52. Total kidney transplants by diagnosis
All kidney transplant recipients, including adult and pediatric, retransplant, and multi-organ recipients. GN, glomerulonephritis; CKD, cystic kidney disease.
Figure KI 53
Figure KI 53. Kidney transplants by kidney donor profile index (KDPI)
All adult recipients of deceased donor kidneys, including multi-organ transplants. The reference population for the KDRI to KDPI conversion is all deceased donor kidneys recovered for transplant in the US in 2016. Kidneys recovered en-bloc are counted once. KDPI, kidney donor profile index; KDRI, kidney donor risk index.
Figure KI 54
Figure KI 54. Induction agent use in adult kidney transplant recipients
Immunosuppression at transplant reported to the OPTN. IL2-RA, interleukin-2 receptor antagonist.
Figure KI 55
Figure KI 55. Calcineurin inhibitor use in adult kidney transplant recipients
Immunosuppression at transplant reported to the OPTN.
Figure KI 56
Figure KI 56. Anti-metabolite use in adult kidney transplant recipients
Immunosuppression at transplant reported to the OPTN. Mycophenolate includes mycophenolate mofetil and mycophenolate sodium.
Figure KI 57
Figure KI 57. mTOR inhibitor use in adult kidney transplant recipients
Immunosuppression at transplant reported to the OPTN. One-year posttransplant data are limited to patients alive with graft function at 1 year posttransplant. mTOR, mammalian target of rapamycin.
Figure KI 58
Figure KI 58. Steroid use in adult kidney transplant recipients
Immunosuppression at transplant reported to the OPTN. One-year posttransplant data are limited to patients alive with graft function at 1 year posttransplant.
Figure KI 59
Figure KI 59. C/PRA at time of kidney transplant in adult deceased donor recipients
From December 5, 2007, through September 30, 2009, CPRA was used if greater than 0; otherwise, the maximum pretransplant PRA was used. Before December 5, 2007, the maximum pretransplant PRA was used unconditionally. CPRA is used after September 30, 2009, unless it is missing; if it is missing, the maximum pretransplant PRA is used. Kidney-alone transplants only.
Figure KI 60
Figure KI 60. C/PRA at time of kidney transplant in adult living donor recipients
From December 5, 2007, through September 30, 2009, CPRA was used if greater than 0; otherwise, the maximum pretransplant PRA was used. Before December 5, 2007, the maximum pretransplant PRA was used unconditionally. CPRA is used after September 30, 2009, unless it is missing; if it is missing, the maximum pretransplant PRA is used. Kidney-alone transplants only.
Figure KI 61
Figure KI 61. Total HLA A, B, and DR mismatches among adult kidney transplant recipients, 2012–2016
Donor and recipient antigen matching is based on OPTN antigen values and split equivalences policy as of 2016.
Figure KI 62
Figure KI 62. Annual adult kidney transplant center volumes, by percentile
Annual volume data are limited to recipients aged 18 or older.
Figure KI 63
Figure KI 63. Distribution of adult kidney transplants by percentile of center volume
Percentiles are based on annual volume data among recipients aged 18 or older.
Figure KI 64
Figure KI 64. Graft failure among adult deceased donor kidney transplant recipients
Estimates are unadjusted, computed using Kaplan-Meier competing risk methods. Recipients are followed to the earliest of kidney graft failure; kidney retransplant; return to dialysis; death; or 6 months, 1, 3, 5, or 10 years posttransplant. All-cause graft failure (GF) is defined as any of the prior outcomes prior to 6 months, 1, 3, 5, or 10 years, respectively.
Figure KI 65
Figure KI 65. Death-censored graft failure among adult deceased donor kidney transplant recipients
Estimates are unadjusted, computed using Kaplan-Meier competing risk methods. Recipients are followed to the earliest of kidney graft failure; kidney retransplant; return to dialysis; death; or 6 months, 1, 3, 5, or 10 years posttransplant. Death-censored graft failure (DCGF) is defined as a return to dialysis, reported graft failure, or kidney retransplant.
Figure KI 66
Figure KI 66. Death with function among adult deceased donor kidney transplant recipients
Estimates are unadjusted, computed using KaplanMeier competing risk methods. Recipients are followed to the earliest of kidney graft failure; kidney retransplant; return to dialysis; death; or 6 months, 1, 3, 5, or 10 years posttransplant. Death with function (DWF) is defined as death without prior graft failure, return to dialysis, or retransplant.
Figure KI 67
Figure KI 67. Graft failure among adult living donor kidney transplant recipients
Estimates are unadjusted, computed using Kaplan-Meier competing risk methods. Recipients are followed to the earliest of kidney graft failure; kidney retransplant; return to dialysis; death; or 6 months, 1, 3, 5, or 10 years posttransplant. All-cause graft failure (GF) is defined as any of the prior outcomes prior to 6 months, 1, 3, 5, or 10 years, respectively.
Figure KI 68
Figure KI 68. Death-censored graft failure among adult living donor kidney transplant recipients
Estimates are unadjusted, computed using Kaplan-Meier competing risk methods. Recipients are followed to the earliest of kidney graft failure; kidney retransplant; return to dialysis; death; or 6 months, 1, 3, 5, or 10 years posttransplant. Death-censored graft failure (DCGF) is defined as a return to dialysis, reported graft failure, or kidney retransplant.
Figure KI 69
Figure KI 69. Death with function among adult living donor kidney transplant recipients
Estimates are unadjusted, computed using Kaplan-Meier competing risk methods. Recipients are followed to the earliest of kidney graft failure; kidney retransplant; return to dialysis; death; or 6 months, 1, 3, 5, or 10 years posttransplant. Death with function (DWF) is defined as death without prior graft failure, return to dialysis, or retransplant.
Figure KI 70
Figure KI 70. Graft survival among adult deceased donor kidney transplant recipients, 2011, by diagnosis
Graft survival estimated using unadjusted Kaplan-Meier methods. CKD, cystic kidney disease; GN, glomerulonephritis.
Figure KI 71
Figure KI 71. Graft survival among adult deceased donor kidney transplant recipients, 2011, by KDPI
Graft survival estimated using unadjusted Kaplan-Meier methods. The reference population for the KDRI to KDPI conversion is all deceased donor kidneys recovered for transplant in the US in 2016. KDPI, kidney donor profile index.
Figure KI 72
Figure KI 72. Graft survival among adult deceased donor kidney transplant recipients, 2011, by DCD status
Graft survival estimated using unadjusted Kaplan-Meier methods. DCD, donation after circulatory death; DBD, donation after brain death.
Figure KI 73
Figure KI 73. Graft survival among adult deceased donor kidney transplant recipients, 2011, by biopsy status
Graft survival estimated using unadjusted Kaplan-Meier methods.
Figure KI 74
Figure KI 74. Graft survival among adult living donor kidney transplant recipients, 2011, by age
Graft survival estimated using unadjusted KaplanMeier methods.
Figure KI 75
Figure KI 75. Graft survival among adult living donor kidney transplant recipients, 2011, by race
Graft survival estimated using unadjusted KaplanMeier methods.
Figure KI 76
Figure KI 76. Graft survival among adult living donor kidney transplant recipients, 2011, by diagnosis
Graft survival estimated using unadjusted Kaplan-Meier methods. CKD, cystic kidney disease; GN, glomerulonephritis.
Figure KI 77
Figure KI 77. Distribution of eGFR at discharge among adult kidney transplant recipients
GFR (mL/min/1.73 m2) estimated using the Chronic Kidney Disease Epidemiology Collaboration equation, and computed for patients alive with graft function at discharge.
Figure KI 78
Figure KI 78. Distribution of eGFR at 6 months posttransplant among adult kidney transplant recipients
GFR (mL/min/1.73 m2) estimated using the Chronic Kidney Disease Epidemioogy Collaboration equation, and computed for patients alive with graft function at 6 months posttransplant.
Figure KI 79
Figure KI 79. Recipients alive with a functioning kidney graft on June 30 of the year, by age at transplant
Recipients are assumed to be alive with function unless a death or graft failure is recorded. A recipient may experience a graft failure and be removed from the cohort, undergo retransplant, and reenter the cohort.
Figure KI 80
Figure KI 80. Incidence of acute rejection by 1 year posttransplant among adult kidney transplant recipients by donor type
Acute rejection is defined as a record of acute or hyperacute rejection, as reported on the OPTN Transplant Recipient Registration or Transplant Recipient Follow-up Form. Only the first rejection event is counted. Cumulative incidence is estimated using the Kaplan-Meier competing risk method.
Figure KI 81
Figure KI 81. Posttransplant diabetes among adult kidney transplant recipients
Percentage of adult deceased donor kidney recipients who were nondiabetic at transplant and developed diabetes posttransplant. Posttransplant diabetes is reported on the Transplant Recipient Follow-up Form. Death and graft failure are treated as competing events.
Figure KI 82
Figure KI 82. Posttransplant diabetes within 1 year among adult kidney transplant recipients by BMI at transplant
Percentage of adult deceased donor kidney recipients who were nondiabetic at transplant and developed diabetes posttransplant. Posttransplant diabetes is reported on the Transplant Recipient Follow-up Form. Death and graft failure are treated as competing events.
Figure KI 83
Figure KI 83. Incidence of PTLD among adult kidney transplant recipients by recipient EBV status at transplant, 2010–2014
Cumulative incidence is estimated using the Kaplan-Meier competing risk method. PTLD is identified as a reported complication or cause of death on the OPTN Transplant Recipient Follow-up Form or the Posttransplant Malignancy Form as polymorphic PTLD, monomorphic PTLD, or Hodgkin disease. Only the earliest date of PTLD diagnosis is considered. EBV, Epstein-Barr virus; PTLD, posttransplant lymphoproliferative disorder.
Figure KI 84
Figure KI 84. Patient survival among adult deceased donor kidney transplant recipients, 2011, by age
Patient survival estimated using unadjusted Kaplan-Meier methods. For recipients of more than one transplant during the period, only the first is considered.
Figure KI 85
Figure KI 85. Patient survival among adult deceased donor kidney transplant recipients, 2011, by diagnosis
Patient survival estimated using unadjusted Kaplan-Meier methods. For recipients of more than one transplant during the period, only the first is considered. CKD, cystic kidney disease; GN, glomerulonephritis.
Figure KI 86
Figure KI 86. Patient survival among adult deceased donor kidney transplant recipients, 2011, by KDPI
Patient survival estimated using unadjusted Kaplan-Meier methods. For recipients of more than one transplant during the period, only the first is considered. The reference population for the KDRI to KDPI conversion is all deceased donor kidneys recovered for transplant in the US in 2016. KDPI, kidney donor profile index.
Figure KI 87
Figure KI 87. Patient survival among adult deceased donor kidney transplant recipients, 2011, by biopsy status
Patient survival estimated using unadjusted Kaplan-Meier methods. For recipients of more than one transplant during the period, only the first is considered.
Figure KI 88
Figure KI 88. Patient survival among adult living donor kidney transplant recipients, 2011, by age
Patient survival estimated using unadjusted KaplanMeier methods. For recipients of more than one transplant during the period, only the first is considered.
Figure KI 89
Figure KI 89. Patient survival among adult living donor kidney transplant recipients, 2011, by diagnosis
Patient survival estimated using unadjusted Kaplan-Meier methods. For recipients of more than one transplant during the period, only the first is considered. CKD, cystic kidney disease; GN, glomerulonephritis.
Figure KI 90
Figure KI 90. Patient survival among adult living donor kidney transplant recipients, 2011, by race
Patient survival estimated using unadjusted Kaplan-Meier methods. For recipients of more than one transplant during the period, only the first is considered.
Figure KI 91
Figure KI 91. New pediatric candidates added to the kidney transplant waiting list
A new candidate is one who first joined the list during the given year, without having been listed in a previous year. Previously listed candidates who underwent transplant and subsequently relisted are considered new. Candidates concurrently listed at multiple centers are counted once. Active and inactive patients are included. Age determined at listing.
Figure KI 92
Figure KI 92. Pediatric candidates listed for kidney transplant on December 31 each year
Candidates concurrently listed at multiple centers are counted once. Those with concurrent listings and active at any program are considered active. Active status is determined on day 7 after first listing; age determined at first listing.
Figure KI 93
Figure KI 93. Distribution of pediatric candidates waiting for kidney transplant by age
Candidates waiting for transplant at any time in the given year. Candidates listed concurrently at multiple centers are counted once. Age is determined at the later of listing date or January 1 of the given year. Active and inactive candidates are included.
Figure KI 94
Figure KI 94. Distribution of pediatric candidates waiting for kidney transplant by race
Candidates waiting for transplant any time in the given year. Candidates listed concurrently at multiple centers are counted once. Active and inactive candidates are included.
Figure KI 95
Figure KI 95. Distribution of pediatric candidates waiting for kidney transplant by diagnosis
Candidates waiting for transplant any time in the given year. Candidates listed concurrently at multiple centers are counted once. Diagnosis categories follow North American Pediatric Renal Trials and Collaborative Studies recommendations. Active and inactive candidates are included. FSGS, focal segmental glomerulosclerosis; GN, glomerulonephritis; CAKUT, congenital anomalies of the kidney and urinary tract.
Figure KI 96
Figure KI 96. Distribution of pediatric candidates waiting for kidney transplant by waiting time
Candidates waiting for transplant any time in the given year. Candidates listed concurrently at multiple centers are counted once. Time on the waiting list is determined at the earlier of December 31 or removal from the waiting list. Active and inactive candidates are included.
Figure KI 97
Figure KI 97. Distribution of pediatric candidates waiting for kidney transplant by C/PRA
Candidates waiting for transplant at any time in the given year. Candidates listed concurrently at multiple centers are counted once. From December 5, 2007, through September 30, 2009, CPRA was used if greater than 0; otherwise, the maximum pretransplant PRA was used. Before December 5, 2007, the maximum pretransplant PRA was used unconditionally. CPRA is used after September 30, 2009. C/PRA is the highest value during the year. Active and inactive candidates are included.
Figure KI 98
Figure KI 98. Primary cause of ESRD in pediatric candidates waiting for kidney transplant by age, 2011–2015
Candidates who joined the list 2011–2015. Candidates concurrently listed at more than one center are counted once. Patients who were listed, underwent transplant, and were relisted during the time period are counted more than once. Age is computed at earliest listing date. FSGS, focal segmental glomerulosclerosis; GN, glomerulonephritis; CAKUT, congenital anomalies of the kidney and urinary tract.
Figure KI 99
Figure KI 99. Three-year outcomes for newly listed pediatric candidates waiting for kidney transplant, 2013
Pediatric candidates who joined the waitlist in 2013. Candidates concurrently listed at more than one center are counted once, from the time of earliest listing to the time of latest removal. DD, deceased donor; LD, living donor.
Figure KI 100
Figure KI 100. Deceased donor kidney transplant rates among active pediatric waitlist candidates by age
Transplant rates are computed as the number of deceased donor transplants per 100 patient-years of active waiting in a given year. Individual listings are counted separately. Age is determined at the later of listing date or January 1 of the given year. Rates with less than 10 patient-years of exposure are not shown. The age category 18 years or older includes candidates listed when pediatrics but still on the list in the given year.
Figure KI 101
Figure KI 101. Deceased donor kidney transplant rates among active pediatric waitlist candidates by C/PRA
Transplant rates are computed as the number of deceased donor transplants per 100 patient-years of active waiting in a given year. Individual listings are counted separately. Rates with less than 10 patient-years of exposure are not shown.
Figure KI 102
Figure KI 102. Pretransplant mortality rates among pediatrics waitlisted for kidney transplant by age
Mortality rates are computed as the number of deaths per 100 patient-years of waiting in the given year. Individual listings are counted separately. Age is determined at the later of listing date or January 1 of the given year. Rates with less than 10 patient-years of exposure are not shown.
Figure KI 103
Figure KI 103. Pediatric kidney transplants by donor type
All pediatric kidney transplant recipients, including retransplant, and multi-organ recipients.
Figure KI 104
Figure KI 104. Pediatric kidney transplants from living donors by relation
Relationship of living donor to recipient is as indicated on the OPTN Living Donor Registration Form.
Figure KI 105
Figure KI 105. Percent of pediatric kidney transplants from living donors by recipient age
All pediatric living kidney transplant recipients, including retransplant, and multi-organ recipients.
Figure KI 106
Figure KI 106. Number of centers performing pediatric and adult kidney transplants by center’s age mix
Adult centers transplanted only recipients aged 18 years or older. Functionally adult centers transplant 80% adults or more, and the remainder were children aged 15–17 years. Mixed included adults and children of any age groups. Child only centers transplanted recipeints aged 0–17 years, and small number of adults up to age 21 years.
Figure KI 107
Figure KI 107. Pediatric kidney recipients at programs that perform 5 or fewer pediatric transplants annually
Age groups are cumulative.
Figure KI 108
Figure KI 108. Induction agent use in pediatric kidney transplant recipients
Immunosuppression at transplant reported to the OPTN. IL2-RA, interleukin-2 receptor antagonist.
Figure KI 109
Figure KI 109. Calcineurin inhibitor use in pediatric kidney transplant recipients
Immunosuppression at transplant reported to the OPTN.
Figure KI 110
Figure KI 110. Anti-metabolite use in pediatric kidney transplant recipients
Immunosuppression at transplant reported to the OPTN. Mycophenolate includes mycophenolate mofetil and mycophenolate sodium.
Figure KI 111
Figure KI 111. mTOR inhibitor use in pediatric kidney transplant recipients
Immunosuppression at transplant reported to the OPTN. One-year posttransplant data are limited to patients alive with graft function at 1 year posttransplant. mTOR, mammalian target of rapamycin.
Figure KI 112
Figure KI 112. Steroid use in pediatric kidney transplant recipients
Immunosuppression at transplant reported to the OPTN. One-year posttransplant data are limited to patients alive with graft function at 1 year posttransplant.
Figure KI 113
Figure KI 113. Induction use by C/PRA among pediatric kidney transplant recipients, 2012–2016
IL2-RA, interleukin-2 receptor antagonist.
Figure KI 114
Figure KI 114. Total HLA A, B, and DR mismatches among pediatric kidney transplant recipients, 2012–2016
Donor and recipient antigen matching is based on OPTN antigen values and split equivalences policy as of 2016.
Figure KI 115
Figure KI 115. Distribution of eGFR at discharge among pediatric kidneyalone transplant recipients
GFR (mL/min/1.73 m2) estimated using the bedside Schwartz equation, and computed for patients alive with graft function at discharge. Equation: eGFR = 0.413*Height(cm)/Creatinine (mg/dL).
Figure KI 116
Figure KI 116. Distribution of eGFR at 12 months posttransplant among pediatric kidney-alone transplant recipients
GFR (mL/min/1.73 m2) estimated using the bedside Schwartz equation, and computed for patients alive with graft function at 12 months posttransplant. Equation: eGFR = 0.413*Height(cm)/Creatinine (mg/dL).
Figure KI 117
Figure KI 117. Graft failure among pediatric deceased donor kidney-alone transplant recipients
Estimates are unadjusted, computed using KaplanMeier competing risk methods. Recipients are followed to the earliest of kidney graft failure; kidney retransplant; return to dialysis; death; or 6 months, 1, 3, 5, or 10 years posttransplant. All-cause graft failure (GF) is defined as any of the prior outcomes prior to 6 months, 1, 3, 5, or 10 years, respectively.
Figure KI 118
Figure KI 118. Death-censored graft failure among pediatric deceased donor kidney-alone transplant recipients
Estimates are unadjusted, computed using Kaplan-Meier competing risk methods. Recipients are followed to the earliest of kidney graft failure; kidney retransplant; return to dialysis; death; or 6 months, 1, 3, 5, or 10 years posttransplant. Death-censored graft failure (DCGF) is defined as a return to dialysis, reported graft failure, or kidney retransplant.
Figure KI 119
Figure KI 119. Death with function among pediatric deceased donor kidney-alone transplant recipients
Estimates are unadjusted, computed using Kaplan-Meier competing risk methods. Recipients are followed to the earliest of kidney graft failure; kidney retransplant; return to dialysis; death; or 6 months, 1, 3, 5, or 10 years posttransplant. Death with function (DWF) is defined as death without prior graft failure, return to dialysis, or retransplant.
Figure KI 120
Figure KI 120. Graft failure among pediatric living donor kidney-alone transplant recipients
Estimates are unadjusted, computed using KaplanMeier competing risk methods. Recipients are followed to the earliest of kidney graft failure; kidney retransplant; return to dialysis; death; or 6 months, 1, 3, 5, or 10 years posttransplant. All-cause graft failure (GF) is defined as any of the prior outcomes prior to 6 months, 1, 3, 5, or 10 years, respectively.
Figure KI 121
Figure KI 121. Death-censored graft failure among pediatric living donor kidney-alone transplant recipients
Estimates are unadjusted, computed using Kaplan-Meier competing risk methods. Recipients are followed to the earliest of kidney graft failure; kidney retransplant; return to dialysis; death; or 6 months, 1, 3, 5, or 10 years posttransplant. Death-censored graft failure (DCGF) is defined as a return to dialysis, reported graft failure, or kidney retransplant.
Figure KI 122
Figure KI 122. Death with function among pediatric living donor kidneyalone transplant recipients
Estimates are unadjusted, computed using Kaplan-Meier competing risk methods. Recipients are followed to the earliest of kidney graft failure; kidney retransplant; return to dialysis; death; or 6 months, 1, 3, 5, or 10 years posttransplant. Death with function (DWF) is defined as death without prior graft failure, return to dialysis, or retransplant.
Figure KI 123
Figure KI 123. Graft survival among pediatric kidney transplant recipients by age and donor type, 2007–2011
Graft survival estimated using unadjusted Kaplan-Meier methods. DD, deceased donor; LD, living donor.
Figure KI 124
Figure KI 124. Incidence of acute rejection by 1 year posttransplant among pediatric kidney transplant recipients by age
Acute rejection is defined as a record of acute or hyperacute rejection, as reported on the OPTN Transplant Recipient Registration Form or Transplant Recipient Followup Form. Only the first rejection event is counted. Cumulative incidence is estimated using the Kaplan-Meier competing risk method.
Figure KI 125
Figure KI 125. Incidence of PTLD among pediatric kidney transplant recipients by recipient EBV status at transplant, 2004–2014
Cumulative incidence is estimated using the Kaplan-Meier competing risk method. Posttransplant lymphoproliferative disorder (PTLD) is identified as a reported complication or cause of death on the OPTN Transplant Recipient Follow-up Form or on the Posttransplant Malignancy Form as polymorphic PTLD, monomorphic PTLD, or Hodgkin disease. Only the earliest date of PTLD diagnosis is considered. EBV, Epstein-Barr virus.
Figure KI 126
Figure KI 126. Patient survival among pediatric kidney transplant recipients, 2007–2011, by age and donor type
Recipient survival estimated using unadjusted Kaplan-Meier methods. DD, deceased donor; LD, living donor.

Publication types