Comparative Study
. 2018 Jan;83(1):166-177.
doi: 10.1002/ana.25131.

Autoimmune encephalitis epidemiology and a comparison to infectious encephalitis

Affiliations
Comparative Study

Autoimmune encephalitis epidemiology and a comparison to infectious encephalitis

Divyanshu Dubey et al. Ann Neurol. 2018 Jan.

Abstract

Objective: To evaluate the incidence and prevalence of autoimmune encephalitis and compare it to that of infectious encephalitis.

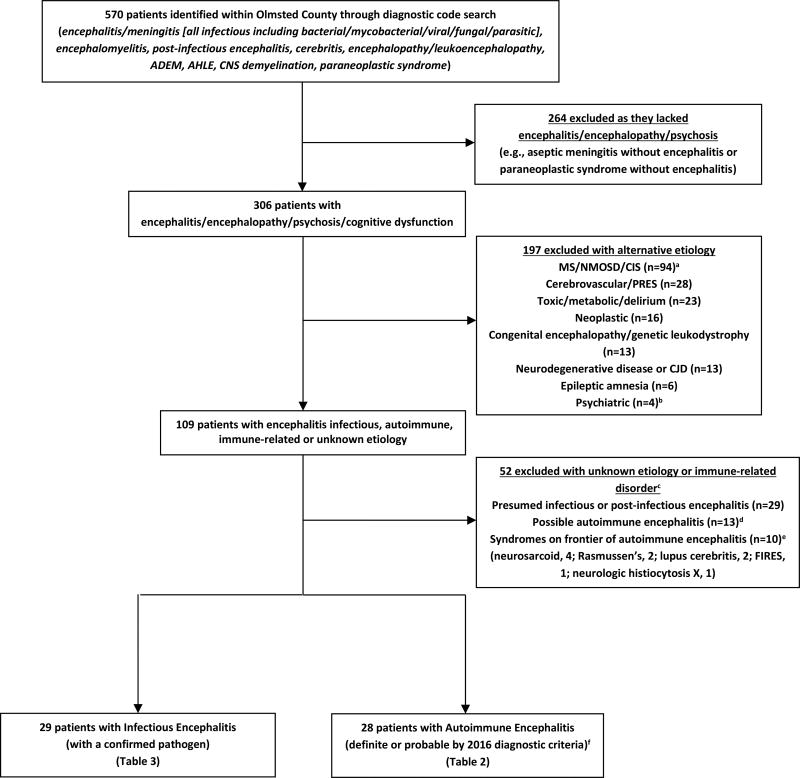
Methods: We performed a population-based comparative study of the incidence and prevalence of autoimmune and infectious encephalitis in Olmsted County, Minnesota. Autoimmune encephalitis diagnosis and subgroups were defined by 2016 diagnostic criteria, and infectious encephalitis diagnosis required a confirmed infectious pathogen. Age- and sex-adjusted prevalence and incidence rates were calculated. Patients with encephalitis of uncertain etiology were excluded.

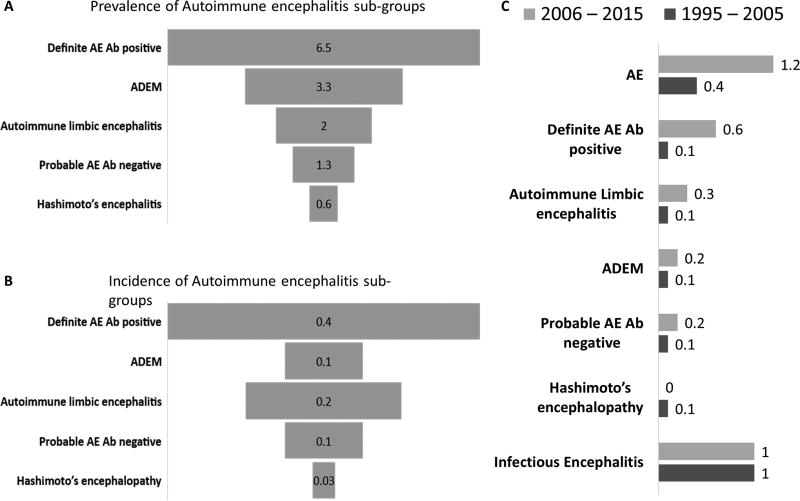
Results: The prevalence of autoimmune encephalitis on January 1, 2014 of 13.7/100,000 was not significantly different from that of all infectious encephalitides (11.6/100,000; p = 0.63) or the viral subcategory (8.3/100,000; p = 0.17). The incidence rates (1995-2015) of autoimmune and infectious encephalitis were 0.8/100,000 and 1.0/100,000 person-years, respectively (p = 0.58). The number of relapses or recurrent hospitalizations was higher for autoimmune than infectious encephalitis (p = 0.03). The incidence of autoimmune encephalitis increased over time from 0.4/100,000 person-years (1995-2005) to 1.2/100,000 person-years (2006-2015; p = 0.02), attributable to increased detection of autoantibody-positive cases. The incidence (2.8 vs 0.7/100,000 person-years, p = 0.01) and prevalence (38.3 vs 13.7/100,000, p = 0.04) of autoimmune encephalitis was higher among African Americans than Caucasians. The prevalence of specific neural autoantibodies was as follows: myelin oligodendrocyte glycoprotein, 1.9/100,000; glutamic acid decarboxylase 65, 1.9/100,000; unclassified neural autoantibody, 1.4/100,000; leucine-rich glioma-inactivated protein 1, 0.7/100,000; collapsin response-mediator protein 5, 0.7/100,000; N-methyl-D-aspartate receptor, 0.6/100,000; antineuronal nuclear antibody type 2, 0.6/100,000; and glial fibrillary acidic protein α, 0.6/100,000.

Interpretation: This study shows that the prevalence and incidence of autoimmune encephalitis are comparable to infectious encephalitis, and its detection is increasing over time. Ann Neurol 2018;83:166-177.


Conflict of interest statement

Potential conflicts of interest

No authors had conflicts of interests relevant to this study.

Figures

Figure 1
Figure 1. Flowsheet of patient identification, inclusion and exclusion
Key: ADEM, Acute Disseminated Encephalomyelitis; AHLE, Acute hemorrhagic leukoencephalitis; CIS, Clinically Isolated Syndrome of CNS demyelination; CJD, Creutzfeldt-Jakob Disease; CNS, central nervous system; FIRES, Febrile Infection-Related Epilepsy Syndrome; MS, multiple sclerosis; NMOSD, neuromyelitis optica spectrum disorder; PRES, posterior reversible encephalopathy syndrome; aPatients with MS, NMOSD (AQP4-IgG seropositive or seronegative) or CIS not meeting criteria for ADEM bone patient had psychosis with a positive serum NMDA receptor autoantibody but negative CSF NMDA-R autoantibody and resolved with anti-psychotics alone and was excluded cTwenty-five of these patients were tested for neural antibodies and 4 seropositive including voltage gated potassium channel complex autoantibody negative for LGI1 and CASPR2 subtyping, 2 (0.17 nmol/L and 0.48 nmol/L [normal, ≤0.02]); ganglionic acetylcholine receptor autoantibody, 1 (0.06 nmol/L [normal, ≤0.02]); and glutamic acid decarboxylase 65 autoantibody, 1 (0.06 nmol/L [normal, ≤0.02]) dby 2016 autoimmune encephalitis diagnostic criteria who did not meet criteria for definite or probable autoimmune encephalitis eThese disorders are considered immune related disorders by the 2016 diagnostic criteria and categorized as such here fMeeting one of the subcategories: definite autoimmune encephalitis, autoantibody-defined disease (e.g., antibodies against intracellular antigens, synaptic receptors, ion channels or other cell surface proteins that strongly associate with autoimmune encephalitis); definite autoimmune limbic encephalitis; definite acute disseminated encephalomyelitis (ADEM); autoimmune NMDA-receptor encephalitis (probable and definite); Bickerstaff’s brainstem encephalitis (probable and definite); Hashimoto encephalopathy; and “autoantibody-negative but probable” autoimmune encephalitis.
Figure 2
Figure 2. (A–C): Prevalence and incidence of autoimmune encephalitis sub-groups and incidence trends of encephalitis etiologies over the last two decades
Prevalence (per 100,000 population) of autoimmune encephalitis sub-groups (A). Incidence (per 100,000 person-years) of autoimmune encephalitis sub-groups (B). Trends in incident rates per 100,000 person-years) of autoimmune encephalitis, definite autoimmune encephalitis (with CNS specific antibodies), autoimmune limbic encephalitis, ADEM, probable autoimmune encephalitis, Hashimoto’s encephalitis and infectious encephalitis (1995–2005 and 2006–2015) (C). Key: Ab, antibody; AE: autoimmune encephalitis; ADEM, Acute disseminated encephalo-myelitis
Figure 3
Figure 3. Depicting of MRI brain of autoimmune (A–D) and infectious (E–H) encephalitis cases
Poorly demarcated diffuse FLAIR hyperintensities involving left putamen, thalamus, white matter and juxta-cortical regions in acute disseminated encephalomyelitis (A); peri-ventricular radial enhancement consistent with glial fibrillary acidic protein IgG associated encephalitis (B); bilateral mesial temporal lobe FLAIR hyperintensities in an antibody negative patient (C); and α-amino-3-hydroxy-5-methyl-4-isoxazole propionic acid (AMPA) receptor encephalitis patient (D); bilateral (left>right) anterior temporal lobe FLAIR hyperintensity in a case of herpes simplex virus-1 encephalitis (E); bilateral medial temporal lobe FLAIR hyperintensity in a case of human herpes-6 virus encephalitis (F); multifocal FLAIR hyperintensities with mass effect and right-ward midline shift in a case of disseminated aspergillosis (G); and multifocal ring-like enhancement on T1- post-gadolinium sequence in a case of toxoplasmosis (H).

Comment in

References

    1. Vora NM, Holman RC, Mehal JM, Steiner CA, Blanton J, Sejvar J. Burden of encephalitis-associated hospitalizations in the United States, 1998–2010. Neurology. 2014;82(5):443–451. - PubMed
    1. George BP, Schneider EB, Venkatesan A. Encephalitis hospitalization rates and inpatient mortality in the United States, 2000–2010. PLoS One. 2014;9(9):e104169. - PMC - PubMed
    1. Granerod J, Crowcroft NS. The epidemiology of acute encephalitis. Neuropsychol Rehabil. 2007;17(4–5):406–428. - PubMed
    1. Parpia AS, Li Y, Chen C, Dhar B, Crowcroft NS. Encephalitis, Ontario, Canada, 2002–2013. Emerg Infect Dis. 2016;22(3):426–432. - PMC - PubMed
    1. Dalmau J, Gleichman AJ, Hughes EG, et al. Anti-NMDA-receptor encephalitis: case series and analysis of the effects of antibodies. Lancet Neurol. 2008;7(12):1091–1098. - PMC - PubMed

Publication types

MeSH terms

Supplementary concepts