. 2018 Jan 2;14(1):e1005889.
doi: 10.1371/journal.pcbi.1005889. eCollection 2018 Jan.

Improving pairwise comparison of protein sequences with domain co-occurrence

Affiliations

Improving pairwise comparison of protein sequences with domain co-occurrence

Christophe Menichelli et al. PLoS Comput Biol. .

Abstract

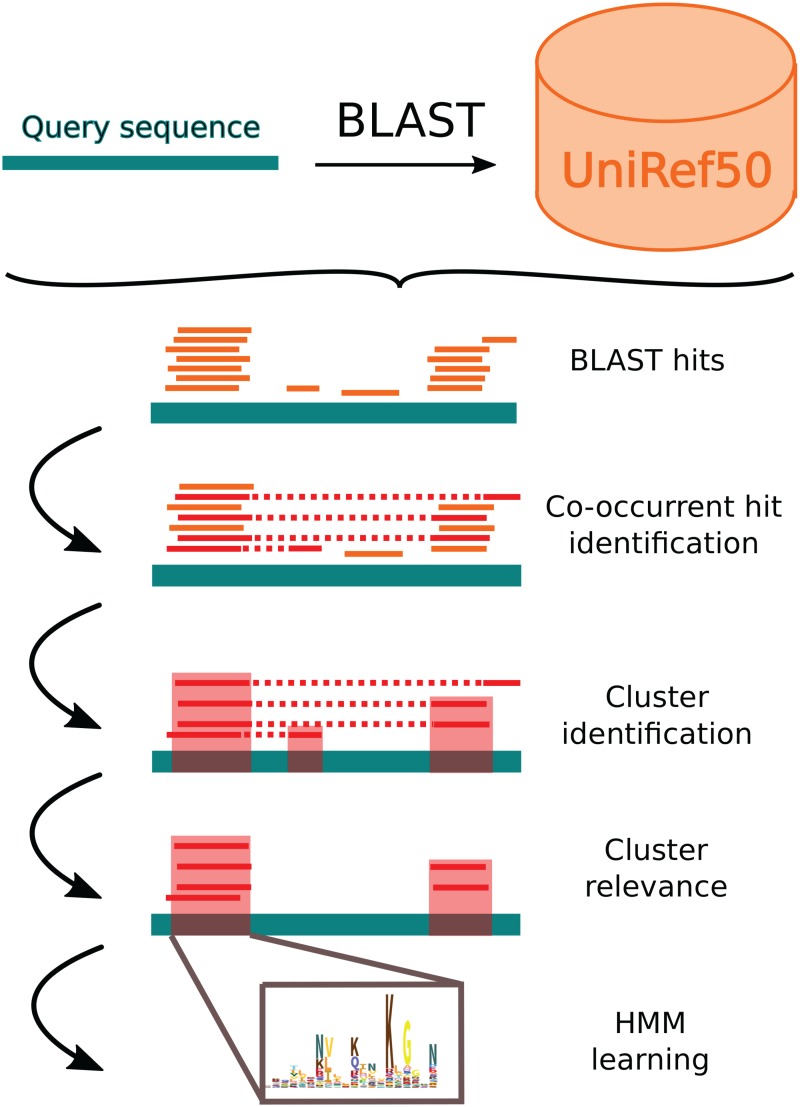
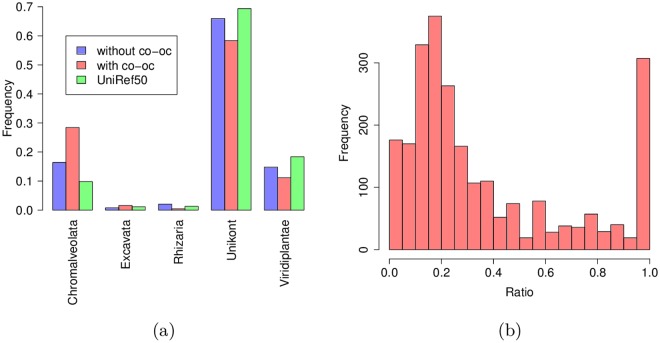
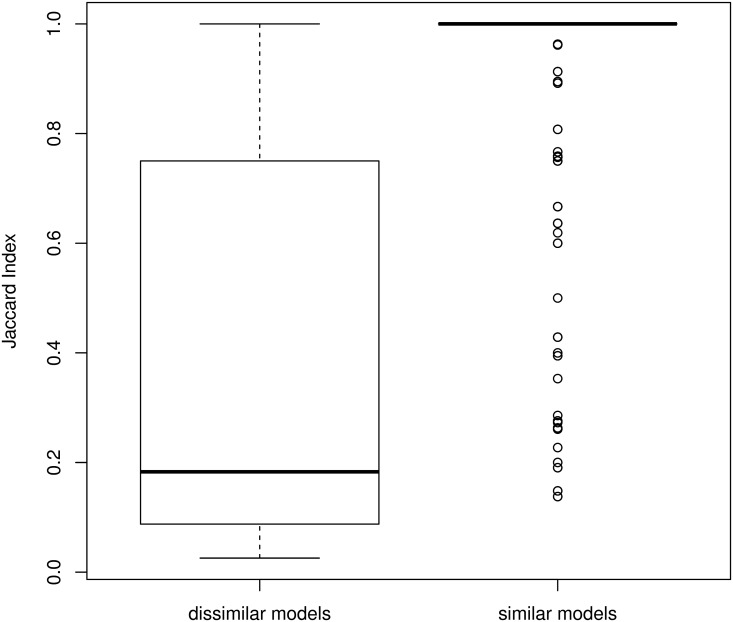
Comparing and aligning protein sequences is an essential task in bioinformatics. More specifically, local alignment tools like BLAST are widely used for identifying conserved protein sub-sequences, which likely correspond to protein domains or functional motifs. However, to limit the number of false positives, these tools are used with stringent sequence-similarity thresholds and hence can miss several hits, especially for species that are phylogenetically distant from reference organisms. A solution to this problem is then to integrate additional contextual information to the procedure. Here, we propose to use domain co-occurrence to increase the sensitivity of pairwise sequence comparisons. Domain co-occurrence is a strong feature of proteins, since most protein domains tend to appear with a limited number of other domains on the same protein. We propose a method to take this information into account in a typical BLAST analysis and to construct new domain families on the basis of these results. We used Plasmodium falciparum as a case study to evaluate our method. The experimental findings showed an increase of 14% of the number of significant BLAST hits and an increase of 25% of the proteome area that can be covered with a domain. Our method identified 2240 new domains for which, in most cases, no model of the Pfam database could be linked. Moreover, our study of the quality of the new domains in terms of alignment and physicochemical properties show that they are close to that of standard Pfam domains. Source code of the proposed approach and supplementary data are available at: https://gite.lirmm.fr/menichelli/pairwise-comparison-with-cooccurrence.


Conflict of interest statement

The authors have declared that no competing interests exist.

Figures

Fig 1
Fig 1. Extract of BLAST results on query sequence Q8IKH9_PLAF7 on UniRef50 (fields: query id, subject id, % identity, alignment length, mismatches, gap opens, q. start, q. end, s. start, s. end, e-value, bit score).
Note that some hits are hidden for clarity. Depending on the target protein, the BLAST result reveals the co-occurrence of two/three independent sub-sequences (each sub-sequence is highlighted with a different color).
Fig 2
Fig 2. Flowchart of the main steps of the procedure.
Fig 3
Fig 3. Density of BLAST hits per residue on the sequence CDAT_PLAF7.
The blue line represents the density obtained using all hits. The red line represents the density obtained using only hits that have a co-occurring hit on the same protein. The filled regions in red show hit clusters identified by our method. Lines under the horizontal axis indicate positions of clusters (domain boundaries) identified by our procedure on this protein. In this example, regions already covered by a Pfam domain were masked (green regions) so that no hits were identified by BLAST.
Fig 4
Fig 4. HMM/HMM comparison of domains identified by our approach that overlap a known Pfam domain.
The x-axis shows the overlap ratio of the local alignment; the y-axis indicates the negative log of the alignment p-value; the blue line denotes the 10−10 p-value, while the red line denotes the 80% overlap.
Fig 5
Fig 5. Number of domains and FDR obtained with different e-value and p-value cutoffs.
This figure reports the FDRs estimated by the methods that use reverse sequences (a) and 4-mer shuffling (b).
Fig 6
Fig 6
(a) Hit distribution among the five eukaryotic super-groups defined in Keeling et al. [25]. In green, the distribution in UniRef50 (restricted to eukaryotic sequences); in blue the distribution of all BLAST hits; in red the distribution of hits selected by co-occurrence. (b) Distribution of the proportion of Chromalveolate hits in the new families.
Fig 7
Fig 7. Quality scores measured on models obtained without co-occurrence (in blue), models obtained with co-occurrence (in red) and Pfam models (in green).
(a) Homogeneity; (b) Entropy; (c) Hydrophobicity; (d) Complexity.
Fig 8
Fig 8. HMM/HMM comparison of new domain families and Pfam domain families.
In Figures (a), (b) and (d), each point is associated with one particular HMM and corresponds to the best alignment found between this and all other HMMs. The x-axis shows the overlap ratio of the local alignment between the two HMMs; the y-axis indicates the negative log. of the alignment p-value; blue line corresponds to y = −log(10−10); while the red line corresponds to x = 0.8. (a) Pfam vs. Pfam comparison; (b) New families vs. Pfam comparison. Figure (c) shows the lengths of the models obtained by our approach (red), the lengths of all Pfam models (green), the lengths of the Pfam models associated with the points depicted in the top left quarter of figure (b) (blue), the length of the smallest Pfam model associated with the points depicted in the top left quarter of figure (a) (yellow).
Fig 9
Fig 9. Distances (numbers of amino-acids) between adjacent domains.
Red: distances between BLAST hits of newly identified domains and the closest annotated Pfam domain in P. falciparum proteins (only proteins with annotated Pfam domains were used in this analysis). Yellow: distances between BLAST hits and the same Pfam domain (if any) in the associated Uniref50 proteins. Blue: distances between adjacent Pfam domains in S. cerevisiae.
Fig 10
Fig 10
Quality scores (a-d) measured on families obtained by our approach (in red), ProDom families (in yellow), Pfam-B families (in cyan) and Pfam-A families (in green). (a) Homogeneity; (b) Entropy; (c) Hydrophobicity; (d) Complexity. Figure (e) shows the number of sequences in the families of the different databases.
Fig 11
Fig 11. HMM/HMM comparison of new domain families vs. Pfam-B domain families.
Each point is associated with one of our HMMs and corresponds to the best alignment found between this HMM and all Pfam-B HMMs. The x-axis shows the overlap ratio of the local alignment between the two HMMs; the y-axis indicates the negative log. of the alignment p-value; blue line corresponds to y = −log(10−10); while the red line corresponds to x = 0.8.
Fig 12
Fig 12. Similarity between GO annotations associated with domain families.
Left: annotation similarity between dissimilar domain families. Right: annotation similarity between domain families identified as similar in Fig 8(d).

References

    1. Zmasek CM, Godzik A. Strong functional patterns in the evolution of eukaryotic genomes revealed by the reconstruction of ancestral protein domain repertoires. Genome Biology. 2011;12(1):R4 doi: 10.1186/gb-2011-12-1-r4 - DOI - PMC - PubMed
    1. Bornberg-Bauer E, Albà MM. Dynamics and adaptive benefits of modular protein evolution. Current Opinion in Structural Biology. 2013;23(3):459–466. doi: 10.1016/j.sbi.2013.02.012 - DOI - PubMed
    1. Finn RD, Coggill P, Eberhardt RY, Eddy SR, Mistry J, Mitchell AL, et al. The Pfam protein families database: towards a more sustainable future. Nucleic Acids Research. 2016;44(D1):D279–D285. doi: 10.1093/nar/gkv1344 - DOI - PMC - PubMed
    1. Durbin R, Eddy S, Krogh A, Mitchison G. Biological sequence analysis probabilistic models of proteins and nucleic acids. Cambridge University Press; 1998.
    1. Terrapon N, Gascuel O, Maréchal E, Bréhélin L. Detection of new protein domains using co-occurrence: application to Plasmodium falciparum. Bioinformatics. 2009;25(23):3077–3083. doi: 10.1093/bioinformatics/btp560 - DOI - PubMed

Publication types

MeSH terms