. 2018 Jan 2;13(1):e0187789.
doi: 10.1371/journal.pone.0187789. eCollection 2018.

PARP10 (ARTD10) modulates mitochondrial function

Affiliations

PARP10 (ARTD10) modulates mitochondrial function

Judit Márton et al. PLoS One. .

Abstract

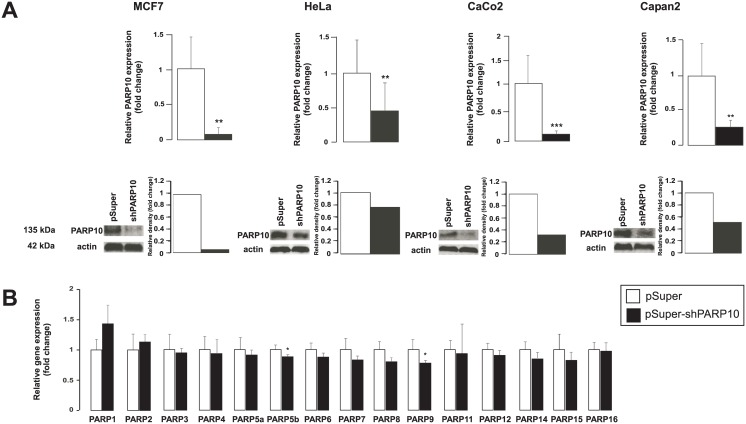
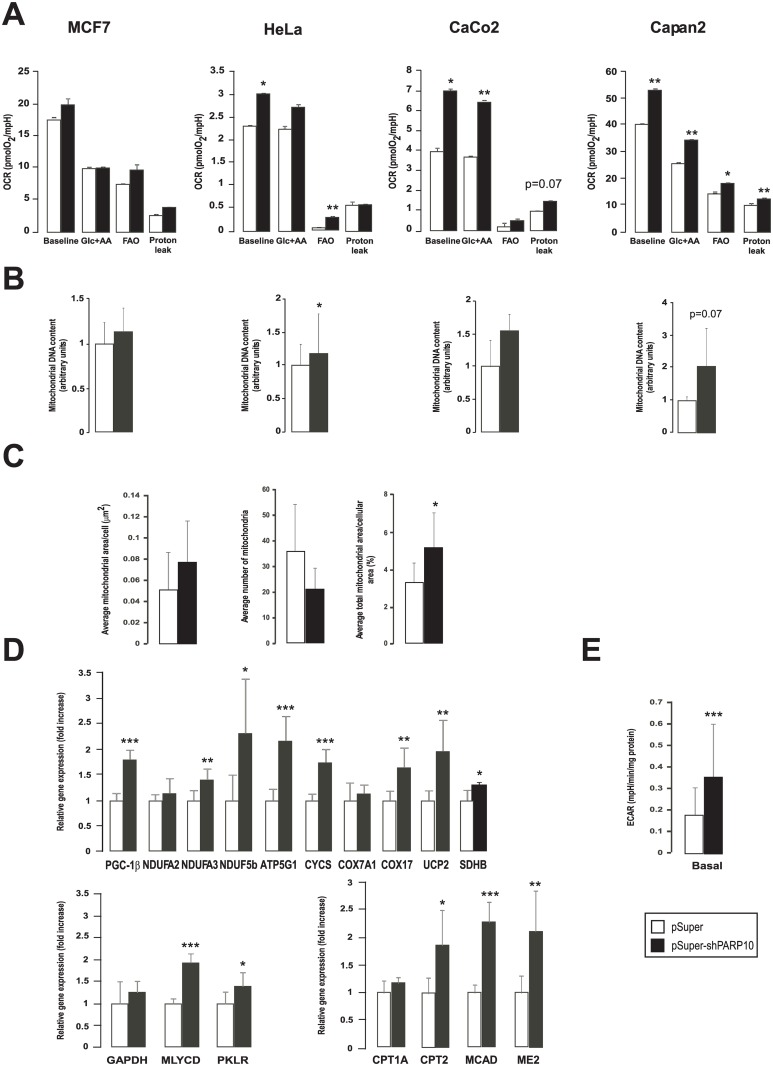
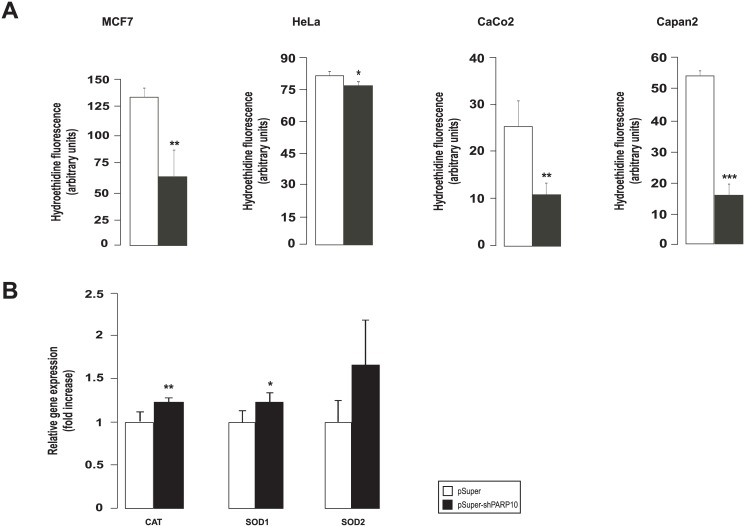
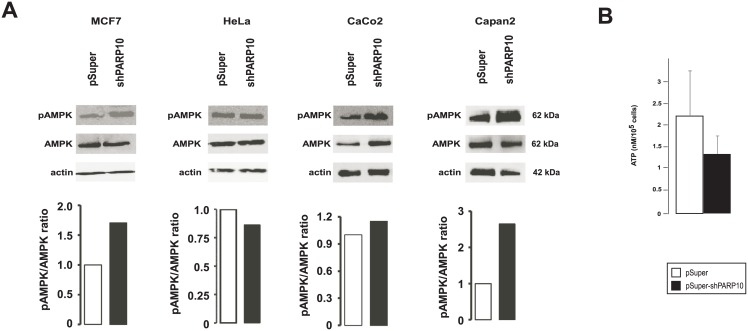
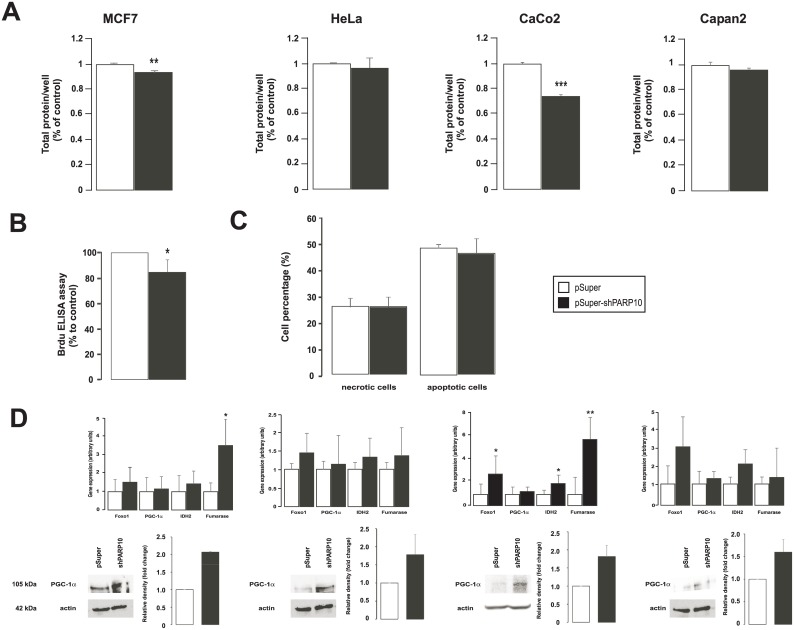
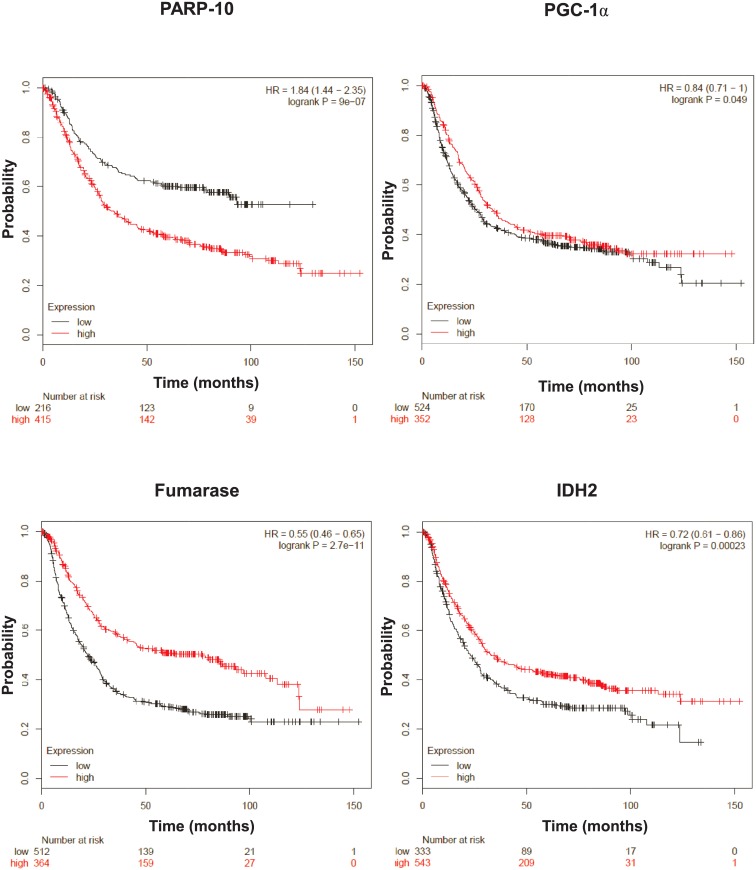
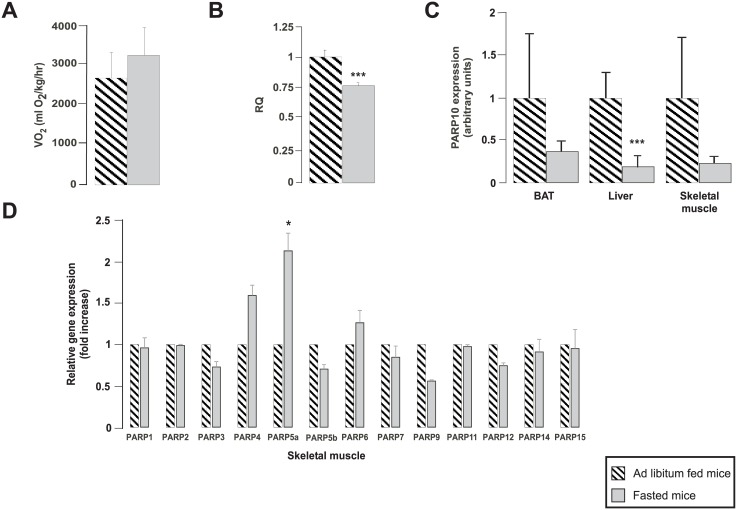
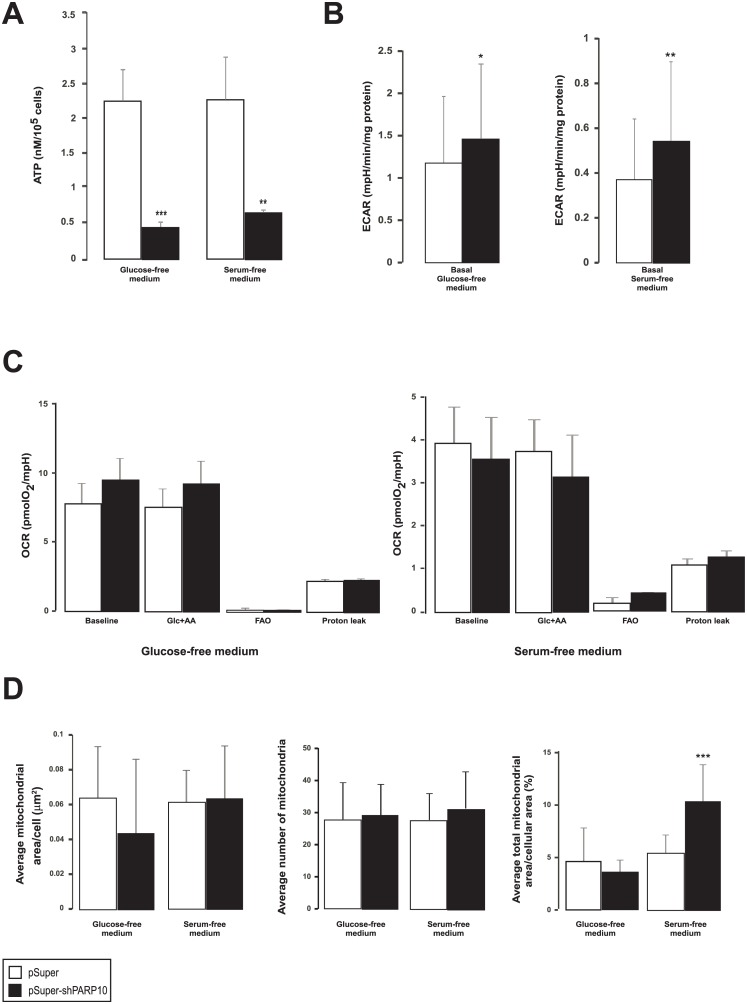
Poly(ADP-ribose) polymerase (PARP)10 is a PARP family member that performs mono-ADP-ribosylation of target proteins. Recent studies have linked PARP10 to metabolic processes and metabolic regulators that prompted us to assess whether PARP10 influences mitochondrial oxidative metabolism. The depletion of PARP10 by specific shRNAs increased mitochondrial oxidative capacity in cellular models of breast, cervical, colorectal and exocrine pancreas cancer. Upon silencing of PARP10, mitochondrial superoxide production decreased in line with increased expression of antioxidant genes pointing out lower oxidative stress upon PARP10 silencing. Improved mitochondrial oxidative capacity coincided with increased AMPK activation. The silencing of PARP10 in MCF7 and CaCo2 cells decreased the proliferation rate that correlated with increased expression of anti-Warburg enzymes (Foxo1, PGC-1α, IDH2 and fumarase). By analyzing an online database we showed that lower PARP10 expression increases survival in gastric cancer. Furthermore, PARP10 expression decreased upon fasting, a condition that is characterized by increases in mitochondrial biogenesis. Finally, lower PARP10 expression is associated with increased fatty acid oxidation.


Conflict of interest statement

Competing Interests: The authors have declared that no competing interests exist.

Figures

Fig 1
Fig 1. The characteristics of PARP10 silencing in MCF7, HeLa, CaCo2 and Capan2 cell lines.
(A) PARP10 silencing in the indicated cell lines was assessed by RT-qPCR (n = 6/6) and Western blotting. A typical experiment is shown as average ± SD. ** and *** indicate statistically significant difference between control and transfected samples at p<0.01 and p<0.001, respectively. (B) In CaCo2 cells the specificity of the PARP10 shRNA constructs was assessed by measuring the expression of the PARP family members in RT-qPCR reactions (n = 4/4). A typical experiment is shown as average ± SD. * indicate statistically significant difference between control and transfected samples at p<0.05.
Fig 2
Fig 2. The shRNA silencing of PARP10 induces mitochondrial oxidative activity.
(A) The mitochondrial oxygen consumption rate (OCR) were assayed by Seahorse XF analyzer after control shRNA or shPARP10 transfection as described in Materials and Methods (n = 23/23/23/23). A typical experiment is shown as average ± SD. * and ** indicate statistically significant difference between control and transfected cells at p<0.05 and p<0.01, respectively. (B) Mitochondrial DNA content was analyzed using qPCR in the indicated cell lines two days post transfection with control shRNA or shPARP10 (n = 3/3/3/3) as described in the Materials and Methods. Bars represent fold changes relative to control samples. All gene abbreviations are listed in the text. A typical experiment is shown as average ± SD. *, ** indicate statistically significant difference between control and transfected cells at p<0.05 and p<0.01, respectively. (C) To assess mitochondrial content and morphology electron microscopy was performed on control and PARP10-depleted CaCo2 cells followed by morphometry (n = 10/10). A typical experiment is shown as average ± SD. Representative images are provided, bar equals 2.5 μm. * indicate statistically significant difference between control and transfected cells at p<0.05. (D) The expression of genes involved in mitochondrial oxidative capacity, fatty acid oxidation and glycolysis was assessed in RT-qPCR reactions in control and PARP10-depleted CaCo2 (n = 4/4). Abbreviations are in the text. A typical experiment is shown as average ± SD. *, ** or *** indicate statistically significant difference between control and transfected cells at p<0.05 p<0.01 or p<0.001 respectively. Bars represent fold changes relative to control samples. (E) ECAR was assayed by Seahorse XF analyzer after two days transfection as described in Materials and Methods (n = 23/23/23/23). A typical experiment is shown as average ± SD. *** indicate statistically significant difference between control and transfected cells at p<0.001.
Fig 3
Fig 3. The shRNA silencing of PARP10 reduces free radical production.
(A) Superoxide production was measured in the indicated cell lines using hydroethidine (HE) staining after transfecting cell twice with control shRNA or shPARP10 as described in Materials and Methods. 20,000 events collected for each sample, experiments were performed three times, results are the average of these experiments ± SEM. *, ** and *** indicate statistically significant difference between control and transfected cells at p<0.05, p<0.01 and p<0.001, respectively. (B) The expression of antioxidant genes was assessed in RT-qPCR reactions in control and PARP10-depleted CaCo2 cells (n = 4/4). A typical experiment is shown as average ± SD. *, ** indicate statistically significant difference between control and transfected cells at p<0.05 and p<0.01, respectively. Bars represent fold changes relative to control samples. Abbreviations are in the text.
Fig 4
Fig 4. The shRNA silencing of PARP10 induces AMPK.
(A) The indicated cells were transfected with pSuper or the shPARP10 constructs for 2 days then cells were harvested and Western blot was performed. AMPK activity was determined by Western blot analysis of AMPK phosphorylation. The number of biological replicates for the AMPK blots in MCF7 is 3, Hela is 4, For CaCo2 is 3 and for Capan is 3; for the pAMPK blots in MCF7 is 4, Hela is 2, For CaCo2 is 3 and for Capan is 2. Actin was used as a loading control. Western blots were subjected to densitometry using the ImageJ software, a typical results is shown. On the pAMPK blots for HeLa and MCF7 brightness and contrast was adjusted. Abbreviations are in the text. (B) In control and PARP10-depleted CaCo2 (n = 4/4) ATP levels were determined. A typical experiment is shown as average ± SD.
Fig 5
Fig 5. The shRNA silencing of PARP10 reduces the proliferation of MCF7 and CaCo2 cells.
(A) Cell proliferation was determined by sulphorhodamine B assay upon ablation of PARP10 in the cell lines indicated as described in Materials and Methods (n = 3). Experiments were performed three times, results are the average of these experiments ± SEM. (B) Cell proliferation was assessed in CaCo2 cells (n = 8/8) by measuring BRDU incorporation after two days of control or PARP10 shRNA transfection. A typical experiment is shown as acverage ± SD. (C) The ratio of apoptotic and necrotic cells were determined in CaCo2 cells (n = 3/3) transfected with control of PARP10 shRNA for 2 days. A typical experiment is shown. *, ** and *** indicate statistically significant difference between control and transfected cells at p<0.05, p<0.01 and p<0.001, respectively. (D) The expression of the genes indicated was determined in RT-qPCR assays (n = 3, average ± SEM). In the same cells PGC-1α protein levels were determined by Western blotting. The number of the biological replicates for MCF7 is 2, for Hela is 2, for CaCo is 2 and for Capan is 3. On the bar charts the average of the results and SEM is shown.
Fig 6
Fig 6. Lower expression of PARP10 and higher expression of enzymes involved in oxidative phosphorylation confer protection against gastric cancer.
kmplot.com, a freely accessible database was screened for the genes indicated in patients suffering from gastric cancer. Overall survival rates were analyzed and all patients are depicted.
Fig 7
Fig 7. PARP10 expression changes inversely as mitochondrial oxidative capacity in mice.
C57/Bl6 male mice were subjected to 16 hours of fasting or received ad libitum food (n = 4/4, 3 months of age, average ± SEM). (A) The oxygen consumption and (B) the RQ were determined in these animals in indirect calorymetry experiments. (C) After dissection, the expression of PARP10 mRNA was determined by RT-qPCR in the brown adipose tissue (BAT), liver and skeletal muscle. (D) The expression of the members of the PARP family was determined in skeletal muscle using RT-qPCR reactions. Data is represented as average ± SEM. *, *** indicate statistically significant difference between control and transfected cells at p<0.05 or p<0.001, respectively.
Fig 8
Fig 8. PARP10-induced mitochondrial biogenesis is abolished upon glucose or serum fasting.
(A) CaCo2 cells (n = 4/4) were transfected with control or PARP10 shRNA for two days then ATP levels were determined. A typical experiment is shown as average ± SD. (B) ECAR was assayed by Seahorse XF analyzer in CaCo2 cells after two days transfection as described in Materials and Methods (n = 23/23/23/23). A typical experiment is shown as average ± SD. (C) The mitochondrial oxygen consumption rate (OCR) was assayed by Seahorse XF analyzer after two days transfection as described in Materials and Methods (n = 23/23/23/23). A typical experiment is shown as average ± SD. (D) To assess mitochondrial content and morphology electron microscopy was performed on control and PARP10-depleted CaCo2 cells (n = n = 8/13/8/18). A typical experiment is shown as average ± SD. **, *** indicate statistically significant difference between control and transfected cells at p<0.011 and p<0.001, respectively.

References

    1. Hottiger MO, Hassa PO, Luscher B, Schuler H, Koch-Nolte F. Toward a unified nomenclature for mammalian ADP-ribosyltransferases. Trends Biochem Sci. 2010;35(4):208–19 doi: 10.1016/j.tibs.2009.12.003 - DOI - PubMed
    1. Kleine H, Poreba E, Lesniewicz K, Hassa PO, Hottiger MO, Litchfield DW, et al. Substrate-assisted catalysis by PARP10 limits its activity to mono-ADP-ribosylation. Mol Cell. 2008;32(1):57–69 doi: 10.1016/j.molcel.2008.08.009 - DOI - PubMed
    1. Bai P. Biology of Poly(ADP-Ribose) Polymerases: The Factotums of Cell Maintenance. Mol Cell. 2015;58(6):947–58 doi: 10.1016/j.molcel.2015.01.034 - DOI - PubMed
    1. Virag L, Salzman AL, Szabo C. Poly(ADP-ribose) synthetase activation mediates mitochondrial injury during oxidant-induced cell death. JImmunol. 1998;161(7):3753–9 - PubMed
    1. Bai P, Nagy L, Fodor T, Liaudet L, Pacher P. Poly(ADP-ribose) polymerases as modulators of mitochondrial activity. Trends Endocrinol Metab. 2015;26(2):75–83 doi: 10.1016/j.tem.2014.11.003 - DOI - PubMed

Publication types

MeSH terms