. 2018 Jan 2;13(1):e0190015.
doi: 10.1371/journal.pone.0190015. eCollection 2018.

Evaluating the fishery and ecological consequences of the proposed North Sea multi-annual plan

Affiliations

Evaluating the fishery and ecological consequences of the proposed North Sea multi-annual plan

Steven Mackinson et al. PLoS One. .

Abstract

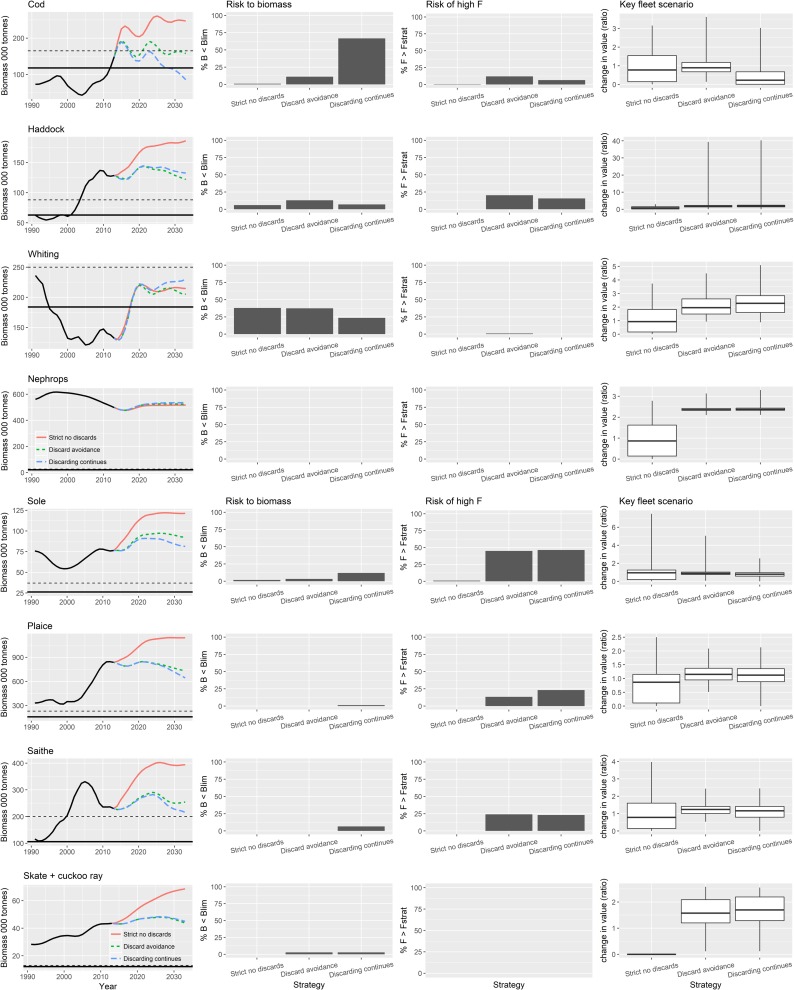
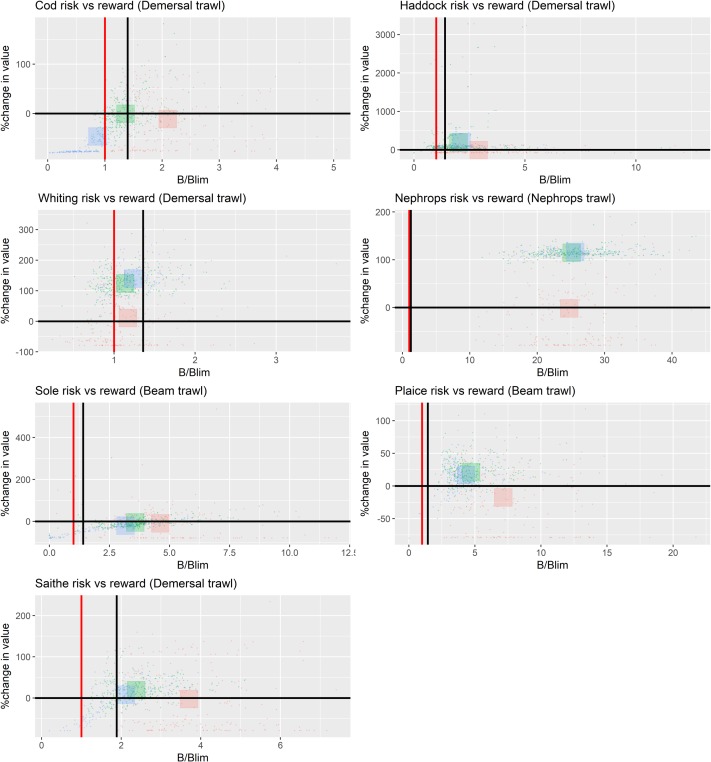
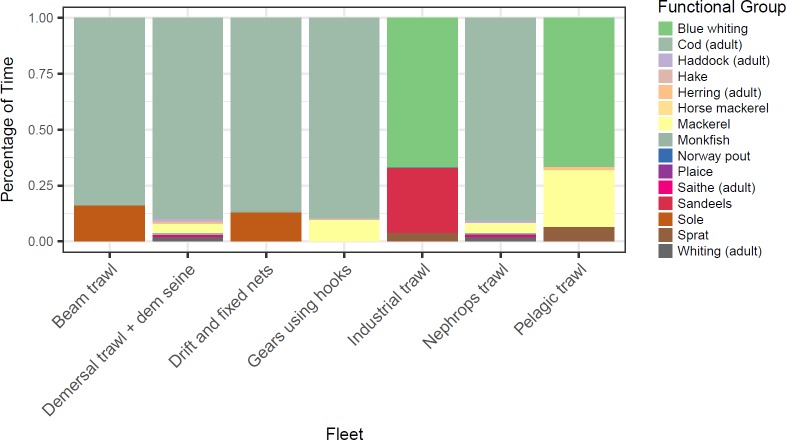
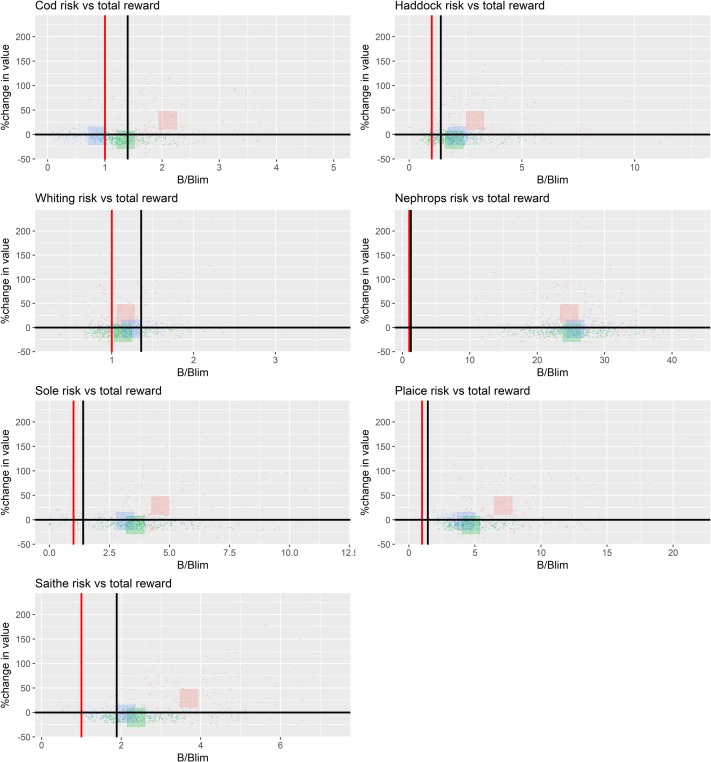
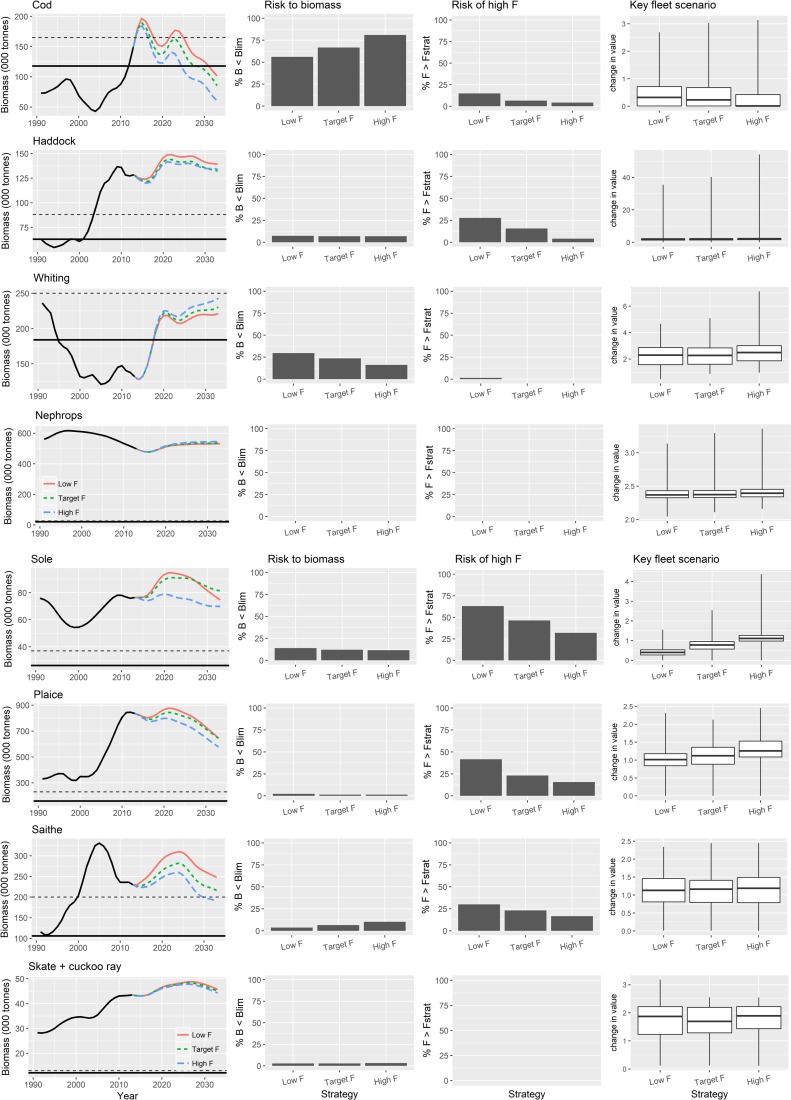
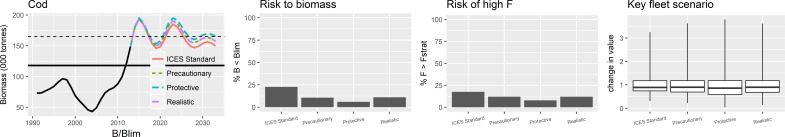
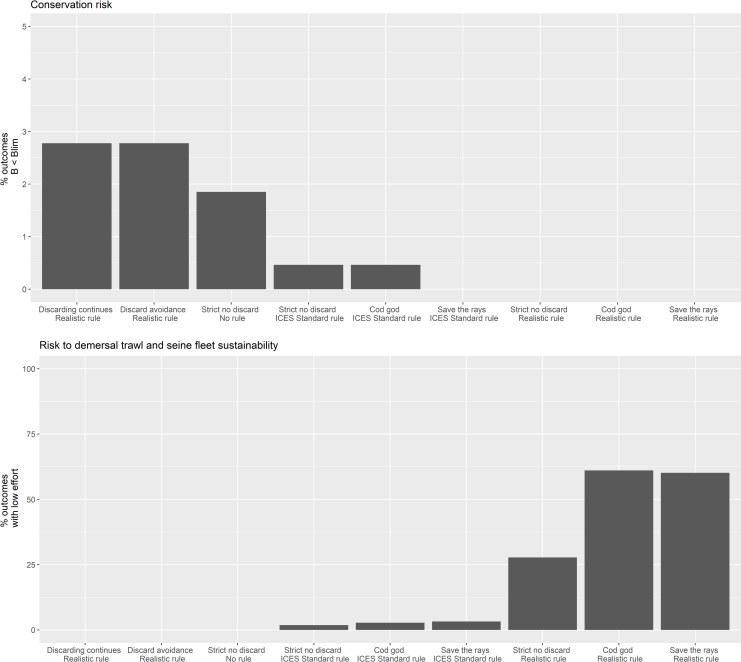
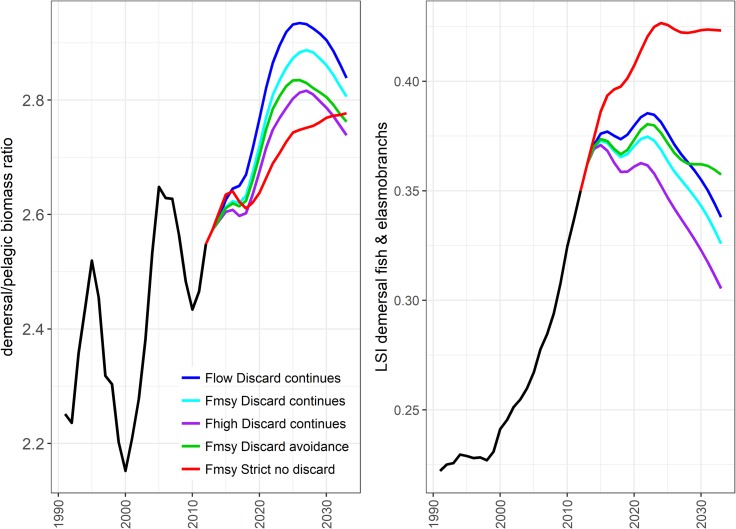
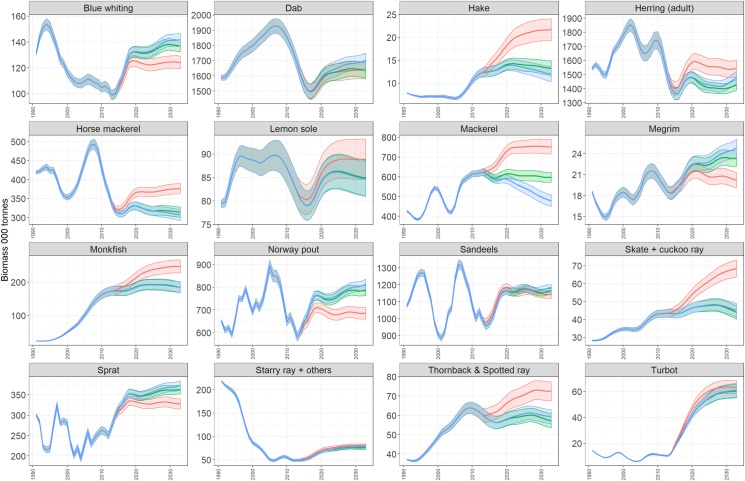
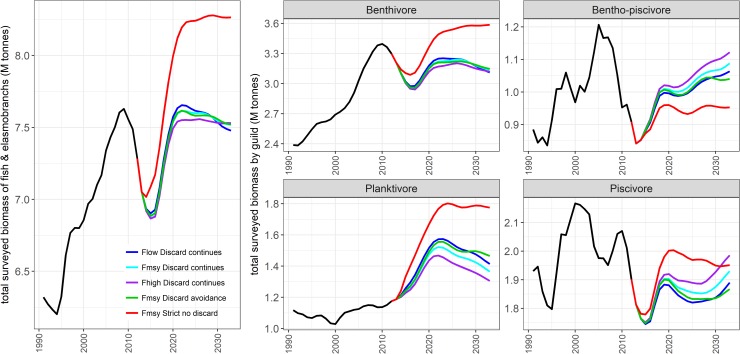
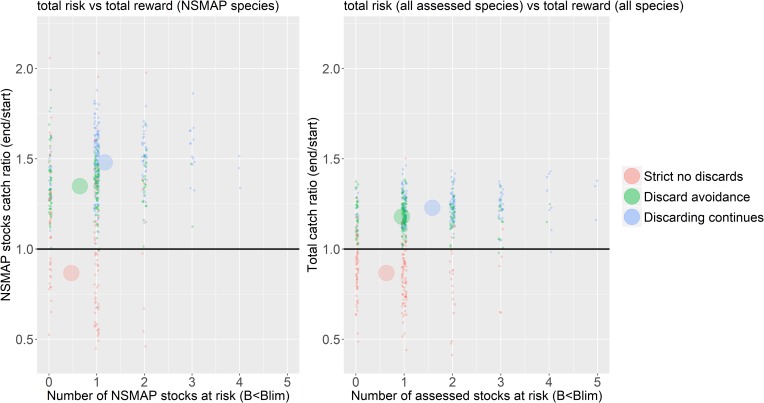
The possible impacts of the European Commission's proposed North Sea Multi-Annual Plan are evaluated in terms of its likely outcomes to achieve management objectives for fishing pressure, species' biomass, fishery yield, the landed value of key species and ecosystem objectives. The method applies management strategy evaluation procedures that employ an ecosystem model of the North Sea and its fisheries as the operating model. Taking five key dimensions of the proposed plan, it identifies those areas that are key to its successful performance. Overwhelmingly, choices in the options for the implementation of regulatory measures on discarding practices outweigh the effects of options related to fishing within ranges associated with 'pretty good yield', the way that biomass conservation safeguard mechanisms are applied and the timeframe for achieving fishing mortality targets. The impact of safeguard options and ranges in fishing mortality become important only when stock biomass is close to its reference points. The fifth dimension-taking into account wider conservation and ecosystem objectives-reveals that discard policy has a big impact on conservation species, but also that the type of harvest control rule can play an important role in limiting risks to stocks by 'applying the brakes' early. The consequences to fisheries however is heightened risk to their viability, thus exposing the sustainability trade-offs faced with balancing societal pressures for blue growth and enhanced conservation. It also reveals the wider ecosystem impacts that emphasise the connectivity between the demersal and pelagic realms, and thus, the importance of not treating the demersal NSMAP in isolation from other management plans. When stocks are below their biomass reference points, low F strategies lead to better long term economic performance, but for stocks consistently above biomass reference points, high F strategies lead to higher long term value. Nephrops and whiting often show contradictory responses to the strategies because changes in their predators abundance affects their abundance and success of their fisheries.


Conflict of interest statement

Competing Interests: The authors have declared that no competing interests exist.

Figures

Fig 1
Fig 1. Flow chart showing an overview of the two main stages of the plugin.
Fig 2
Fig 2. Flowchart for the evaluation of management strategies.
Fig 3
Fig 3. Example of a curve showing landings (as a percentage of MSY) as a function of fishing mortality (F).
The location of Fmsy, Flower and Fupper are indicated, the latter two corresponding to 95% of the peak of the median landings curve. Units are standardised to a scale of 0–100.
Fig 4
Fig 4. HCR types used in defining alternative strategies.
Fig 5
Fig 5. Contrast between 3 NSMAP strategies with safeguard using Realistic HCR type 4 (see Fig 4) and fishing at Fmsy by 2020 in each.
Strict no discards (red and left bar/box in each pane), discard avoidance (green and middle bar/box), discard continues (blue and right bar/box). The solid black line in the first column of plots shows Blim and dotted line MSY BTrigger. The plots of risk of high F show the proportion of simulations (but do not reflect the magnitude) with landed F> the target F defined by the harvest control rule used in the strategy.
Fig 6
Fig 6. Contrast in risk-reward between 3 strategies.
Strict no discards (red), discard avoidance (green), discard continues (blue). Risk by stock and reward by value to the key fleet* targeting the stock in the NSMAP scenario, fishing at Fmsy by 2020 and safeguarded by HCR Type 4 (See Fig 4). The red vertical line in each panel shows Blim and the black line in MSY Btrigger. Each small point represents an outcome for a single model parameterisation from the full set given coloured with respect to the strategy implemented. The large squares show the mean response averaged across the parameter set and coloured with respect to the strategy implemented. *(Key fleets: cod, haddock, whiting, saithe = demersal trawl and seine; Nephrops = Nephrops trawls; plaice and sole = beam trawls).
Fig 7
Fig 7. Choke species in NSMAP scenario fishing at Fmsy by 2020 safeguarded by HCR Type 4 with strict no discards (See Fig 4).
Each section within a single bar shows the percentage of years in which each stock forms the choke species (averaged across each model simulation for this single strategy).
Fig 8
Fig 8. Contrast in risk by stock and total reward (combined value of the species in the NSMAP across all fleets) between 3 strategies.
Strict no discards (red), discard avoidance (green), discard continues (blue). The red vertical line in each pane shows Blim and the black line in MSY BTrigger. Each small point represents an outcome for a single parameterisation from the full set coloured by strategy implemented. The large squares show the mean response averaged across parameterisations and coloured by strategy implemented.
Fig 9
Fig 9. Contrast between fishing effect of ranges in fishing mortality.
Low F (red), high F (green) and Fmsy (blue) implemented with NSMAP strategies with safeguard and using realistic harvest control rule type 4 (see Fig 4) and fishing at target levels by 2020 with discarding continuing. The solid black line in the first column of plots shows Blim and the dotted line MSY Btrigger.
Fig 10
Fig 10. Modelled effect of HCR types on cod metrics for a scenario implementing the NSMAP with fishing at Fmsy by 2020 and incorporating discard avoidance.
Fig 11
Fig 11. Contrast in risk to conservation species biomass (top) and sustainability of the principal fishery (bottom).
Conservation species—common skate and cuckoo ray). Principal fishery—demersal trawl and seine fleet. Low effort is defined as ≤ 10% of fishing effort in 1990) between 9 strategies each fishing at Fmsy by 2020. The contrast between bars 1, 2 and 7 shows the change in risk due to change in discard regulation options only as each is safeguarded by HCR Type 4. Bars 3 and 4 contrast the change in risk when the safeguard as applied in column 7, is either removed or altered to HCR Type 1 (See Fig 4). Bars 5 and 8 demonstrate the effect of a management strategy focused on reducing risk to the depletion of cod (‘Cod god’ strategy, see text, using HCR Type 1 and 4 respectively). Bars 6 and 8 demonstrate the effect of a management strategy focused on reducing risk to the depletion of skates and rays (‘Save the rays’ scenarios, see text, using HCR Type 1 and 4 respectively).
Fig 12
Fig 12. The Large Species Indicator (LSI, right) and ratio (left) of biomass of demersal species to pelagic species contrasted across multiple strategies.
Strategies include all NSMAP with ICES standard advice rule Type 1 as the safeguard and constant time frame rule. Pelagic groups include sprat, herring, blue whiting, miscellaneous filter feeding fish, mackerel and horse mackerel and demersal fish include all other fish and elasmobranch groups. LSI includes only those species surveyed by the North Sea International Bottom Trawl Survey (see Lynam and Mackinson, 2015). Note all scenarios are equal for the period 1991–2012.
Fig 13
Fig 13. Biomass trajectories of additional species of interest.
Shows the contrast in outcomes between 3 strategies, strict no discards (red); discard avoidance (green) and discard continues (blue) with 95% confidence interval.
Fig 14
Fig 14. Foodweb indicators contrasted across multiple strategies.
All NSMAP strategies with ICES standard advice rule Type 1 as the safeguard and constant time frame rule. Left—total biomass of fish and elasmobranchs and right—biomass by trophic guild, including only those species surveyed by the North Sea International Bottom Trawl Survey (see Lynam and Mackinson, 2015). Note all scenarios are equal for the period 1991–2012.
Fig 15
Fig 15. Contrast in risk of depletion of stocks against the reward of total landed catch.
Risk is the number of stock below their individual Blim reference points. The vertical axis shows the ratio of total tonnage caught at the end of the forecast, i.e. the average of the last five years, to the initial catch at the start of the forecast period. The pane of the left is specific to the stocks in the NSMAP, whereas the pane on the right includes all species with a reference level in the estimate of risk and all fish and elasmobranch stocks caught by fisheries in the catch ratio. The risks and rewards are contrasted between 3 strategies; strict no discards (red), discard avoidance (green), discard continues (blue). The black horizontal line shows the level at which the tonnage caught at the end of the simulation is equal to the start, points above this line represent runs with increased tonnage caught. Each small point represents an outcome for a single parameterisation from the full set coloured by strategy implemented. The large circles show the mean response averaged across parameterisations and coloured by strategy implemented.

References

    1. EC 2013. REGULATION (EU) No 1380/2013 OF THE EUROPEAN PARLIAMENT AND OF THE COUNCIL of 11 December 2013 on the Common Fisheries Policy amending Council Regulations (EC) No 1954/2003 and (EC) No 1224/2009 and repealing Council Regulations (EC) No 2371/2002 and (EC) No 639/2004 and Council Decision 2004/585/EC.
    1. EC 2016. COM/2016/0493 final—2016/0238 (COD). Proposal for a REGULATION OF THE EUROPEAN PARLIAMENT AND OF THE COUNCIL on establishing a multi-annual plan for demersal stocks in the North Sea and the fisheries exploiting those stocks and repealing Council Regulation (EC) 676/2007 and Council Regulation (EC) 1342/2008.
    1. ICES 2014. Report of the Joint ICES-MYFISH Workshop to consider the basis for FMSY ranges for all stocks (WKMSYREF3) 17–21 November 2014 Charlottenlund Denmark. ICES CM 2014/ACOM:64. 156 pp.
    1. Rindorf A, Dichmont C M, Levin P S, Mace P, Pascoe S, Prellezo R, et al. 2016. Food for thought: pretty good multispecies yield.–ICES Journal of Marine Science 74: 475–486.
    1. Rindorf A, Cardinale M, Shephard S, De Oliveira J, Hjorleifsson E, Kempf A. et al. 2017. Fishing for MSY: using “pretty good yield” ranges without impairing recruitment. ICES Journal of Marine Science 74: 525–534. doi: 10.1093/icesjms/fsw111 - DOI

Publication types

LinkOut - more resources