. 2018 Jan 2;13(1):e0190468.
doi: 10.1371/journal.pone.0190468. eCollection 2018.

Circulating Tfh1 (cTfh1) cell numbers and PD1 expression are elevated in low-grade B-cell non-Hodgkin's lymphoma and cTfh gene expression is perturbed in marginal zone lymphoma

Affiliations

Circulating Tfh1 (cTfh1) cell numbers and PD1 expression are elevated in low-grade B-cell non-Hodgkin's lymphoma and cTfh gene expression is perturbed in marginal zone lymphoma

Elliot T Byford et al. PLoS One. .

Abstract

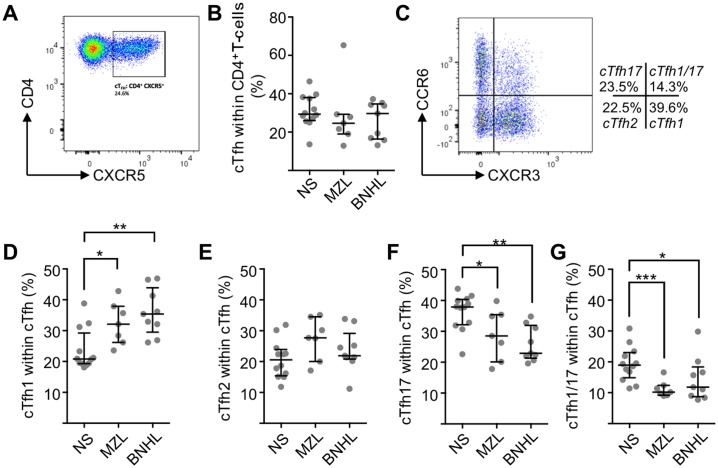
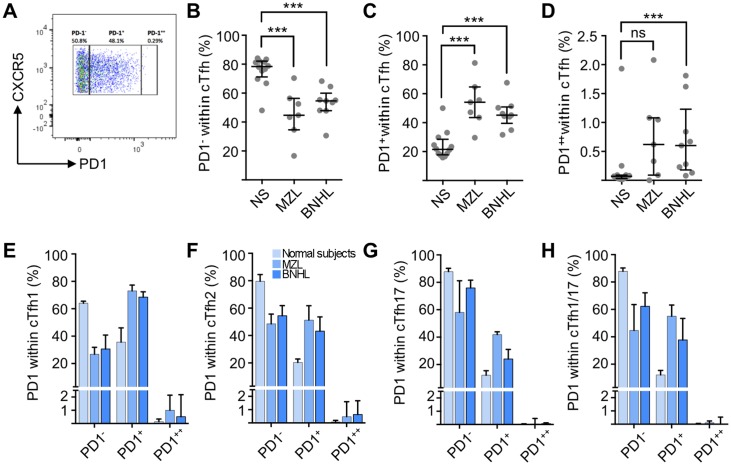
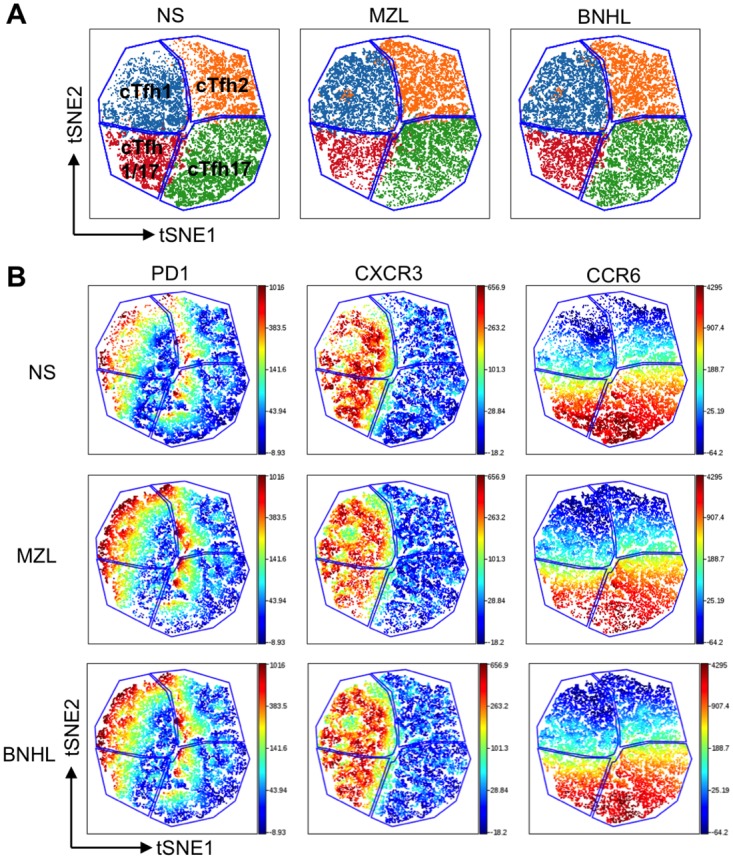
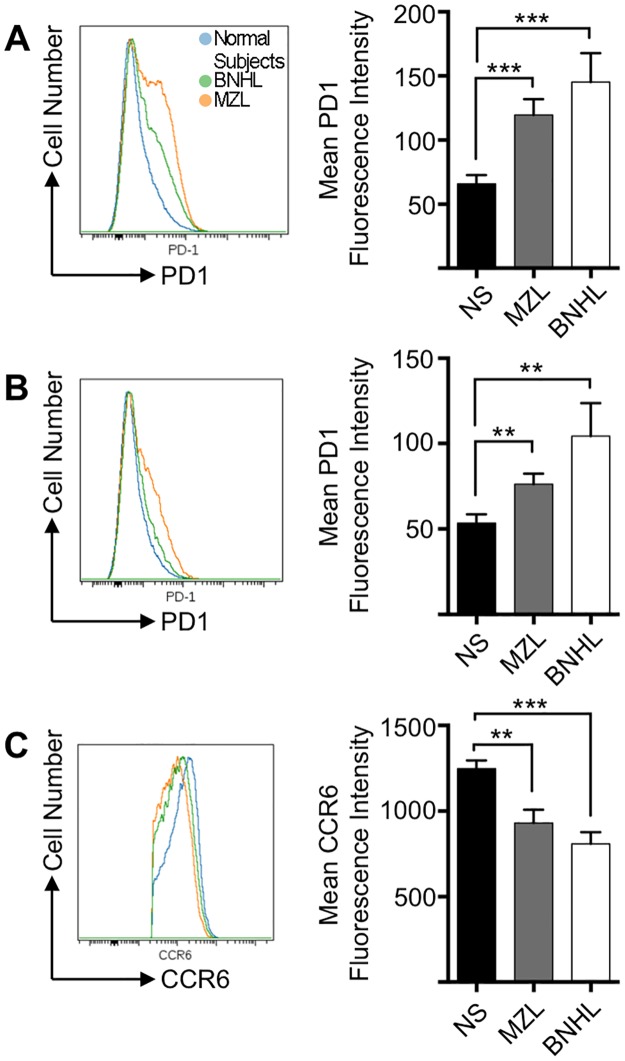
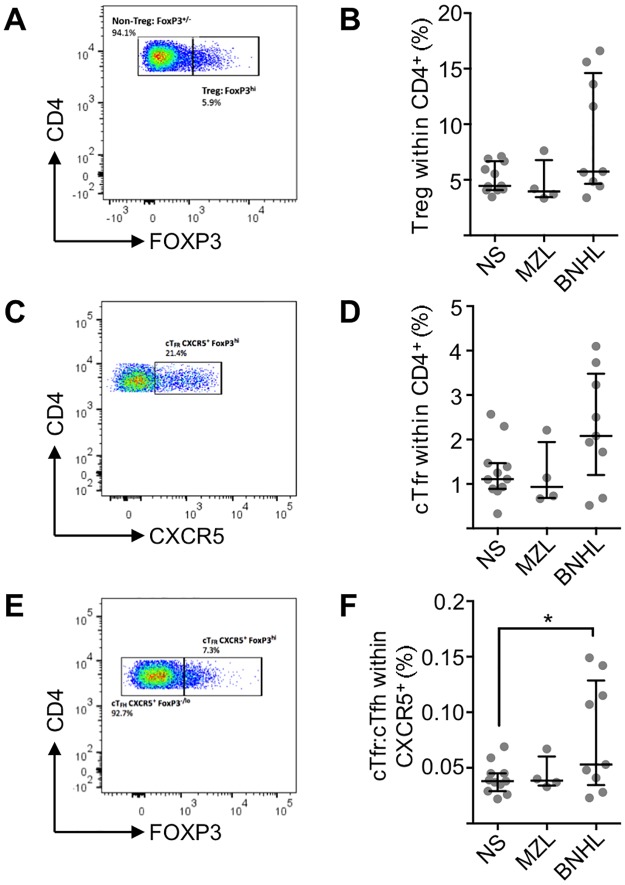
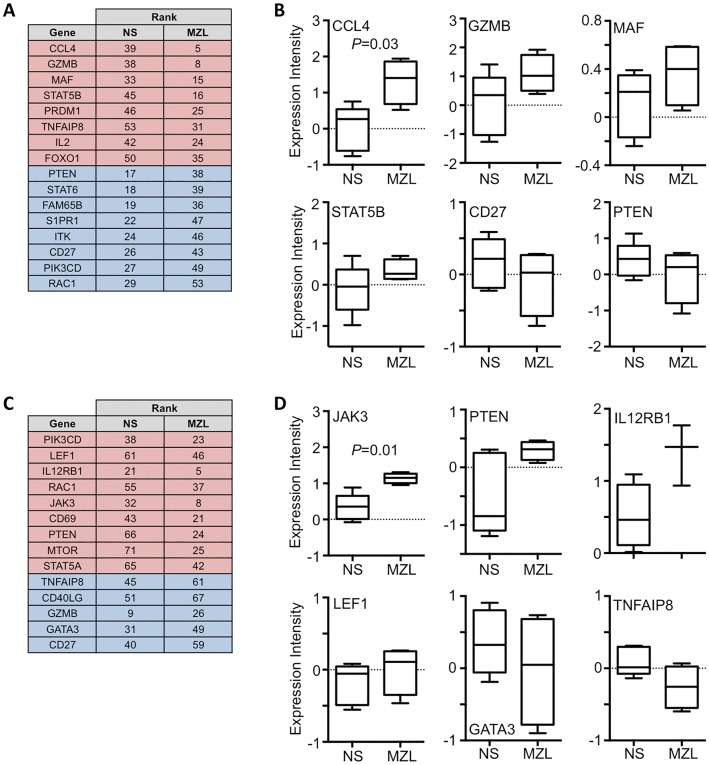
CD4+ T-cell subsets are found in the tumour microenvironment (TME) of low-grade B-cell non-Hodgkin's lymphomas such as marginal zone lymphoma (MZL) or follicular lymphoma (FL). Both numbers and architecture of activating follicular helper T-cells (Tfh) and suppressive Treg in the TME of FL are associated with clinical outcomes. There has been almost no previous work on CD4+ T-cells in MZL. It is now recognised that circulating CD4+CXCR5+ T-cells are the memory compartment of Tfh cells. We determined differences in number of circulating Tfh (cTfh) cells and cTfh subsets between normal subjects and patients with FL or MZL. Lymphoma patients showed increased numbers of cTfh1 and reduced cTfh17 cells due to decreased expression of the subset-defining marker CCR6 in patients. PD1, a surface marker associated with Tfh cells, showed increased expression on cTfh subsets in patients. Focusing on MZL we determined expression of 96 T-cell associated genes by microfluidic qRT-PCR. Analysis of differentially expressed genes showed significant differences between normal subjects and patients both for bulk cTfh (CCL4) and the cTfh1 subset (JAK3). While our findings require confirmation in larger studies we suggest that analysis of number and gene expression of circulating T-cells might be a source of clinically useful information as is the case for T-cells within lymphoma lymph nodes.


Conflict of interest statement

Competing Interests: The authors have declared that no competing interests exist.

Figures

Fig 1
Fig 1. cTfh and cTfh subset proportions in normal subjects and low-grade B-NHL.
(A) After lymphocyte gating and exclusion of doublets, live and CD45RA- cells were identified for further analysis. The biaxial plot shows CXCR5 and CD4 expression from a representative MZL patient. The gate defines CD4+CXCR5+ (cTfh) cells as being 24.6% of total CD4+ T-cells. (B) cTfh cells as a percentage of CD4+ cells in normal subjects (median±SD, 18.9±5.7) and patients with FL (11.8±7.1) and MZL (10.2±2.7). Horizontal lines represent the median and bars represent inter-quartile range. (C) Biaxial flow cytometry plot showing CXCR3 and CCR6 expression on CD4+CD45RA-CXCR5+ cells. Four populations are identifiable: CXCR3+CCR6- (cTfh1), CXCR3-CCR6- (cTfh2), CXCR3-CCR6+ (cTfh17) and CXCR3+CCR6+ (cTfh1/17). (D) cTfh1 cells as a percentage of total cTfh cells. Medians are significantly (Mann-Whitney U-test) different between normal subjects (n = 12, 20.8±6.7%) and lymphoma patients (MZL, n = 7, 32.1±6.8%, P = 0.013 and FL, n = 9, 35.4±7.6%, P = 0.0056). (E) cTfh2 cells as a percentage of total cTfh cells. There are no significant differences between groups. (F) cTfh17 cells as a percentage of total cTfh cells. Medians are significantly different between normal subjects (37.9±5.9%) and lymphoma patients (MZL 28.5±8.2%, P = 0.045 and FL 22.9±5.7%, P = 0.0006). (G) cTfh1/17 cells as a proportion of total cTfh cells. Medians are significantly different between normal subjects (18.9±5.7%) and lymphoma patients (MZL 10.2±2.7%, P = 0.0008 and FL 11.8±7.1%, P = 0.016).
Fig 2
Fig 2. PD1 expression on cTfh subsets.
(A) Biaxial flow cytometry plot showing expression of PD1 and CXCR5 on cells gated for CD4+CD45RA-CXCR5+. Gates defining PD1++, PD1+ and PD1- cells were set by employing human tonsillar T-cells as controls. This representative example from a patient with MZL shows PD1- 50.8%, PD1+ 48.1% and PD1++ 0.29%. (B) PD1- cells as a proportion of total cTfh cells. Horizontal lines represent the median and bars represent inter-quartile range. Medians are significantly (Mann-Whitney U-test) different between normal subjects (n = 12, 78.4% (interquartile range 71.2 to 82.1%) and lymphoma patients (MZL n = 7, 44.7% (34.6 to 56.4%), P = 0.0008 and FL n = 9, 54.6% (47.9 to 60%), P = 0.0016). (C) PD1+ cells as a proportion of total cTfh cells. Medians are significantly different between normal subjects (21.5%, interquartile range 17.8 to 28.6%) and lymphoma patients (MZL 54.1% (43.5 to 64.7%), P = 0.0008 and FL 45.2% (39.5 to 50.9%), P = 0.0003). (D) PD1++ cells as a proportion of total cTfh cells. There is no significant difference between normal subjects (median 0.07%, interquartile range 0.03 to 0.09%) and MZL patients (median 0.62%, interquartile range 0.09 to 1.08%, P = 0.05) but there is a significant difference for BNHL (median 0.6%, interquartile range 0.18 to 1.23%, P = 0.003). Distribution of PD1 expression (PD1++, PD1+ or PD1-) within (E) cTfh1 cells, (F) cTfh2 cells, (G) cTfh17 cells and (H) cTfh1/17 cells.
Fig 3
Fig 3. Clustering by ViSNE reveals surface marker expression changes in cTfh subsets.
(A) Comparison of VisNE maps and gating from biaxial flow cytometry plots. Areas within blue lines are derived from the ViSNE maps. Cells coloured according to biaxial plots fro CXCR3 and CCR6 are coloured as shown: cTfh1 (blue), cTfh2 (orange), cTfh17 (green), cTfh1/17 (red). (B) The overall ViSNE map generated for each group is coloured according to the fluorescence intensity of the PD1, CXCR3 and CCR6 channels. Cells were pre-gated to cTfh. Level of expression is according to the bar to the right of the figure with red being highest expression.
Fig 4
Fig 4. CCR6 and PD1 expression in cTfh subsets.
(A) Concatenated FACS histogram showing superimposed PD1 expression in CD4+CXCR5+ cells from normal subjects (n = 12) and patients with MZL (n = 7) and BNHL (n = 9). The right hand column chart demonstrates PD1 expression (geometric mean fluorescence intensity) for each group (mean±SEM). There are significant increases in PD1 expression in MZL (Mann-Whitney U-test; P = 0.0008) and BNHL (P = 0.0005). (B) FACS histograms showing PD1 expression in CD4+CXCR5+CCR6+ cells from normal subjects and patients with MZL and BNHL. The right hand column chart demonstrates PD1 expression (geometric mean fluorescence intensity) for each group (mean±SEM). There are significant increases in PD1 expression in MZL (Mann-Whitney U-test; P = 0.0052) and BNHL (P = 0.0033). (C) FACS histograms showing CCR6 expression in CD4+CXCR5+CCR6+ cells from normal subjects and patients with MZL and BNHL. The right hand column chart demonstrates PD1 expression (geometric mean fluorescence intensity) for each group (mean±SEM). There are significant decreases in CCR6 expression in MZL (Mann-Whitney U-test; P = 0.0005) and BNHL (P = 0.0035).
Fig 5
Fig 5. Suppressive Tregs and Tfr in normal subjects and low-grade lymphoma.
(A) Biaxial flow cytometry plot showing expression of CD4 and FOXP3 on cells gated for CD4+CD45RA-. The highest 5% of cells from 11 concatenated NS were employed for the FOXP3hi gate. This representative example from a patient with lymphoma shows Treg 5.9% of CD4+CD45RA- cells. (B) Percentage of Treg within total CD4+ T-cells in normal subjects (n = 11), MZL (N = 4) and BNHL (n = 9). Horizontal lines represent the median and bars represent inter-quartile range. No significant differences were found between groups (Mann-Whitney U test). (C) Biaxial flow cytometry plot showing expression of CD4 and CXCR5 on cells gated for CD4+CD45RA-FOXP3hi. This representative example from a patient with lymphoma shows cTfr 21.4% of CD4+CD45RA-FOXP3hi cells. (D) cTfr as a proportion of total CD4+ T-cells. Horizontal lines represent the median and bars represent inter-quartile range. There are no significant differences between normal subjects (n = 11) and patient with MZL (n = 4) or BNHL (n = 9). (E) Biaxial flow cytometry plot showing expression of CD4 and FOXP3 on cells gated for CD4+CD45RA-CXCR5+. Gates were set by employing human tonsillar T-cells as controls. This representative example from a patient with lymphoma shows cTfr (FOXP3hi) 7.3% and cTfh (FOXP3-/lo) 92.7% of CD4+CD45RA-CXCR5+ cells. (F) cTfr:cTfh ratio. Horizontal lines represent the median and bars represent inter-quartile range. BNHL patients (n = 9) showed a significant difference (Mann-Whitney U-test, P = 0.038) from normal subjects (n = 11) but MZL patients (n = 4) did not.
Fig 6
Fig 6. Gene expression changes between normal subjects and MZL patients.
(A) Listing of genes showing the greatest relative change of expression level comparing cTfh PD1+ cells from normal subjects (NS) and patients with MZL. Genes showing an increase in rank in MZL i.e. increased expression are shaded red and those showing a decrease in rank are shaded blue. (B) Box and whisker plot (median, interquartile ranges and 10th and 90th percentile) showing expression levels of CCL4, which differed significantly between cTfh cells of normal subjects and MZL patients (Mann-Whitney U-test, P = 0.03). Examples of non-significant expression level changes are shown for GZMB, MAF, STAT5B, CD27 and PTEN. (C) Relative change in gene expression comparing cTfh1 PD1+ cells from normal subjects (NS) and patients with MZL. Genes showing an increase in rank in MZL i.e. increased expression are shaded red and those showing a decrease in rank are shaded blue. (D) Expression levels of JAK3 differed significantly (Mann-Whitney U-test, P = 0.01) between cTfh1 cells of normal subjects and MZL patients. Examples of non-significant expression level changes are shown for PTEN, IL12RB1, LEF1, GATA3 and TNFAIP8.

References

    1. Hacken ten E, Burger JA. Microenvironment dependency in Chronic Lymphocytic Leukemia: The basis for new targeted therapies. Pharmacology and Therapeutics. 2014;144: 338–348. doi: 10.1016/j.pharmthera.2014.07.003 - DOI - PubMed
    1. Burger JA, Gribben JG. The microenvironment in chronic lymphocytic leukemia (CLL) and other B cell malignancies: Insight into disease biology and new targeted therapies. Semin Cancer Biol. Elsevier Ltd; 2013; 1–11. doi: 10.1016/j.semcancer.2013.08.011 - DOI - PubMed
    1. Lee AM, Clear AJ, Calaminici M, Davies AJ, Jordan S, MacDougall F, et al. Number of CD4+ cells and location of forkhead box protein P3-positive cells in diagnostic follicular lymphoma tissue microarrays correlates with outcome. J Clin Oncol. 2006;24: 5052–5059. doi: 10.1200/JCO.2006.06.4642 - DOI - PubMed
    1. Carreras J, López-Guillermo A, Fox BC, Colomo L, Martinez A, Roncador G, et al. High numbers of tumor-infiltrating FOXP3-positive regulatory T cells are associated with improved overall survival in follicular lymphoma. Blood. American Society of Hematology; 2006;108: 2957–2964. doi: 10.1182/blood-2006-04-018218 - DOI - PubMed
    1. Carreras J, Lopez-Guillermo A, Roncador G, Villamor N, Colomo L, Martinez A, et al. High numbers of tumor-infiltrating programmed cell death 1-positive regulatory lymphocytesare associated with improved overall survival in follicular lymphoma. J Clin Oncol. 2009;27: 1470–1476. doi: 10.1200/JCO.2008.18.0513 - DOI - PubMed

Publication types

Substances