Comparative Study
. 2018 Jan 2;14(1):e1006756.
doi: 10.1371/journal.ppat.1006756. eCollection 2018 Jan.

A role for small RNA in regulating innate immunity during plant growth

Affiliations
Comparative Study

A role for small RNA in regulating innate immunity during plant growth

Yingtian Deng et al. PLoS Pathog. .

Abstract

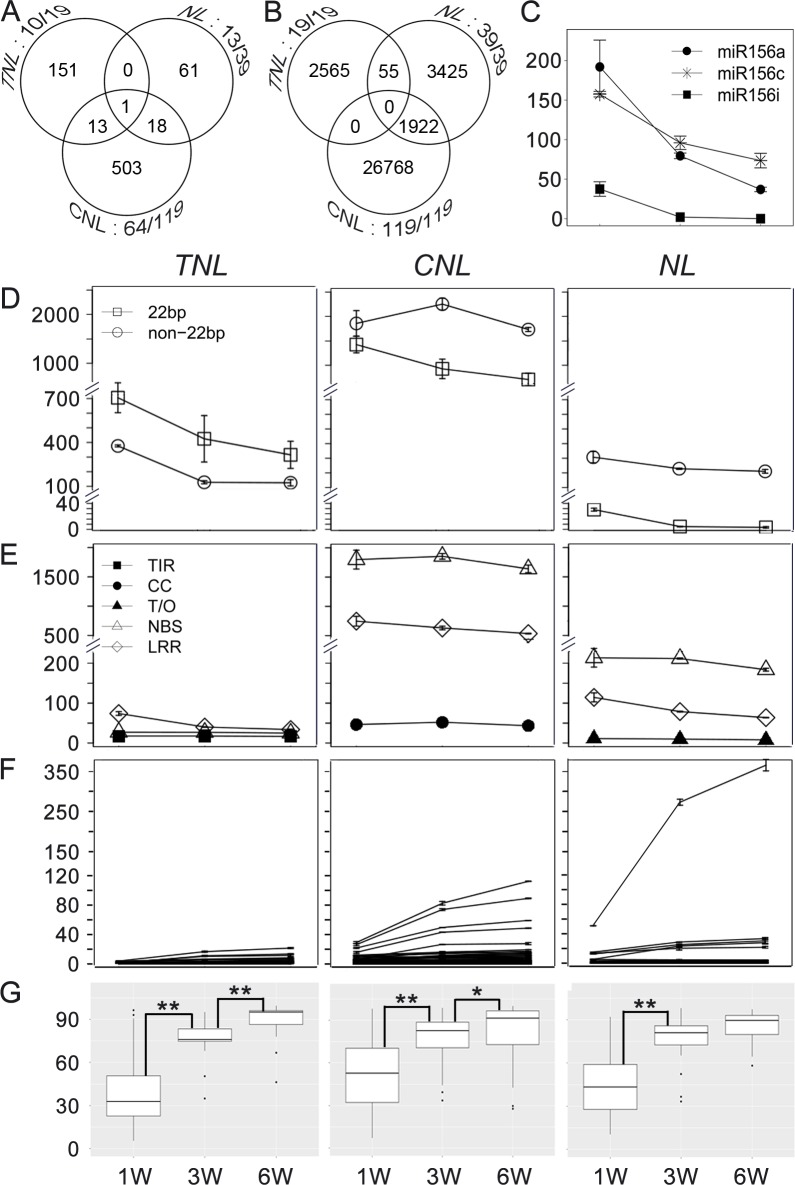
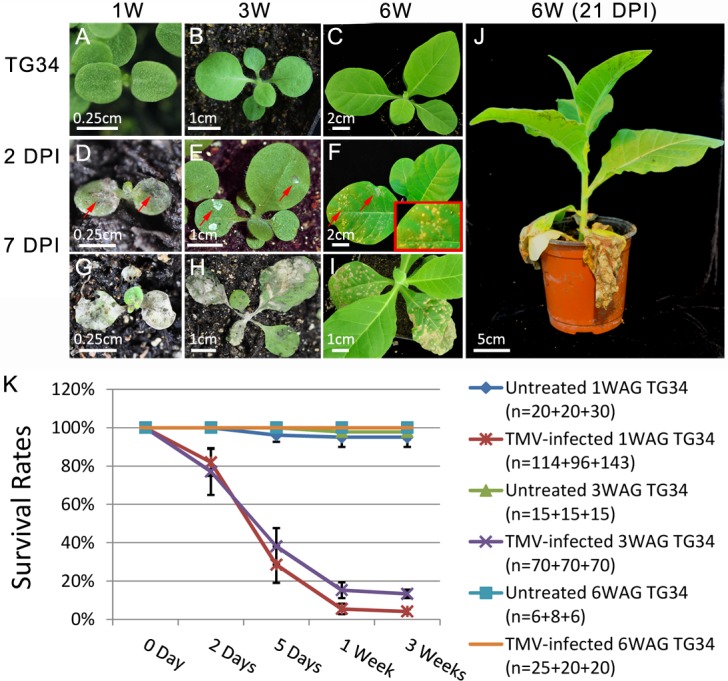
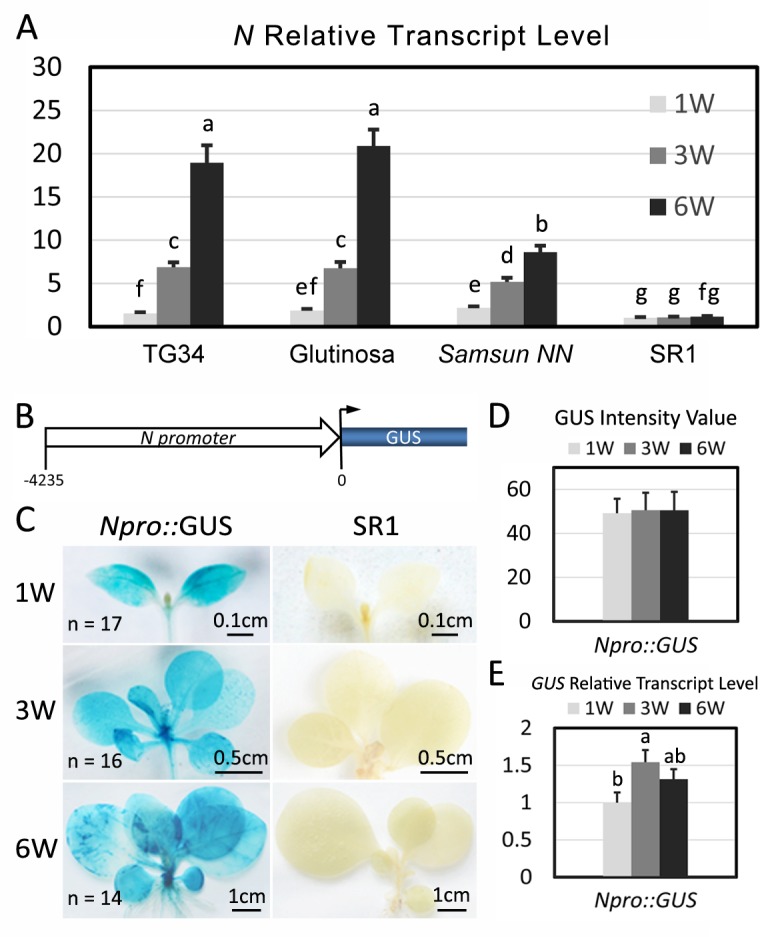
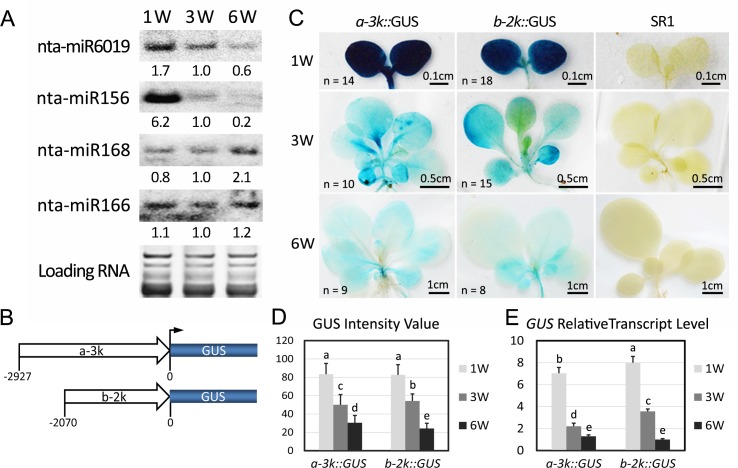
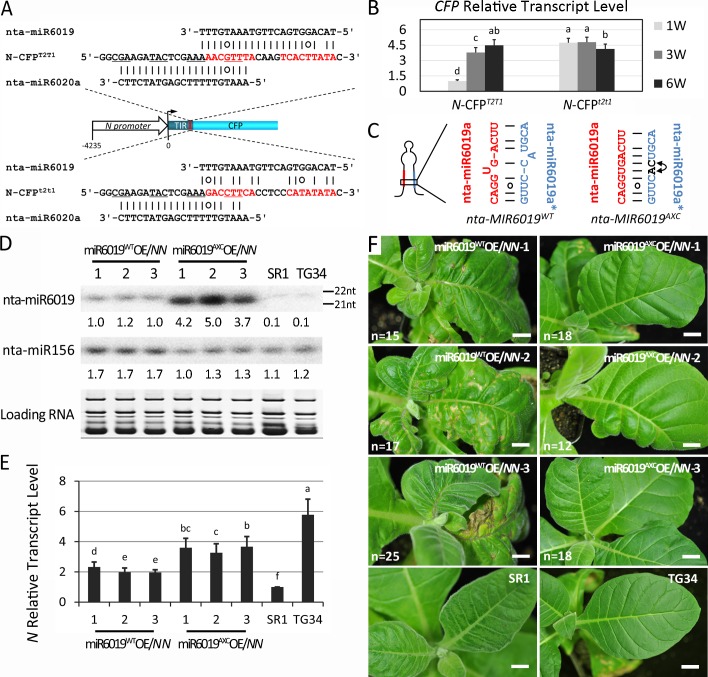
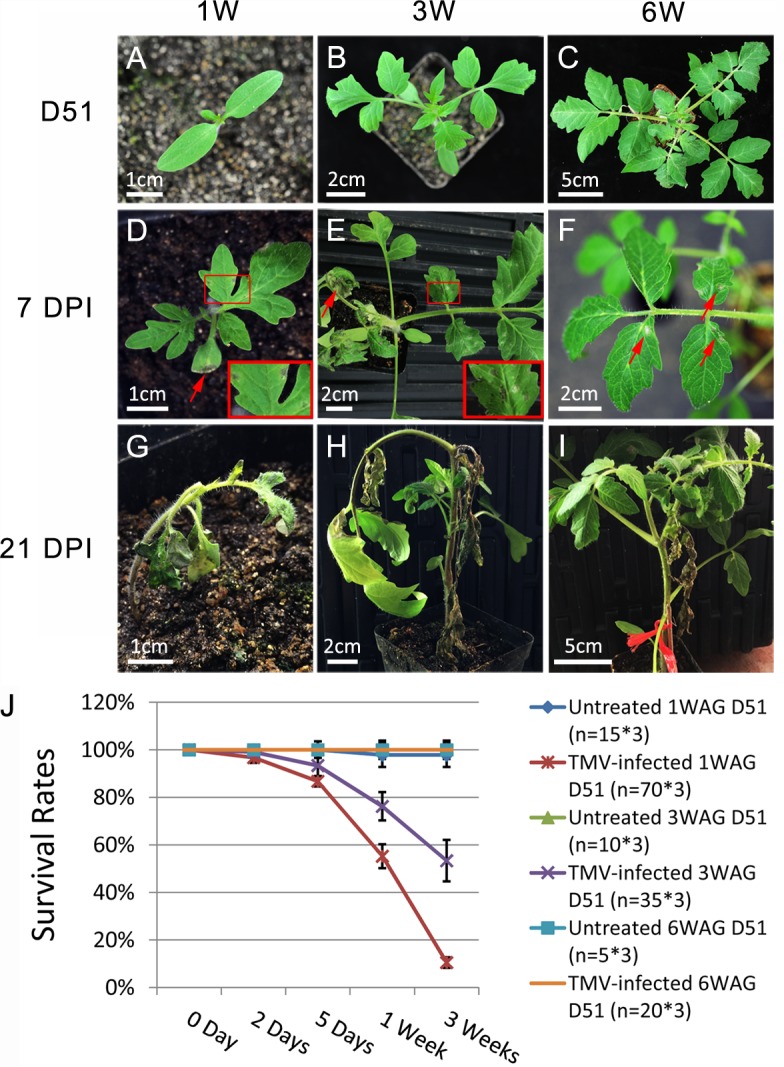
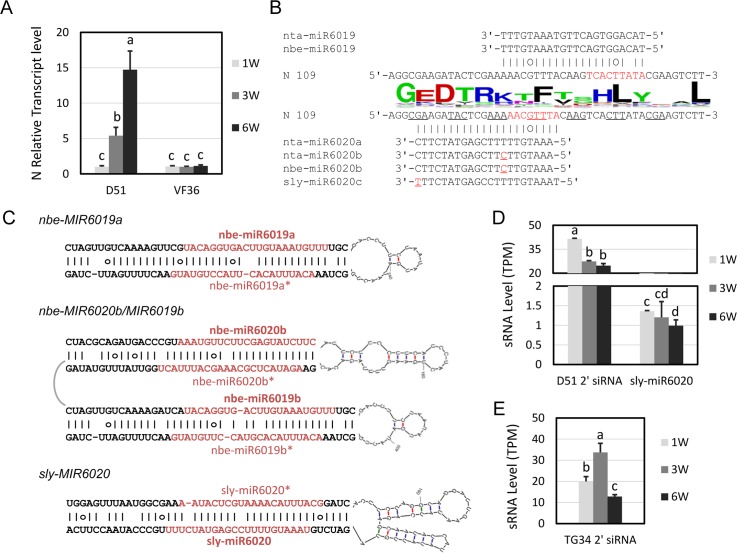
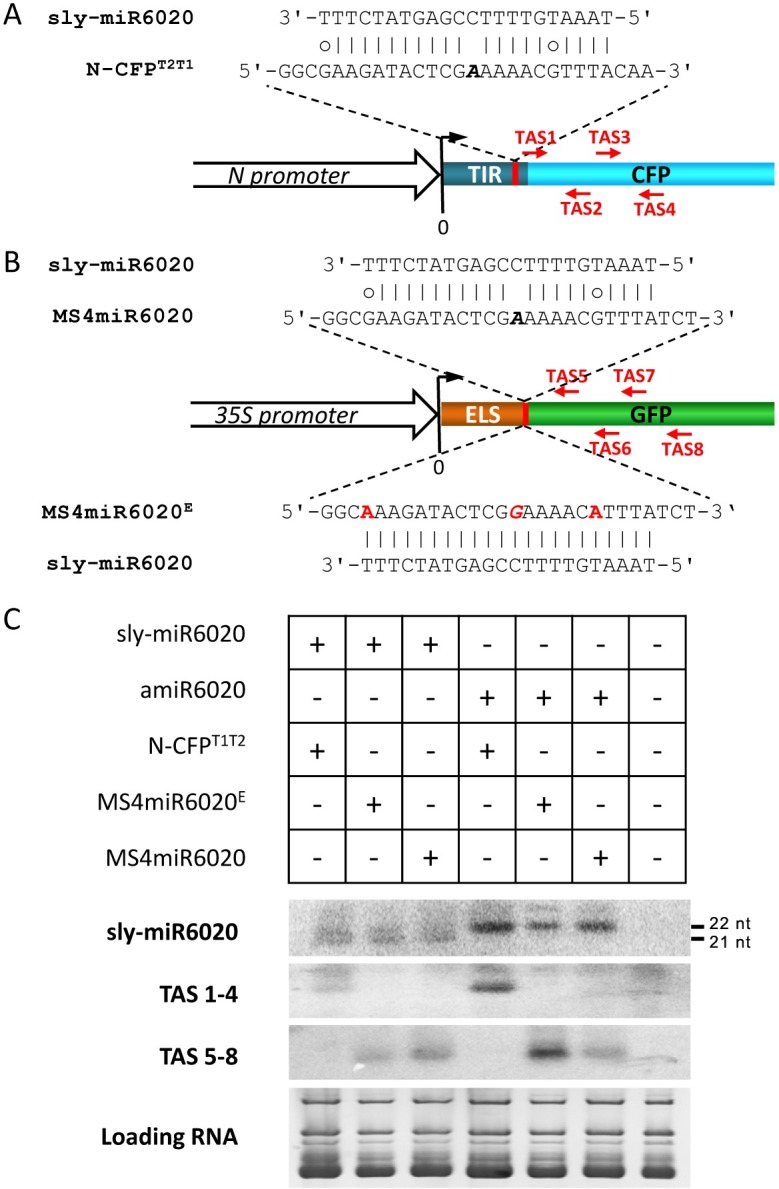
Plant genomes encode large numbers of nucleotide-binding (NB) leucine-rich repeat (LRR) immune receptors (NLR) that mediate effector triggered immunity (ETI) and play key roles in protecting crops from diseases caused by devastating pathogens. Fitness costs are associated with plant NLR genes and regulation of NLR genes by micro(mi)RNAs and phased small interfering RNAs (phasiRNA) is proposed as a mechanism for reducing these fitness costs. However, whether NLR expression and NLR-mediated immunity are regulated during plant growth is unclear. We conducted genome-wide transcriptome analysis and showed that NLR expression gradually increased while expression of their regulatory small RNAs (sRNA) gradually decreased as plants matured, indicating that sRNAs could play a role in regulating NLR expression during plant growth. We further tested the role of miRNA in the growth regulation of NLRs using the tobacco mosaic virus (TMV) resistance gene N, which was targeted by miR6019 and miR6020. We showed that N-mediated resistance to TMV effectively restricted this virus to the infected leaves of 6-week old plants, whereas TMV infection was lethal in 1- and 3-week old seedlings due to virus-induced systemic necrosis. We further found that N transcript levels gradually increased while miR6019 levels gradually decreased during seedling maturation that occurs in the weeks after germination. Analyses of reporter genes in transgenic plants showed that growth regulation of N expression was post-transcriptionally mediated by MIR6019/6020 whereas MIR6019/6020 was regulated at the transcriptional level during plant growth. TMV infection of MIR6019/6020 transgenic plants indicated a key role for miR6019-triggered phasiRNA production for regulation of N-mediated immunity. Together our results demonstrate a mechanistic role for miRNAs in regulating innate immunity during plant growth.


Conflict of interest statement

The authors have declared that no competing interests exist.

Figures

Fig 1
Fig 1. Regulation of the majority of NLRs by sRNAs in D51 tomato plants during growth.
(A) Venn diagram for numbers of NLR silencers targeting different classes of NLRs in tomato. Three circles represent the number of silencers targeting TNL, CNL and NL, respectively, as indicated in each circle. Numbers next to each circle indicate the number of silencer targeted NLR genes out of the total numbers in each class. (B) Venn diagram for numbers of secondary siRNAs derived from different class of NLRs in tomato. Three circles represent secondary siRNAs derived from TNL, CNL and NL, respectively, as indicated in each circle. Numbers next to each circle indicate the number of NLR genes with secondary siRNAs out of the total number in each class. (C) Expression profile of the conserved miR156 members. (D) TNL (left), CNL (middle) and NL (right) silencer expression profile at 1-, 3- and 6 WAG stages. Open square, 22-nt silencer; open circle, non-22-nt silencer. Each line represents an individual silencer. (E) TNL (left), CNL (middle) and NL (right) secondary siRNA expression profile at 1, 3 and 6 WAG stages. Filled square, TIR of TNL; filled circle, CC of CNL; filled triangle, N-terminal region of NL; open triangle, NBS region of all NLR; open diamond, LRR region of all NLR. Each line represents an individual gene. (F) TNL (left), CNL (middle) and NL (right) gene expression profile at 1-, 3- and 6 WAG stages. Each line represents an individual gene. (G) The box plot of data in E. Asterisks indicate statistically significant differences between expression levels of NLRs at two time-points (*, 0.01<P<0.05; **, P<0.01). The statistical analysis was conducted using the R t.test method and plotted using the R ggplot2 package. Y axes are all in TPM units.
Fig 2
Fig 2. N-mediated resistance to TMV is regulated during TG34 seedling growth.
(A-C) Untreated TG34 seedlings at 1, 3 and 6 WAG, which are labeled 1W, 3W and 6W, respectively in all of the figures. (D-F) TMV-infected 1-, 3- and 6 WAG seedlings at 2 DPI. Red arrows show HR on the infected leaves. The boxed area shows an enlargement of the HR area. (G-I) TMV-infected 1-, 3- and 6 WAG seedlings at 7 DPI. (J) TMV-infected 6 WAG plant at 21 DPI. The length of bars is indicated in each photo. (K) The average percentage rate of surviving TG34 plants at different times post TMV infection with the survival rates of untreated plants as controls. The plants were infected at 1, 3 and 6 WAG as indicated. Three independent experiments were performed, and the number (n) of test plants in each experiment are shown on the graph. The Y axes are in percentage units.
Fig 3
Fig 3. N expression increases as seedlings mature.
(A) Relative N transcript levels at 1-, 3- and 6 WAG were determined by quantitative real-time reverse transcription-PCR (RT-qPCR) in Nicotiana glutinosa (Glutinosa), Samsun NN, TG34 and SR1 plants. The GAPDH gene was used as the reference gene. (B) Map of the N promoter Npro::GUS construct showing the N gene promoter and GUS CDS. (C) GUS staining of Npro::GUS transgenic plants and SR1 controls at 1-, 3- and 6 WAG. The number (n) of stained plants and the length of each bar are indicated on the image. (D) The intensity of GUS staining in transgenic Npro::GUS seedlings at 1-, 3- and 6 WAG was measured by image analysis and the relative values of GUS staining intensity are plotted. (E) The relative levels of GUS mRNAs determined by qRT-PCR in Npro::GUS seedlings at 1-, 3-, and 6 WAG. The data are the means of three replicates with SD (standard deviation). Different letters indicate significant differences between the treatments according to One-Way ANOVA (analysis of variance) test (P < 0.05). Y axes all indicate relative fold differences.
Fig 4
Fig 4. Expression of nta-miR6019/6020 decreases during tobacco seedling growth.
(A) Northern blot hybridization of sRNAs isolated from TG34 plants at 1-, 3- and 6 WAG. Hybridization probes, miR6019, miR156, miR168 and miR166 are indicated to the left and probe sequences are listed in S3 Table. (B) Maps of the nta-MIR6019/6020a promoter reporter a-3kpro::GUS and nta-MIR6019/6020b promoter reporter b-2kpro::GUS constructs. Open arrows represent the a-3k or b-2k promoter, and blue boxes represent GUS CDS. (C) GUS staining of a-3kpro::GUS and b-2kpro::GUS transgenic plants and SR1 wild-type plants at 1-, 3- and 6 WAG. The number (n) of stained plants and the length of each bar are indicated on the image. (D) Intensity of GUS staining in a-3kpro::GUS and b-2kpro::GUS transgenic seedlings at 1, 3 and 6WAG. GUS activity was quantified using the average gray values that are plotted on the Y-axis. (E) Relative GUS mRNA levels determined by qRT-PCR in a-3kpro::GUS and b-2kpro::GUS transgenic seedlings at 1-, 3- and 6WAG. The data are the means of three replicates with SD. Different letters indicate significant differences between the treatments according to a one-way ANOVA test (P < 0.05). Y axes all indicate relative fold.
Fig 5
Fig 5. nta-miR6019/6020 regulates N gene expression and function during seedling growth.
(A) Maps of N-CFPT2T1 and N-CFPt2t1 constructs. The sequences of wild type and mutated miR6019/miR6020 binding sites are shown above and below the map. (B) Relative CFP transcript levels measured by RT-qPCR at 1-, 3- and 6 WAG in N-CFPT2T1 and N-CFPt2t1 transgenic plants. The GAPDH gene was used as the reference gene. CFP levels in 1 WAG N-CFPT2T1 is considered 1. (C) Secondary structures of wild type and AXC mutants of nta-MIR6019. Mature miRNA and miRNA star sequences are highlighted in red. (D) Northern blot hybridization of sRNAs isolated from nta-MIR6019WT/NN and nta-MIR6019AXC/NN transgenic plants and both TG34 and SR1 plants at 6 WAG. Small RNA sizes are indicated to the right. (E) Relative N transcript levels in nta-MIR6019WT/NN and nta-MIR6019AXC/NN plants, and both TG34 and SR1 seedlings at 6 WAG. The GAPDH gene was used as the reference gene. The lowest N transcript level in N-containing plants (nta-MIR6019WT/NN-3) is considered as 1. (F) nta-MIR6019WT/NN and nta-MIR6019AXC/NN transgenic plants and both TG34 and SR1 plants inoculated with TMV at 6 WAG. The total number (n) of test plants is indicated on the image. Bars = 1cm. The data are the means of three replicates with SD. Different letters indicate significant differences between the treatments according to one-way ANOVA test (P < 0.05). Y axes indicate relative fold change.
Fig 6
Fig 6. Regulation of N-gene-mediated resistance to TMV during D51 tomato growth.
(A-C) Untreated plants at 1-, 3- and 6 WAG stages. (D-F) Plants inoculated with TMV at 1-, 3- and 6 WAG stages and photographed at 7 DPI. Arrows show the HR on the inoculated leaves. The boxed area represents enlargement of the SHR area in the systemic leaves. (G-I) Plants inoculated with TMV at 1-, 3- and 6 WAG and photographed at 21 DPI. The length of bars is labeled on each photo. (J) The average percentage rate of surviving D51 plants at different time post TMV infection with the survival rates of untreated plants as controls. The plants were infected at 1-, 3- and 6 WAG as indicated. Three independent replicates were performed. The total number (n) of plants is shown on the line chart. Y axes are in percentage units.
Fig 7
Fig 7. miR6019/6020 family is conserved in the Solanaceae plant family.
(A) Relative N transcript levels in tomato D51 (blue) and VF36 (red) plants at 1-, 3- and 6 WAG stages as determined by qRT-PCR. (B) Mature miR6019 and miR6020 sequences from different Solanaceae plants are paired to the TIR coding sequences of the N gene. The sequence logo of the TIR amino acid sequences encoded by the miR6019/6020 target sequence is shown. N sequences highlighted in red represent the binding sites for the miR6019 and miR6020 seed sequences. Polymorphic nucleotides in mature miR6020 are highlighted in red. (C) Secondary structures of the N. benthamiana and S. lycopersicum miR6019/6020 precursors. Mature miRNA and miR star are highlighted in red. (D) Levels of tomato miR6020 and secondary siRNAs derived from the coding region of N at 1-, 3- and 6 WAG stages. (E) Levels of tobacco secondary siRNAs derived from the coding region of N at 1-, 3- and 6 WAG stages. The data are the means of three replicates with SD. Different letters indicate significant differences between the treatments according to one-way ANOVA test (P < 0.05). The Y axes in A indicate relative fold. The Y axes in D and E are in TPM units.
Fig 8
Fig 8. Sly-MIR6020 generates 22-nt miRNA and triggers phasiRNA production.
(A) Map of sly-miR6020::N-CFPT2T1 sequence alignment and four CFP-phasiRNA (red arrows) down-stream of the miR6020 binding site. The sequence of sly-miR6020 binding site (red area) is shown above the N-CFPT2T1 construct map. Bases in italics indicate the cleavage site. (B) A map of sly-miR6020::MS4miR6020 sequence alignment and four GFP-phasiRNA (red arrows) down-stream of the miR6020 binding site. The sequences of sly-miR6020 binding site (red area) in MS4miR6020 and MS4miR6020E are shown above and below the construct map respectively. Bases in italics indicate the cleavage site. The mutated bases are indicated in red. ELS, Endoplasmic reticulum (ER) localization signal. (C) Northern blot detection of phasiRNAs triggered by sly-miR6020. Probes are indicated to the left. EB staining of tRNA and rRNA serves as a loading control.

Similar articles

Cited by

References

    1. Caplan J, Padmanabhan M, Dinesh-Kumar SP. Plant NB-LRR immune receptors: from recognition to transcriptional reprogramming. Cell Host Microbe. 2008;3(3):126–35. doi: 10.1016/j.chom.2008.02.010 . - DOI - PubMed
    1. Meyers BC, Kozik A, Griego A, Kuang H, Michelmore RW. Genome-wide analysis of NBS-LRR-encoding genes in Arabidopsis. Plant Cell. 2003;15(4):809–34. doi: 10.1105/tpc.009308 ; PubMed Central PMCID: PMCPMC152331. - DOI - PMC - PubMed
    1. Kawai T, Akira S. The roles of TLRs, RLRs and NLRs in pathogen recognition. Int Immunol. 2009;21(4):317–37. doi: 10.1093/intimm/dxp017 ; PubMed Central PMCID: PMCPMC2721684. - DOI - PMC - PubMed
    1. Kollmann TR, Levy O, Montgomery RR, Goriely S. Innate immune function by Toll-like receptors: distinct responses in newborns and the elderly. Immunity. 2012;37(5):771–83. doi: 10.1016/j.immuni.2012.10.014 ; PubMed Central PMCID: PMCPMC3538030. - DOI - PMC - PubMed
    1. Chen XM. microRNA biogenesis and function in plants. Febs Letters. 2005;579(26):5923–31. doi: 10.1016/j.febslet.2005.07.071 WOS:000233002500013. - DOI - PMC - PubMed

Publication types

MeSH terms