
Prospects for Genomic Selection in Cassava Breeding

Marnin D Wolfe et al. Plant Genome. 2017 Nov.

Abstract

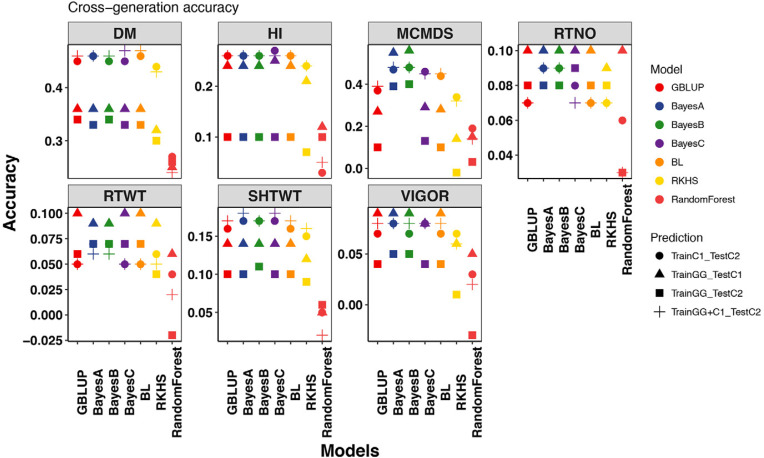
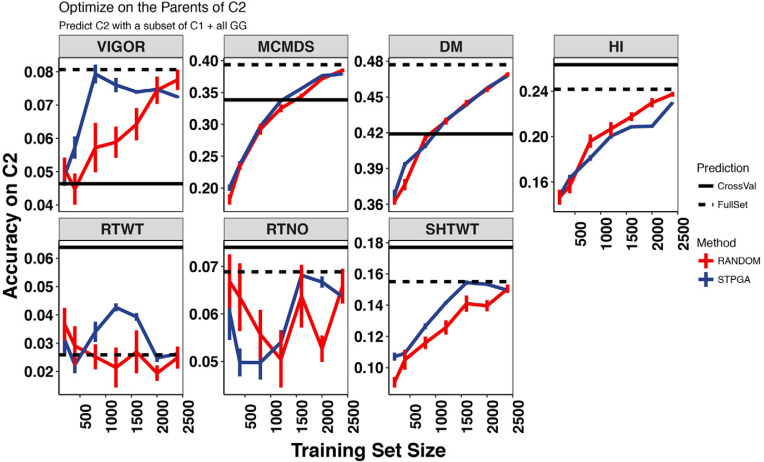
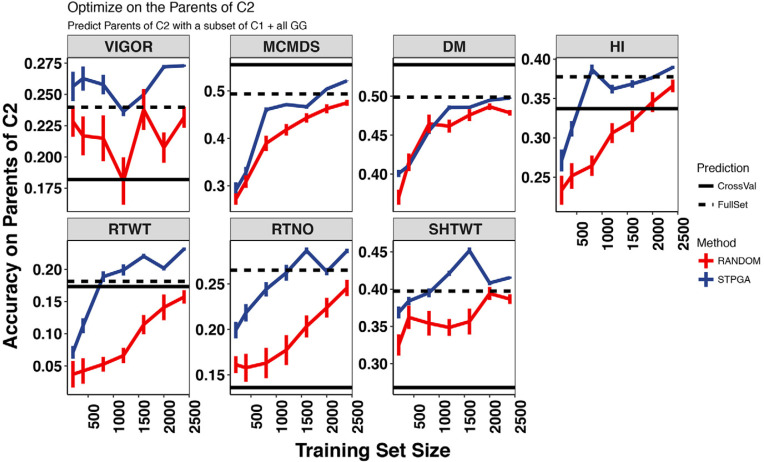
Cassava ( Crantz) is a clonally propagated staple food crop in the tropics. Genomic selection (GS) has been implemented at three breeding institutions in Africa to reduce cycle times. Initial studies provided promising estimates of predictive abilities. Here, we expand on previous analyses by assessing the accuracy of seven prediction models for seven traits in three prediction scenarios: cross-validation within populations, cross-population prediction and cross-generation prediction. We also evaluated the impact of increasing the training population (TP) size by phenotyping progenies selected either at random or with a genetic algorithm. Cross-validation results were mostly consistent across programs, with nonadditive models predicting of 10% better on average. Cross-population accuracy was generally low (mean = 0.18) but prediction of cassava mosaic disease increased up to 57% in one Nigerian population when data from another related population were combined. Accuracy across generations was poorer than within-generation accuracy, as expected, but accuracy for dry matter content and mosaic disease severity should be sufficient for rapid-cycling GS. Selection of a prediction model made some difference across generations, but increasing TP size was more important. With a genetic algorithm, selection of one-third of progeny could achieve an accuracy equivalent to phenotyping all progeny. We are in the early stages of GS for this crop but the results are promising for some traits. General guidelines that are emerging are that TPs need to continue to grow but phenotyping can be done on a cleverly selected subset of individuals, reducing the overall phenotyping burden.


Conflict of interest statement

The authors declare that there is no conflict of interest.

Figures

Fig. 1
Fig. 1
Schematic of a conventional cassava breeding cycle. Arrows between trials indicate the selection of materials for further phenotyping trials. Red arrows indicate the selection of materials as parents for crossing.
Fig. 2
Fig. 2
Schematic of International Institute of Tropical Agriculture (IITA) genomic selection, 2012–2015. Three generations of the IITA genomic selection program are illustrated here. From the genetic gain (GG) population, 85 parents were selected and crosses over 2 yr (‘TMS13F’ in 2012–2013 and ‘TMS14F’ in 2013–2014) gave rise to 2890 Cycle 1 (C1) progeny. Predictions based on data from the GG were used to select 89 parents from among C1 in 2013, giving rise to 1648 Cycle 2 (C2) progeny in 2014. The GG were clonally evaluated in 2013–2014 and 2014–2015. The ‘TMS13’ C1 progeny were evaluated in 2013–2014 and 2014–2015. The ‘TMS14’ C1 progeny were evaluated with the C2 progeny in 2014–2015.
Fig. 3
Fig. 3
Schematic of genomic selection with training population optimization carried out by STPGA. The selection was initially made among available genotyped candidates on the basis of genomic predictions with available phenotype data. Selected parents are grown and mated in a crossing block. The resulting Cycle 1 (C1) seeds are subsequently collected and grown in a nursery. Cycle 1 seedlings were genotyped by genotyping-by-sequencing (GBS) and selections were made on the basis of genomic prediction alone. Selected parents of Cycle 2 (C2) were cloned into a crossing nursery. STPGA was used to select the optimal additional C1 seedlings to plant in a clonal evaluation trial. Because C2 seedlings do not yet exist, STPGA was instead used to select the optimal C1 seedlings to predict the selected parents of C2. Phenotypes from the C1 clonal evaluation were added to the existing genomic prediction training dataset. The updated training model will be used to predict breeding values of theC2 seedlings when the GBS data become available and the selections of the parents of Cycle 3 (C3) is made. Subsequent cycles will proceed following this procedure.
Fig. 4
Fig. 4
Hierarchical clustering of genomic prediction models based on cross-validated genomic estimated breeding values (GEBVs). Height on the y-axis refers to the value of the dissimilarity criterion. (A) Clustering of prediction models in the National Root Crops Research Institute (NRCRI) population. (B) Clustering of prediction models in the National Crops Resources Research Institute (NaCRRI) population. (C) Clustering of prediction models in the Genetic Gain (GG) population. GBLUP, genomic best linear unbiased predictor; BL, Bayesian Lasso; RF, random forest; RKHS, reproducing kernel Hilbert spaces multikernel model.
Fig. 5
Fig. 5
Plot of cross-generation prediction accuracies. Seven genomic prediction methods were tested for seven traits (panels). For each model (colors, x-axis within panels), four predictions were made: Genetic Gain (GG) predicting Cycle 1 (C1), GG predicting (Cycle 2) C2, C1 predicting C2, and GG + C1 predicting C2, indicated by shapes. All data are from the International Institute for Tropical Agriculture (IITA) genomic selection program. DM, dry matter content; HI, harvest index; RTWT, root weight; RTNO, root number; SHTWT, shoot weight; MCMDS, mean cassava mosaic disease severity; VIGOR, early plant vigor.
Fig. 6
Fig. 6
The relationship between training set size and the accuracy of predicting the International Institute for Tropical Agriculture Cycle 2 (C2) (across generations). The accuracy of prediction for seven traits (panels) with the IITA Genetic Gain (GG) population training data plus data from different sized subsets (x-axis) of their progeny, Cycle 1 (C1) is shown. Subsets of a given size were selected either at random or with the genetic algorithm implemented in the R package STPGA. Ten random and 10 STPGA-selected subsets were made for each training set size. Error bars are the SE around the mean for the ten samples. Horizontal black lines show the mean crossvalidation accuracy for C2 (validation set; solid line) and the accuracy of the full set of GG + C1 predicting C2 (dashed line). DM, dry matter content; HI, harvest index; RTWT, root weight; RTNO, root number; SHTWT, shoot weight; MCMDS, mean cassava mosaic disease severity; VIGOR, early plant vigor.
Fig. 7
Fig. 7
The relationship between training set size and the accuracy of predicting the parents of Cycle 2 (C2) [from Cycle 1 (C1), withingeneration). The accuracy of the predictions for seven traits (panels) with the International Institute for Tropical Agriculture Genetic Gain (GG) population training data plus data from different sized subsets (x-axis) of their progeny, Cycle 1 is shown. Subsets of a given size were selected either at random or with the genetic algorithm implemented in the R package STPGA. Ten random and 10 STPGAselected subsets were made for each training set size. Error bars are the SE around the mean for the 10 samples. Horizontal black lines show the mean cross-validation accuracy for C1 (validation set; solid line) and the accuracy of the full set of GG + C1 predicting the parents of C2 (dashed line). DM, dry matter content; HI, harvest index; RTWT, root weight; RTNO, root number; SHTWT, shoot weight; MCMDS, mean cassava mosaic disease severity; VIGOR, early plant vigor.

References

    1. Akano O., Dixon O, Mba C, Barrera E, and Fregene M. 2002. Genetic mapping of a dominant gene conferring resistance to cassava mosaic disease. Theor. Appl. Genet. 105(4):521–525. doi:10.1007/s00122-002-0891-7 - DOI - PubMed
    1. Akdemir D., and Okeke U.G. 2015. EMMREML : Fitting mixed models with known covariance structures. https://CRAN.R-project.org/package=EMMREML (accessed 30 Aug. 2017).
    1. Akdemir D., Sanchez J.I, and Jannink J.-L. 2015. Optimization of genomic selection training populations with a genetic algorithm. Genet. Sel. Evol. 47(1):38. doi:10.1186/s12711-015-0116-6 - DOI - PMC - PubMed
    1. Bamidele O.P., Fasogbon M.B, Oladiran D.A, and Akande E.O. 2015. Nutritional composition of fufu analog flour produced from Cassava root (Manihot esculenta) and Cocoyam (Colocasia esculenta) tuber. Food Sci. Nutr. 3(6):597–603. doi:10.1002/fsn3.250 - DOI - PMC - PubMed
    1. Barabaschi D., Tondelli A, Desiderio F, Volante A, Vaccino P, Vale G, et al. . 2015. Next generation breeding. Plant Sci. 242:3–13. doi:10.1016/j.plantsci.2015.07.010 - DOI - PubMed

Publication types

LinkOut - more resources