. 2018 Feb 1;141(2):550-567.
doi: 10.1093/brain/awx347.

Tau burden and the functional connectome in Alzheimer's disease and progressive supranuclear palsy

Affiliations

Tau burden and the functional connectome in Alzheimer's disease and progressive supranuclear palsy

Thomas E Cope et al. Brain. .

Abstract

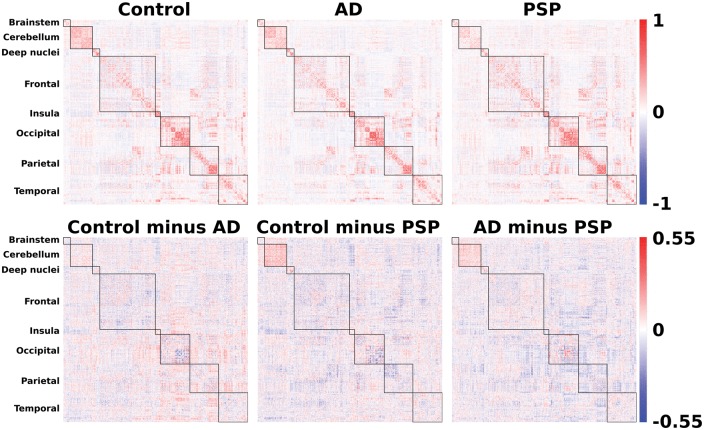
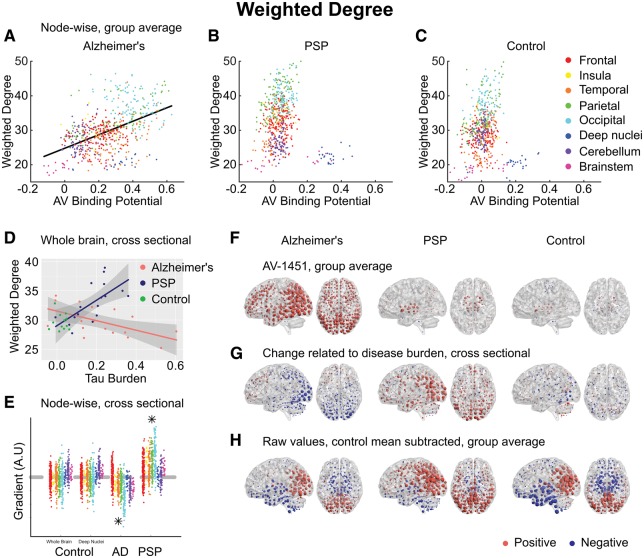
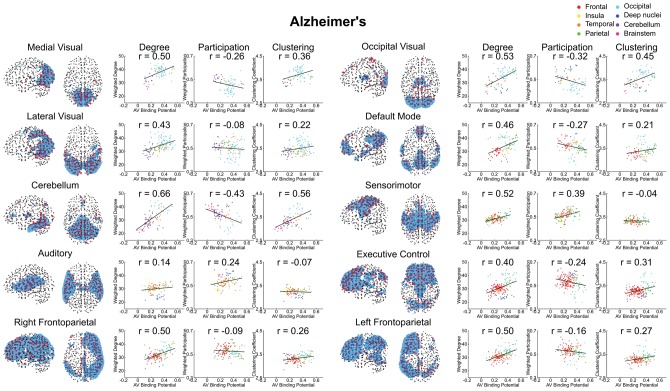
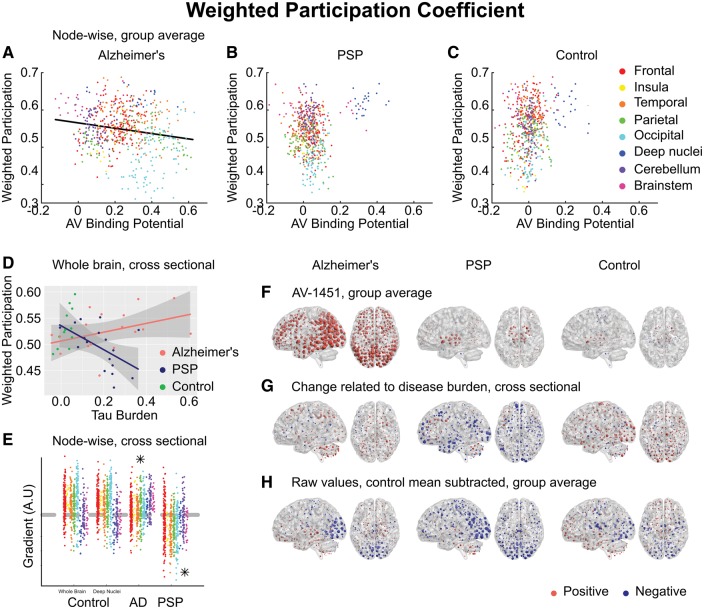
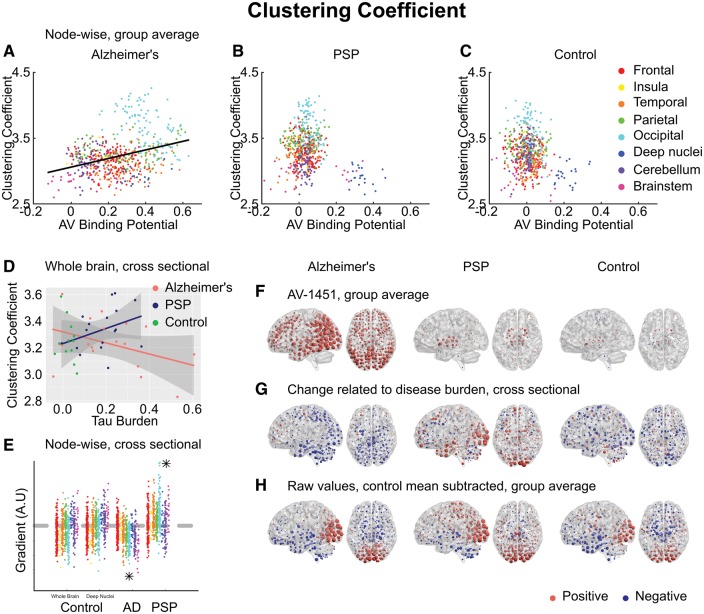
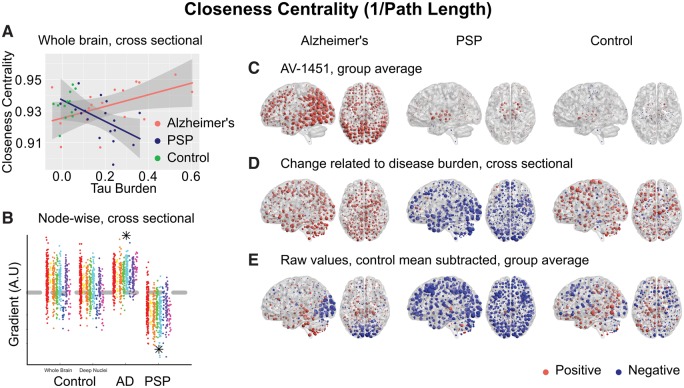
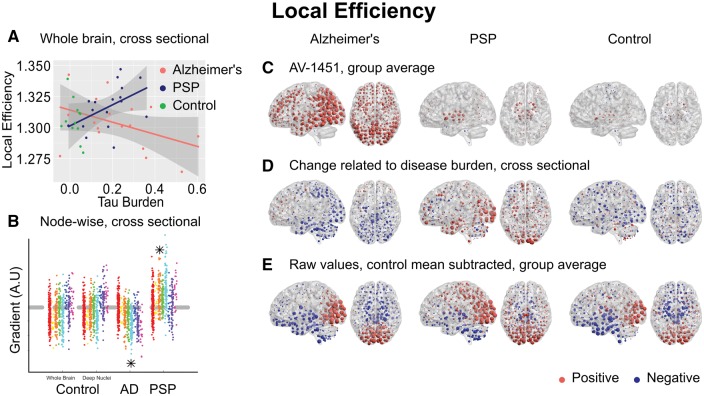
Alzheimer's disease and progressive supranuclear palsy (PSP) represent neurodegenerative tauopathies with predominantly cortical versus subcortical disease burden. In Alzheimer's disease, neuropathology and atrophy preferentially affect 'hub' brain regions that are densely connected. It was unclear whether hubs are differentially affected by neurodegeneration because they are more likely to receive pathological proteins that propagate trans-neuronally, in a prion-like manner, or whether they are selectively vulnerable due to a lack of local trophic factors, higher metabolic demands, or differential gene expression. We assessed the relationship between tau burden and brain functional connectivity, by combining in vivo PET imaging using the ligand AV-1451, and graph theoretic measures of resting state functional MRI in 17 patients with Alzheimer's disease, 17 patients with PSP, and 12 controls. Strongly connected nodes displayed more tau pathology in Alzheimer's disease, independently of intrinsic connectivity network, validating the predictions of theories of trans-neuronal spread but not supporting a role for metabolic demands or deficient trophic support in tau accumulation. This was not a compensatory phenomenon, as the functional consequence of increasing tau burden in Alzheimer's disease was a progressive weakening of the connectivity of these same nodes, reducing weighted degree and local efficiency and resulting in weaker 'small-world' properties. Conversely, in PSP, unlike in Alzheimer's disease, those nodes that accrued pathological tau were those that displayed graph metric properties associated with increased metabolic demand and a lack of trophic support rather than strong functional connectivity. Together, these findings go some way towards explaining why Alzheimer's disease affects large scale connectivity networks throughout cortex while neuropathology in PSP is concentrated in a small number of subcortical structures. Further, we demonstrate that in PSP increasing tau burden in midbrain and deep nuclei was associated with strengthened cortico-cortical functional connectivity. Disrupted cortico-subcortical and cortico-brainstem interactions meant that information transfer took less direct paths, passing through a larger number of cortical nodes, reducing closeness centrality and eigenvector centrality in PSP, while increasing weighted degree, clustering, betweenness centrality and local efficiency. Our results have wide-ranging implications, from the validation of models of tau trafficking in humans to understanding the relationship between regional tau burden and brain functional reorganization.

Keywords: Alzheimer’s disease; functional connectivity; graph theory; progressive supranuclear palsy; tau.


Figures

Figure 1
Figure 1
Connectivity matrices. Top: Association matrices derived from resting state (task-free) functional MRI. Bottom: Pairwise subtractions of the Fisher-z transformed association matrices to illustrate the large scale within and between-region disease-related changes in functional connectivity. AD = Alzheimer’s disease.
Figure 2
Figure 2
Weighted degree. (A–C) Group-averaged connection strength at each node, quantified by weighted degree, plotted against 18F-AV-1451 binding potential at that node. A statistically significant linear relationship was demonstrated only in Alzheimer’s disease (AD) (Pearson’s r = 0.48, P < 0.0001, Spearman’s rho = 0.48, P < 0.0001), and the corresponding regression line is plotted for this group. (D) Between-subjects analysis of the relationship between global tau burden and each weighted degree at a network density of 6%. No significant relationship was found for the control subjects with either method of assessing tau burden—for simplicity only their whole-brain average points are illustrated here. Moderation analysis for a differential relationship between graph metric and tau burden in the two disease groups (Alzheimer’s disease and PSP) was statistically significant. (E) The magnitude of disease-related change at each node is plotted as a single point, grouped by lobe. Control data are shown for both methods of assessing tau burden. Stars represent statistically significant excesses of positive or negative gradients in the disease groups. (F) Average 18F-AV-1451 binding potential at each node. Red spheres represent increases compared to the cerebellar reference region. Blue spheres represent decreases. The centre of the sphere is placed at the centre of the region of interest. The radius of each sphere is linearly related to the magnitude of binding at that node. All groups are scaled identically. (G) The local tau burden-related change in weighted degree is plotted for each group at each node. Red spheres represent local increases as a result of greater overall tau burden; blue spheres represent local decreases. The radius of each sphere is linearly related to the magnitude of disease-related change at that node across the whole range of disease burden observed in each group. All groups are scaled identically. Control images are based on the whole-brain method of assessing tau burden. (H) Average raw values for weighted degree within each group. The control mean for each metric is subtracted at every node. Red spheres represent increases compared to the control mean value. Blue spheres represent decreases. The centre of the sphere is placed at the centre of the region of interest. The radius of each sphere is linearly related to the difference from the control mean at that node. All groups are scaled identically.
Figure 3
Figure 3
Alzheimer’s disease comparison of the three graph metrics representing the three principal hypotheses of hub vulnerability. Broken down by intrinsic connectivity network defined from Smith et al. (2009). The group-averaged graph metric at each node within a network is plotted against 18F-AV-1451 binding potential at that node. The Pearson correlation coefficient is noted in each case. Only weighted degree demonstrated a consistent relationship across all networks in keeping with its related hypothesis.
Figure 4
Figure 4
Weighted participation coefficient. (A–C) Group-averaged weighted participation coefficient at each node, plotted against 18F-AV-1451 binding potential at that node. A negative relationship was observed in Alzheimer’s disease (AD), in violation of the metabolic demand hypothesis. (D) Between-subjects analysis of the relationship between global tau burden and participation coefficient at a network density of 6%. No significant relationship was found for the control subjects with either method of assessing tau burden. Moderation analysis for a differential relationship between graph metric and tau burden in the two disease groups (Alzheimer’s disease and PSP) was statistically significant. (E) The magnitude of disease related change at each node is plotted as a single point, grouped by lobe. Control data are shown for both methods of assessing tau burden. Stars represent statistically significant excesses of positive or negative gradients in the disease groups. (F) Average 18F-AV-1451 binding potential at each node. Red spheres represent increases compared to the cerebellar reference region. Blue spheres represent decreases. The centre of the sphere is placed at the centre of the region of interest. The radius of each sphere is linearly related to the magnitude of binding at that node. All groups are scaled identically. (G) The local tau burden-related change in participation coefficient is plotted for each group at each node. Red spheres represent local increases as a result of greater overall tau burden; blue spheres represent local decreases. The radius of each sphere is linearly related to the magnitude of disease-related change at that node across the whole range of disease burden observed in each group. All groups are scaled identically. Control images are based on the whole-brain method of assessing tau burden. (H) Average raw values for participation coefficient within each group. The control mean for each metric is subtracted at every node. Red spheres represent increases compared to the control mean value. Blue spheres represent decreases. The centre of the sphere is placed at the centre of the region of interest. The radius of each sphere is linearly related to the difference from the control mean at that node. All groups are scaled identically.
Figure 5
Figure 5
Clustering coefficient. (A–C) Group-averaged clustering coefficient at each node, plotted against 18F-AV-1451 binding potential at that node. A positive relationship was observed in Alzheimer’s disease (AD), in violation of the trophic support hypothesis. (D) Between-subjects analysis of the relationship between global tau burden and clustering coefficient at a network density of 6%. No significant relationship was found for the control subjects with either method of assessing tau burden. Moderation analysis for a differential relationship between graph metric and tau burden in the two disease groups (Alzheimer’s disease and PSP) was statistically significant. (E) The magnitude of disease related change at each node is plotted as a single point, grouped by lobe. Control data are shown for both methods of assessing tau burden. Stars represent statistically significant excesses of positive or negative gradients in the disease groups. (F) Average 18F-AV-1451 binding potential at each node. Red spheres represent increases compared to the cerebellar reference region. Blue spheres represent decreases. The centre of the sphere is placed at the centre of the region of interest. The radius of each sphere is linearly related to the magnitude of binding at that node. All groups are scaled identically. (G) The local tau burden-related change in clustering coefficient is plotted for each group at each node. Red spheres represent local increases as a result of greater overall tau burden; blue spheres represent local decreases. The radius of each sphere is linearly related to the magnitude of disease-related change at that node across the whole range of disease burden observed in each group. All groups are scaled identically. Control images are based on the whole-brain method of assessing tau burden. (H) Average raw values for clustering coefficient within each group. The control mean for each metric is subtracted at every node. Red spheres represent increases compared to the control mean value. Blue spheres represent decreases. The centre of the sphere is placed at the centre of the region of interest. The radius of each sphere is linearly related to the difference from the control mean at that node. All groups are scaled identically.
Figure 6
Figure 6
Closeness centrality (1/path length from each node to all other nodes). (A) Between-subjects analysis of the relationship between global tau burden and closeness centrality at a network density of 6%. No significant relationship was found for the control subjects with either method of assessing tau burden. Moderation analysis for a differential relationship between graph metric and tau burden in the two disease groups [Alzheimer’s disease (AD) and PSP] was statistically significant. (B) The magnitude of disease related change at each node is plotted as a single point, grouped by lobe. Control data are shown for both methods of assessing tau burden. Stars represent statistically significant excesses of positive or negative gradients in the disease groups (Supplementary Table 2). (C) Average 18F-AV-1451 binding potential at each node. Red spheres represent increases compared to the cerebellar reference region. Blue spheres represent decreases. The centre of the sphere is placed at the centre of the region of interest. The radius of each sphere is linearly related to the magnitude of binding at that node. All groups are scaled identically. (D) The local tau burden-related change in closeness centrality is plotted for each group at each node. Red spheres represent local increases as a result of greater overall tau burden; blue spheres represent local decreases. The radius of each sphere is linearly related to the magnitude of disease-related change at that node across the whole range of disease burden observed in each group. All groups are scaled identically. Control images are based on the whole-brain method of assessing tau burden. (E) Average raw values for closeness centrality within each group. The control mean for each metric is subtracted at every node. Red spheres represent increases compared to the control mean value. Blue spheres represent decreases. The centre of the sphere is placed at the centre of the region of interest. The radius of each sphere is linearly related to the difference from the control mean at that node. All groups are scaled identically.
Figure 7
Figure 7
Local efficiency. (A) Between-subjects analysis of the relationship between global tau burden and local efficiency at a network density of 6%. No significant relationship was found for the control subjects with either method of assessing tau burden. Moderation analysis for a differential relationship between graph metric and tau burden in the two disease groups [Alzheimer’s disease (AD) and PSP] was statistically significant. (B) The magnitude of disease related change at each node is plotted as a single point, grouped by lobe. Control data are shown for both methods of assessing tau burden. Stars represent statistically significant excesses of positive or negative gradients in the disease groups (Supplementary Table 2). (C) Average 18F-AV-1451 binding potential at each node. Red spheres represent increases compared to the cerebellar reference region. Blue spheres represent decreases. The centre of the sphere is placed at the centre of the region of interest. The radius of each sphere is linearly related to the magnitude of binding at that node. All groups are scaled identically. (D) The local tau burden-related change in local efficiency is plotted for each group at each node. Red spheres represent local increases as a result of greater overall tau burden; blue spheres represent local decreases. The radius of each sphere is linearly related to the magnitude of disease-related change at that node across the whole range of disease burden observed in each group. All groups are scaled identically. Control images are based on the whole-brain method of assessing tau burden. (E) Average raw values for local efficiency within each group. The control mean for each metric is subtracted at every node. Red spheres represent increases compared to the control mean value. Blue spheres represent decreases. The centre of the sphere is placed at the centre of the region of interest. The radius of each sphere is linearly related to the difference from the control mean at that node. All groups are scaled identically.

References

    1. Abdelnour F, Voss HU, Raj A. Network diffusion accurately models the relationship between structural and functional brain connectivity networks. Neuroimage 2014; 90: 335–47. - PMC - PubMed
    1. Ahmed Z, Cooper J, Murray TK, Garn K, McNaughton E, Clarke H, et al. A novel in vivo model of tau propagation with rapid and progressive neurofibrillary tangle pathology: the pattern of spread is determined by connectivity, not proximity. Acta Neuropathol 2014; 127: 667–83. - PMC - PubMed
    1. Albert ML, Feldman RG, Willis AL. The ‘subcortical dementia’ of progressive supranuclear palsy. J Neurol Neurosurg Psychiatry 1974; 37: 121–30. - PMC - PubMed
    1. Alexander-Bloch AF, Gogtay N, Meunier D, Birn R, Clasen L, Lalonde F, et al. Disrupted modularity and local connectivity of brain functional networks in childhood-onset schizophrenia. Front Syst Neurosci 2010; 4: 147. - PMC - PubMed
    1. Appel SH. A unifying hypothesis for the cause of amyotrophic lateral sclerosis, parkinsonism, and Alzheimer disease. Ann Neurol 1981; 10: 499–505. - PubMed

Publication types

MeSH terms