. 2018 Feb 1;10(2):521-537.
doi: 10.1093/gbe/evx277.

An Evolutionary Landscape of A-to-I RNA Editome across Metazoan Species

Affiliations

An Evolutionary Landscape of A-to-I RNA Editome across Metazoan Species

Li-Yuan Hung et al. Genome Biol Evol. .

Abstract

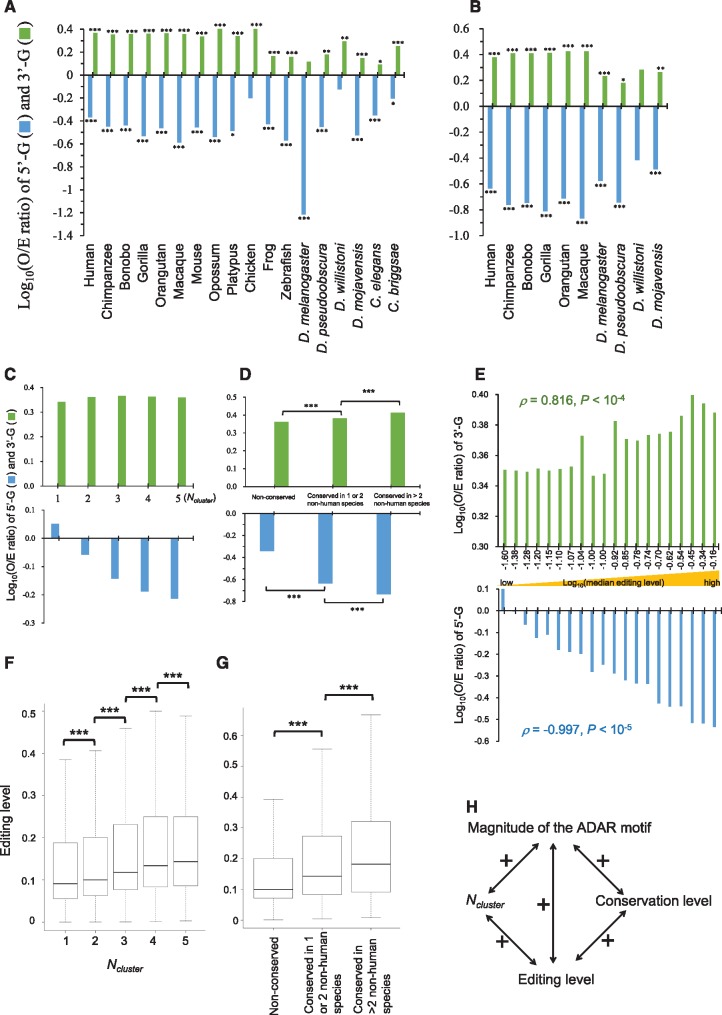
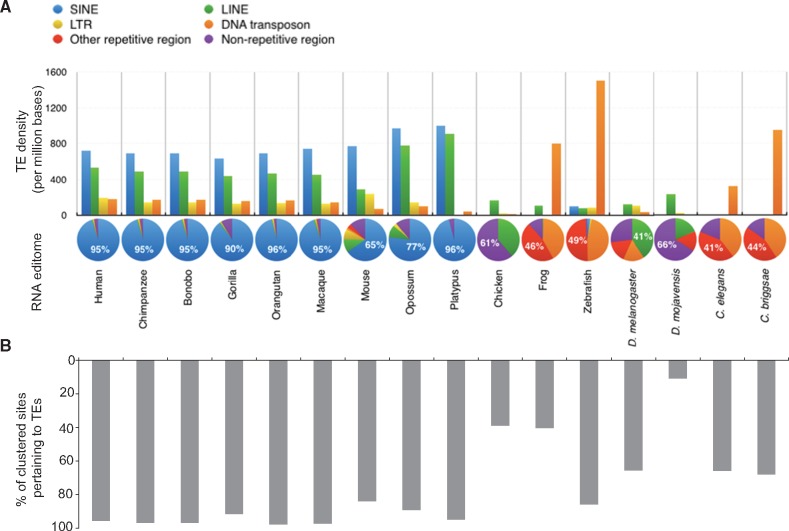
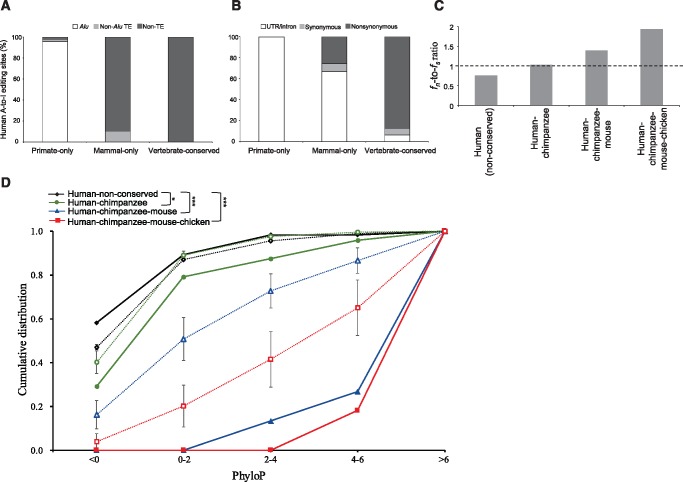
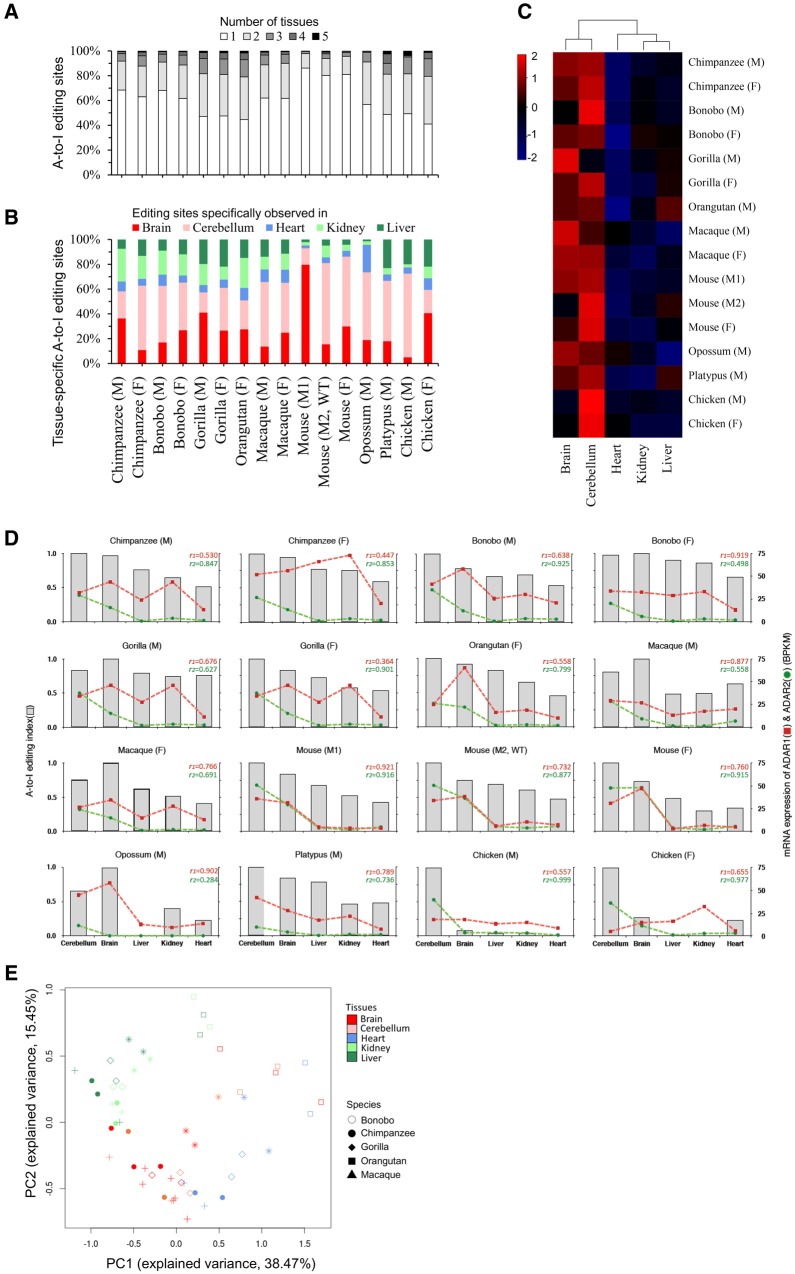
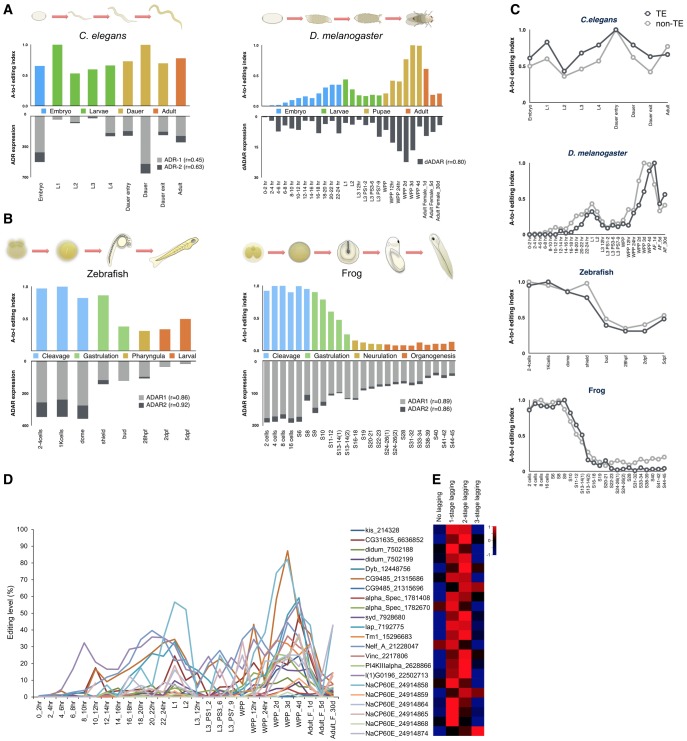
Adenosine-to-inosine (A-to-I) editing is widespread across the kingdom Metazoa. However, for the lack of comprehensive analysis in nonmodel animals, the evolutionary history of A-to-I editing remains largely unexplored. Here, we detect high-confidence editing sites using clustering and conservation strategies based on RNA sequencing data alone, without using single-nucleotide polymorphism information or genome sequencing data from the same sample. We thereby unveil the first evolutionary landscape of A-to-I editing maps across 20 metazoan species (from worm to human), providing unprecedented evidence on how the editing mechanism gradually expands its territory and increases its influence along the history of evolution. Our result revealed that highly clustered and conserved editing sites tended to have a higher editing level and a higher magnitude of the ADAR motif. The ratio of the frequencies of nonsynonymous editing to that of synonymous editing remarkably increased with increasing the conservation level of A-to-I editing. These results thus suggest potentially functional benefit of highly clustered and conserved editing sites. In addition, spatiotemporal dynamics analyses reveal a conserved enrichment of editing and ADAR expression in the central nervous system throughout more than 300 Myr of divergent evolution in complex animals and the comparability of editing patterns between invertebrates and between vertebrates during development. This study provides evolutionary and dynamic aspects of A-to-I editome across metazoan species, expanding this important but understudied class of nongenomically encoded events for comprehensive characterization.

Keywords: A-to-I RNA editing; ADAR; ADAR motif; dynamic editome; evolution.


Figures

<sc>Fig</sc>. 1.
Fig. 1.
—Identification of high-confidence A-to-I RNA editing sites, without a priori knowledge of SNP information. (A) Overview of the identification of RNA editing sites. The editing sites were identified by the clustering strategy within the same species or by cross-species comparison. The clustering process involved three main phases: Phase I: preprocessing, Phase II: ad hoc filters, and Phase III: ad hoc identification. (B) Correlation between the number of consecutive SNVs of the same type (Ncluster) and the two measures of specificity: %AG (the percentage of A-to-G & T-to-C among 12 SNV types) and FDR (the ratio of the number of G-to-A mismatches to the number of A-to-G mismatches). Histograms for each species represent A-to-G & T-to-C percentage in the subset of ≥Ncluster consecutive SNVs of the same type. The dark gray histogram for each species represents the qualified Ncluster, which satisfies both %AG > 95% and FDR < 1%.
<sc>Fig</sc>. 2.
Fig. 2.
—The cis-preference of ADARs and editing level for the detected A-to-G editing sites. (A, B) The cis-preference of ADARs (or the ADAR motif, which was measured by the observed-to-expected (O/E) ratio of the presence of “G” immediately upstream and downstream to the A-to-G editing sites) for the editing sites identified by the clustering (A) and conservation (B) strategies across metazoan species. Only the species with more than 50 detected editing sites were considered. (C) The correlation between the magnitude of the ADAR motif and the magnitude of clustering of editing sites (Ncluster) in human. (D) The correlation between the magnitude of the ADAR motif and the conservation level of editing. (E) The correlation between the magnitude of the ADAR motif and editing level (measured by the Spearman’s rank correlation). (F, G) The correlation between editing level and Ncluster (F) and the conservation level of editing (G). (H) The correlations among Ncluster, the conservation level of editing, the magnitude of the ADAR motif, and editing level. “+” represents a positive correlation. The statistical significance was evaluated using the two-tailed Fisher’s exact test (A, B, D), the Spearman’s rank correlation (E), and the two-tailed Wilcoxon rank-sum test (F, G) using the R package: *P value < 0.05, **P value < 0.01, and ***P value < 0.001.
<sc>Fig</sc>. 3.
Fig. 3.
—The relationship between the expansion of TEs and the increase of A-to-I editing sites. (A) The average numbers of TEs (i.e., SINEs, LINEs, LTRs, and DNA transposons) per million bases (top) and the compositions of A-to-I editing sites in the four types of TEs (i.e., SINE, LINE, LTR, and DNA transposon), other repetitive region, and nonrepetitive region (bottom). (B) The distribution of clustered A-to-I sites pertaining to TEs across species. TE: transposable element. SINE: short interspersed nuclear element. LINE: long interspersed nuclear element. LTR: long terminal repeat element.
<sc>Fig</sc>. 4.
Fig. 4.
—Analysis of the identified human editing events according to different conservation levels of A-to-I editing. (A, B) The distribution of human A-to-I editing sites (A) located in Alu, non-Alu TE, and non-TE regions, and (B) located in UTR/intron and editing sites leading to synonymous and nonsynonymous changes for primate-only, mammal-only, and vertebrate-conserved editing events. UTR: untranslated region. (C) The fn-to-fs ratios for human (all identified human A-to-I editing sites), human–chimpanzee shared, human–chimpanzee-mouse shared, and human–chimpanzee–mouse–chicken shared A-to-I editing sites. (D) Comparison of the conservation level of nonsynonymous A-to-I editing and conservation scores (measured by the PhyloP score). The empty diamond, circle, rectangle, and triangle represents the control (the average values of PhyloP scores of the simulation; see Materials and Methods) for each bin of the four categories of conservation, respectively. The error bar represents the standard error of the mean. The P values were estimated by the Kolmogorov–Smirnov test. *P value < 0.05 and ***P value < 0.001.
<sc>Fig</sc>. 5.
Fig. 5.
—Spatial profiling of A-to-I editing in five organs (cerebellum, brain, liver, kidney, and heart) among metazoans. (A) Analysis of tissue-specificity of A-to-I editing. (B) Distribution of tissue-specific A-to-I editing sites in varied individuals across species. (C) Clustered heatmap for A-to-I editing across five types of tissues, with rows representing accumulated editing levels of detected editing events and columns representing tissues. (D) Correlation between A-to-I editing activity and ADAR expression in the spatial context. Transcriptome-wide activities of editing were examined in the five organs from the same individual. For each individual, the highest editing level among the five organs was used to normalize the A-to-I editing index (left Y-axis; Material and Methods). ADAR expression levels were estimated in terms of BPKM (right Y-axis; Material and Methods). Pearson’s coefficient of correlation (r) (performed by the R package) was used to evaluate the correlation between A-to-I editing index and ADAR (ADAR1 (r1) and ADAR2 (r2)) expression levels. (E) PCA based on the editing levels of 589 orthologous sites in 5 organs from 5 primates. PCA was performed by the “princomp” function in the “stats” package of the R package. The distance metric between samples was calculated by 1-ρ. ρ represents pairwise Spearman’s correlation coefficient of RNA editing level between samples. M, male; F, female; WT, wild type (mouse).
<sc>Fig</sc>. 6.
Fig. 6.
—Temporal profiling of A-to-I editing among metazoans. (A, B) Temporal dynamics of A-to-I editing and ADAR expression during (A) invertebrate (C. elegans and D. melanogaster) and (B) vertebrate (zebrafish and frog) developments. For each animal, the highest editing level during development was used to normalize the A-to-I editing index (left Y-axis; see Material and Methods). ADAR expression levels were estimated in terms of BPKM (right Y-axis). Pearson's r between A-to-I editing index and ADAR expression level was calculated by considering the one-stage lagging of A-to-I editing as the fluctuation of ADAR expression during development (see the text). ADARs represent ADR-1 and ADR-2 for C. elegant, dADAR for D. melanogaster, and ADAR1 and ADAR2 for vertebrates (zebrafish and frog). (C) Temporal profiling of TE- and non-TE-associated A-to-I editing during C. elegans, D. melanogaster, zebrafish, and frog developments. For each animal, the editing levels of TE- and non-TE-associated sites were accumulated, respectively. The highest editing level during development was used to normalize the A-to-I editing index. (D) Changes in A-to-I editing levels for nonsynonymous editing sites during fly holometabolous development. (E) Heatmap representation of Pearson’s correlations (r) between editing levels of individual nonsynonymous editing sites and different levels of lagging (no lagging and one-, two-, and three-stage lagging) in dADAR expression in the matching order of (D).

Similar articles

Cited by

References

    1. Alon S, et al.2015. The majority of transcripts in the squid nervous system are extensively recoded by A-to-I RNA editing. Elife 4:e05198. - PMC - PubMed
    1. Bahn JH, et al.2012. Accurate identification of A-to-I RNA editing in human by transcriptome sequencing. Genome Res. 22(1):142–150.http://dx.doi.org/10.1101/gr.124107.111 - DOI - PMC - PubMed
    1. Bass B, et al.2012. The difficult calls in RNA editing. Interviewed by H Craig Mak. Nat Biotechnol. 30(12):1207–1209.http://dx.doi.org/10.1038/nbt.2452 - DOI - PubMed
    1. Bass BL. 2002. RNA editing by adenosine deaminases that act on RNA. Annu Rev Biochem. 71:817–846.http://dx.doi.org/10.1146/annurev.biochem.71.110601.135501 - DOI - PMC - PubMed
    1. Bazak L, et al.2014. A-to-I RNA editing occurs at over a hundred million genomic sites, located in a majority of human genes. Genome Res. 24:365–376.http://dx.doi.org/10.1101/gr.164749.113 - DOI - PMC - PubMed

Publication types

LinkOut - more resources