. 2018 Apr 6;46(6):e32.
doi: 10.1093/nar/gkx1280.

XPAT: a toolkit to conduct cross-platform association studies with heterogeneous sequencing datasets

Affiliations

XPAT: a toolkit to conduct cross-platform association studies with heterogeneous sequencing datasets

Yao Yu et al. Nucleic Acids Res. .

Abstract

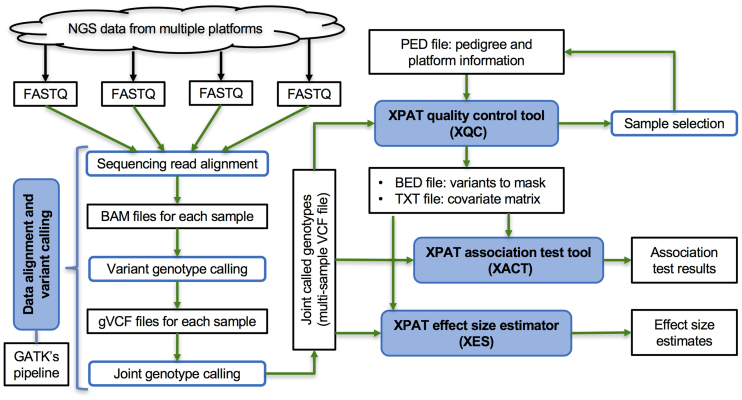
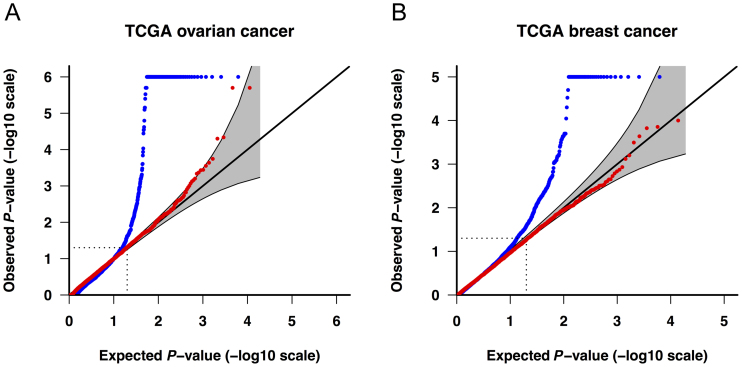
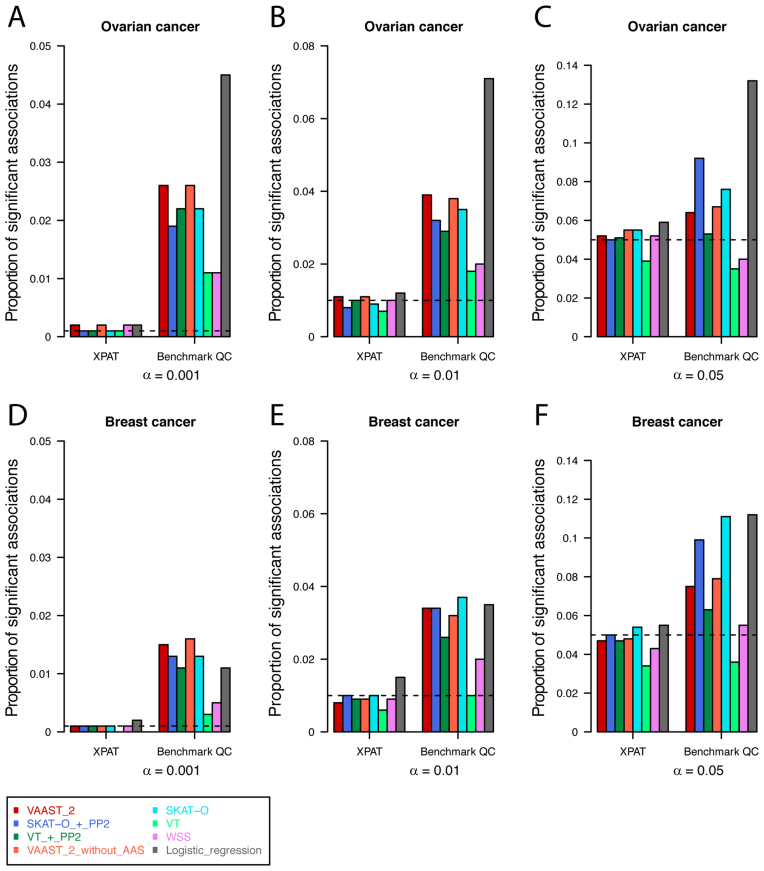
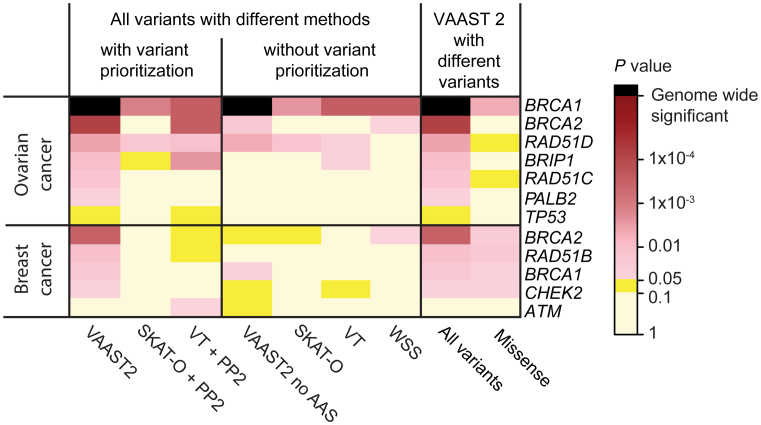
High-throughput sequencing data are increasingly being made available to the research community for secondary analyses, providing new opportunities for large-scale association studies. However, heterogeneity in target capture and sequencing technologies often introduce strong technological stratification biases that overwhelm subtle signals of association in studies of complex traits. Here, we introduce the Cross-Platform Association Toolkit, XPAT, which provides a suite of tools designed to support and conduct large-scale association studies with heterogeneous sequencing datasets. XPAT includes tools to support cross-platform aware variant calling, quality control filtering, gene-based association testing and rare variant effect size estimation. To evaluate the performance of XPAT, we conducted case-control association studies for three diseases, including 783 breast cancer cases, 272 ovarian cancer cases, 205 Crohn disease cases and 3507 shared controls (including 1722 females) using sequencing data from multiple sources. XPAT greatly reduced Type I error inflation in the case-control analyses, while replicating many previously identified disease-gene associations. We also show that association tests conducted with XPAT using cross-platform data have comparable performance to tests using matched platform data. XPAT enables new association studies that combine existing sequencing datasets to identify genetic loci associated with common diseases and other complex traits.


Figures

Figure 1.
Figure 1.
Diagram of the components of XPAT. The four modules in XPAT are shown in blue boxes. The input, output and intermediate files are shown in black.
Figure 2.
Figure 2.
Q–Q plots of observed versus expected gene-based P-values in VAAST 2 for genes with eight or more tested variants. Cases and controls include (A) 272 ovarian cancer cases and 1722 shared controls, and (B) 783 breast cancer cases and 1722 shared controls. Blue dots: benchmark QC (see ‘Materials and Methods’ section). Red dots: XPAT. The gray band represents a 95% (pointwise) confidence region. The Q–Q plots were generated with R package ‘Haplin’.
Figure 3.
Figure 3.
Observed proportion of significant associations at different α levels. We conducted association tests for ovarian (AC) and breast (DF) cancer, using eight association tests supported in XPAT. We calculated the proportions of significant associations at α levels of 0.001, 0.01 and 0.05 (dashed lines in each sub panel), and compared the performance of XPAT’s QC metrics versus benchmark QC metrics for each method and dataset.
Figure 4.
Figure 4.
Observed gene-based P-values for known cancer–gene associations. The heatmap depicts the P-values of known cancer–gene associations in ovarian cancer and breast cancer for genes with P < 0.05 in one or more association tests.
Figure 5.
Figure 5.
Power estimation for association tests using XPAT. The lines depict the power comparisons with VAAST 2 analysis with XPAT using TCGA ovarian cancer cases and NDAR controls (solid lines) and using platform-matched ovarian cancer cases and controls (dashed lines), for four genes: BRCA1 (red), BRCA2 (orange), RAD51D (blue), RAD51C (green). The x-axis shows the α level and the y-axis shows the statistical power. The power was calculated based on 1000 bootstraps. For each bootstrap, we sampled 250 cases and 1000 controls with replacement from each dataset.
Figure 6.
Figure 6.
OR estimates for ovarian cancer susceptibility genes. We estimated the ORs with TCGA-NDAR data and platform-matched data. Dotted lines indicate null value (OR = 1.0). Each sub panel contains the OR estimates for four categories of variants on cancer risk: LGD (black), missense and non-damaging (green), missense and damaging (blue), and missense and damaging and domain region variants (red). For variant categories with zero counts in either cases or controls, we estimated the OR using a Fisher’s exact test (indicated by star).

References

    1. Ng S.B., Buckingham K.J., Lee C., Bigham A.W., Tabor H.K., Dent K.M., Huff C.D., Shannon P.T., Jabs E.W., Nickerson D.A. et al. Exome sequencing identifies the cause of a mendelian disorder. Nat. Genet. 2010; 42:30–35. - PMC - PubMed
    1. Ioannidis J.P., Patsopoulos N.A., Evangelou E.. Heterogeneity in meta-analyses of genome-wide association investigations. PLoS One. 2007; 2:e841. - PMC - PubMed
    1. de Bakker P.I., Ferreira M.A., Jia X., Neale B.M., Raychaudhuri S., Voight B.F.. Practical aspects of imputation-driven meta-analysis of genome-wide association studies. Hum. Mol. Genet. 2008; 17:R122–R128. - PMC - PubMed
    1. Evangelou E., Ioannidis J.P.. Meta-analysis methods for genome-wide association studies and beyond. Nat. Rev. Genet. 2013; 14:379–389. - PubMed
    1. Liu L., Sabo A., Neale B.M., Nagaswamy U., Stevens C., Lim E., Bodea C.A., Muzny D., Reid J.G., Banks E. et al. Analysis of rare, exonic variation amongst subjects with autism spectrum disorders and population controls. PLoS Genet. 2013; 9:e1003443. - PMC - PubMed

Publication types

LinkOut - more resources