. 2018 Feb 16;46(3):1089-1101.
doi: 10.1093/nar/gkx1250.

Integrative analysis reveals disrupted pathways regulated by microRNAs in cancer

Affiliations

Integrative analysis reveals disrupted pathways regulated by microRNAs in cancer

Gary Wilk et al. Nucleic Acids Res. .

Abstract

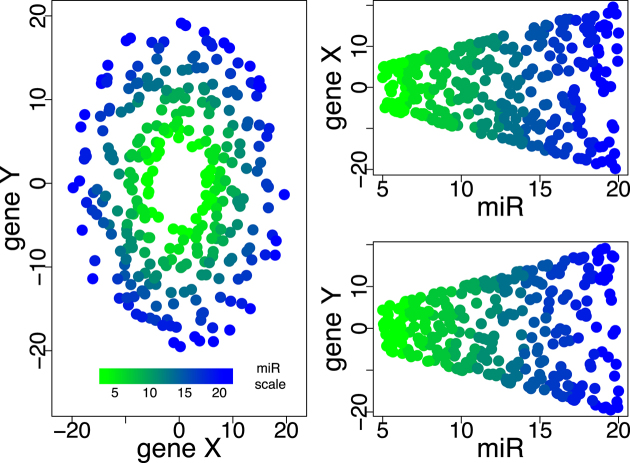
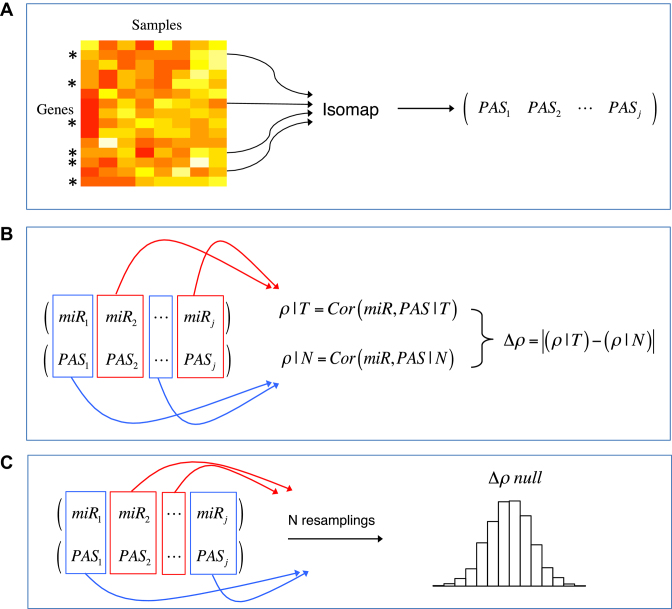
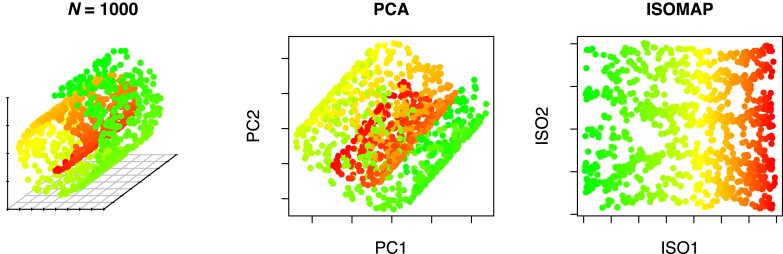
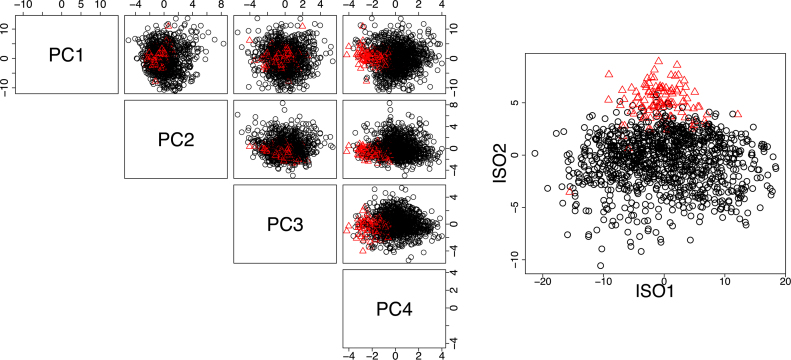
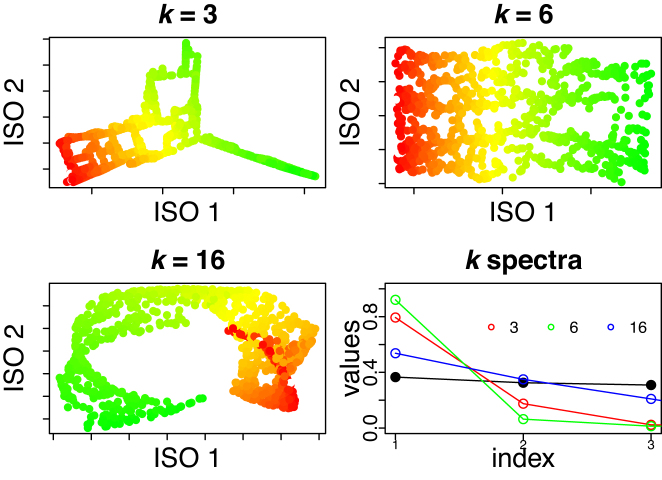
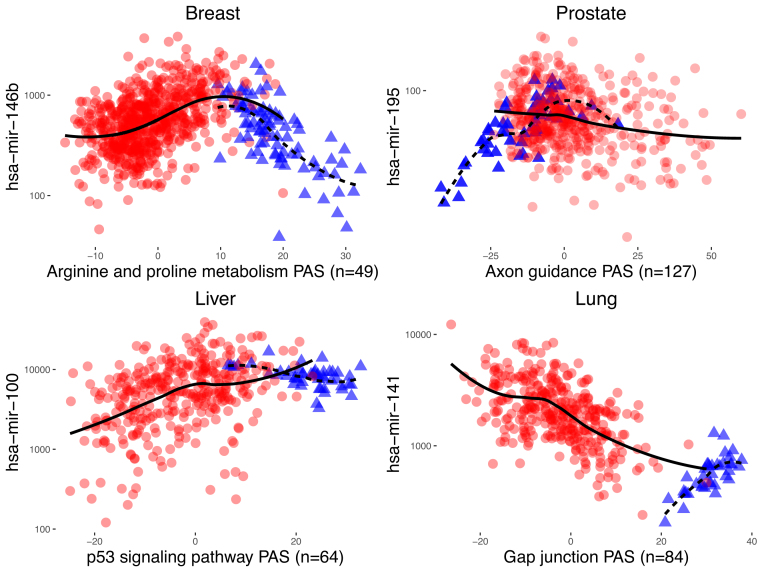
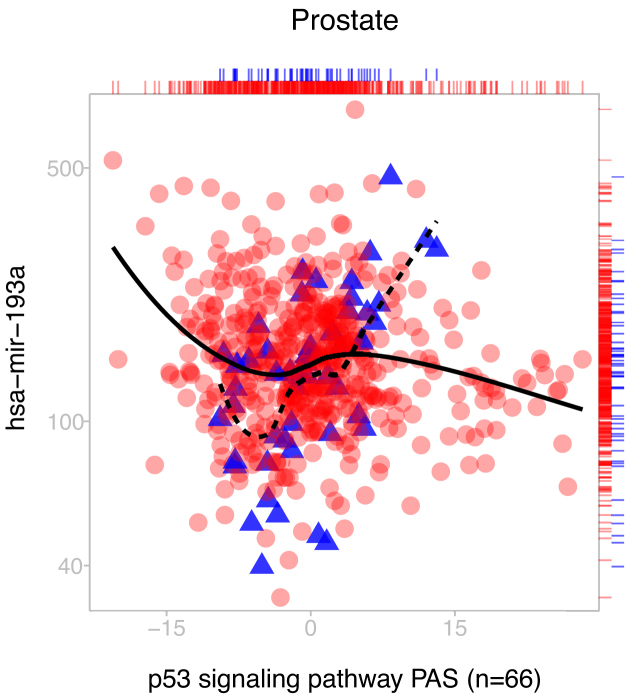
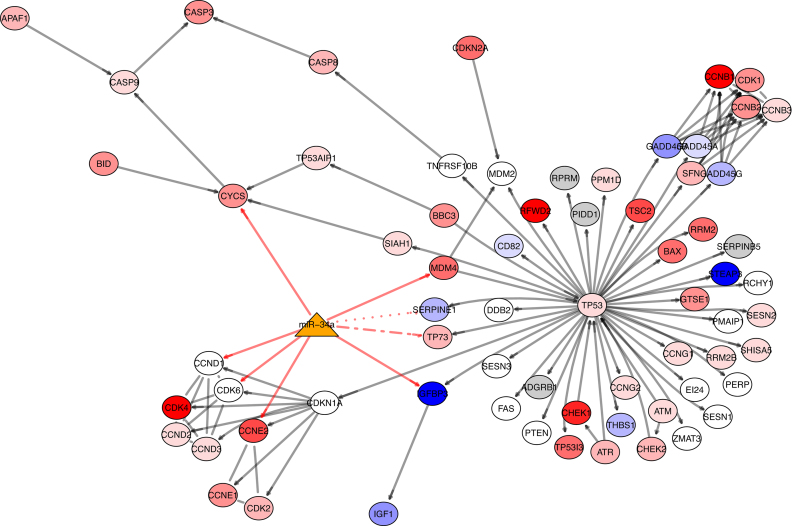
MicroRNAs (miRNAs) are small endogenous regulatory molecules that modulate gene expression post-transcriptionally. Although differential expression of miRNAs have been implicated in many diseases (including cancers), the underlying mechanisms of action remain unclear. Because each miRNA can target multiple genes, miRNAs may potentially have functional implications for the overall behavior of entire pathways. Here, we investigate the functional consequences of miRNA dysregulation through an integrative analysis of miRNA and mRNA expression data using a novel approach that incorporates pathway information a priori. By searching for miRNA-pathway associations that differ between healthy and tumor tissue, we identify specific relationships at the systems level which are disrupted in cancer. Our approach is motivated by the hypothesis that if an miRNA and pathway are associated, then the expression of the miRNA and the collective behavior of the genes in a pathway will be correlated. As such, we first obtain an expression-based summary of pathway activity using Isomap, a dimension reduction method which can articulate non-linear structure in high-dimensional data. We then search for miRNAs that exhibit differential correlations with the pathway summary between phenotypes as a means of finding aberrant miRNA-pathway coregulation in tumors. We apply our method to cancer data using gene and miRNA expression datasets from The Cancer Genome Atlas and compare ∼105 miRNA-pathway relationships between healthy and tumor samples from four tissues (breast, prostate, lung and liver). Many of the flagged pairs we identify have a biological basis for disruption in cancer.


Figures

Figure 1.
Figure 1.
An example of two genes cycling out of phase with one another, with the amplitude of the oscillation governed by the expression of a miRNA. The relationship is apparent in the left panel, where the lower values of the miRNA result in a smaller radius in the relationship between gene X and gene Y, yet neither gene X nor gene Y are correlated with the miRNA (right panels, top and bottom).
Figure 2.
Figure 2.
Illustration of the algorithm for a particular miRNA-pathway pair. (A) Gene expression data is first subsetted by the genes in a pathway and summarized by Isomap to produce the PAS, a one-dimensional (1D) summary of pathway expression in all samples. (B) PAS and miRNA expression are subsetted by phenotype, and miRNA-pathway correlations are computed for tumor and normal tissue. The difference between correlations gives Δρ. (C) To assess Δρ significance, the Δρ null distribution is estimated by random permutation of the class labels.
Figure 3.
Figure 3.
Swiss roll dimension reduction using PCA and Isomap. The roll is colored from green to red along the roll axis.
Figure 4.
Figure 4.
Comparison of gene expression dimension reduction using PCA (left) and Isomap (right) for genes in the Type I diabetes mellitus pathway. Black circles represent TCGA breast cancer tumor tissue and red triangles represent adjacent-normal. Plotted are the projections of the samples in the first four PCA coordinates (left) and first two Isomap coordinates (right). The Isomap embedding enables separation of the tumor and normal samples not achieved by PCA, suggesting that a non-linear pattern of gene expression within the pathway distinguishes tumor and normal samples.
Figure 5.
Figure 5.
2D embedding of the Swiss roll using Isomap for different k values. The bottom right plot shows the spectra using PCA (black dots), and for k = 3 (red), k = 6 (green) and k = 16 (blue) using Isomap. The spectrum at the optimal k, k = 6, is most different from PCA’s spectrum, as computed by the SGR ratio defined in the ‘Materials and Methods’ section.
Figure 6.
Figure 6.
Representative examples of significant miRNA-pathway pairs for all four cancers. miRNA-pathway pairs with the largest Δρ are shown for each cancer (P < 10−5). Tumor samples are represented by red circles and adjacent-normal samples by blue triangles. LOESS curves are overlaid by tissue type (solid line for tumor tissue, dotted line for adjacent-normal tissue) to visualize correlation differences. The number of genes in the pathway which have been used in the computation of the PAS are shown in parenthesis.
Figure 7.
Figure 7.
Example of a miRNA-pathway pair (miRNA ID: hsa-mir-193a, KEGG pathway ID: 04115) with significant Δρρ = −0.64, P < 10−4) despite no differential expression in prostate cancer. Absence of differential expression is visualized by a rug plot on the top and right. Our method is capable of articulating significant miRNA-pathway coregulation differences regardless of differential expression across either the pathway or miRNA.
Figure 8.
Figure 8.
The p53 signaling pathway targeted by hsa-mir-34a in liver cancer. Genes in the graph are colored by the degree of differential expression from low to high, from red to white to blue, in tumor versus normal tissue. Genes on the pathway that have not been assayed in TCGA data or used in the computation of the PAS are colored gray. hsa-mir-34a is represented by the orange triangle. Gray edges denote gene-gene interactions. Red edges denote miRNA-gene regulatory relationships between hsa-mir-34a and the genes on the pathway as predicted by TargetScan. Solid red edges contain literature support (79–83). The dotted red edge between hsa-mir-34a and SERPINE1 lacks literature support; its family member hsa-mir-34c targets SERPINE1 (84). The alternating dotted red edge between hsa-mir-34a and TP73 also lacks literature support as predicted by TargetScan. Rather, TP73 has been found to modulate hsa-mir-34a expression by acting on the hsa-mir-34a promotor (85).

Similar articles

Cited by

References

    1. Ambros V. The functions of animal microRNAs. Nature. 2004; 431:350–355. - PubMed
    1. Lewis B.P., Burge C.B., Bartel D.P.. Conserved seed pairing, often flanked by adenosines, indicates that thousands of human genes are microRNA targets. Cell. 2005; 120:15–20. - PubMed
    1. Griffiths-Jones S., Saini H.K., van Dongen S., Enright A.J.. miRBase: tools for microRNA genomics. Nucleic Acids Res. 2007; 36(Suppl. 1):D154–D158. - PMC - PubMed
    1. Friedman R.C., Farh K. K.-H., Burge C.B., Bartel D.P.. Most mammalian mRNAs are conserved targets of microRNAs. Genome Res. 2009; 19:92–105. - PMC - PubMed
    1. Chi S.W., Hannon G.J., Darnell R.B.. An alternative mode of microRNA target recognition. Nat. Struct. Mol. Biol. 2012; 19:321–327. - PMC - PubMed

Publication types

MeSH terms