. 2017 Dec 23;19(1):46.
doi: 10.3390/ijms19010046.

Inhibition of Aquaporin-4 Improves the Outcome of Ischaemic Stroke and Modulates Brain Paravascular Drainage Pathways

Affiliations

Inhibition of Aquaporin-4 Improves the Outcome of Ischaemic Stroke and Modulates Brain Paravascular Drainage Pathways

Ionica Pirici et al. Int J Mol Sci. .

Abstract

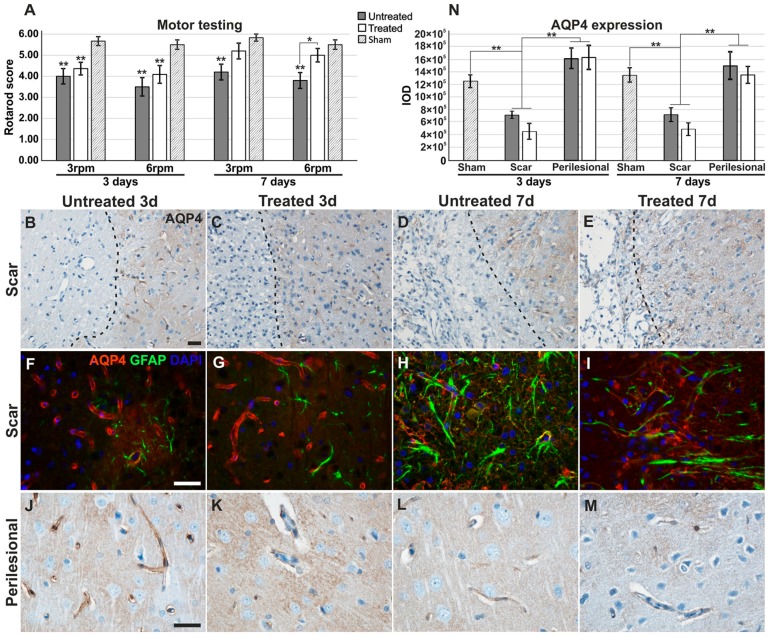
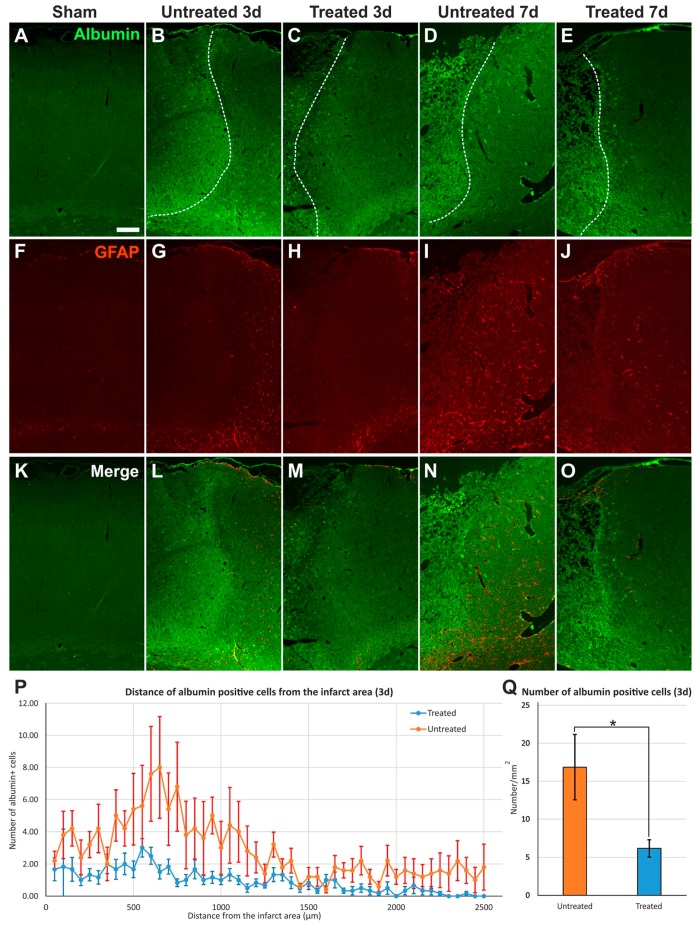
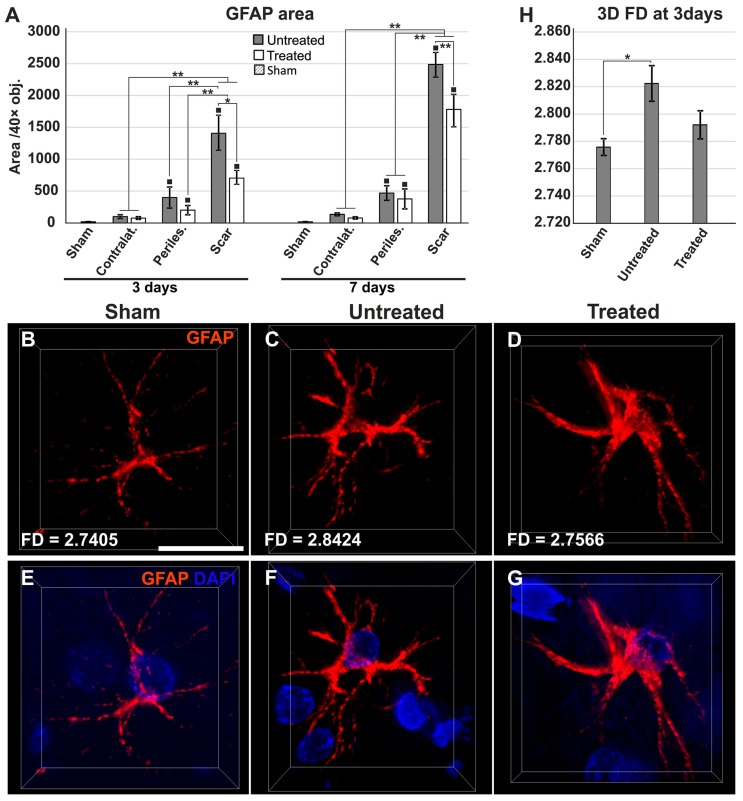
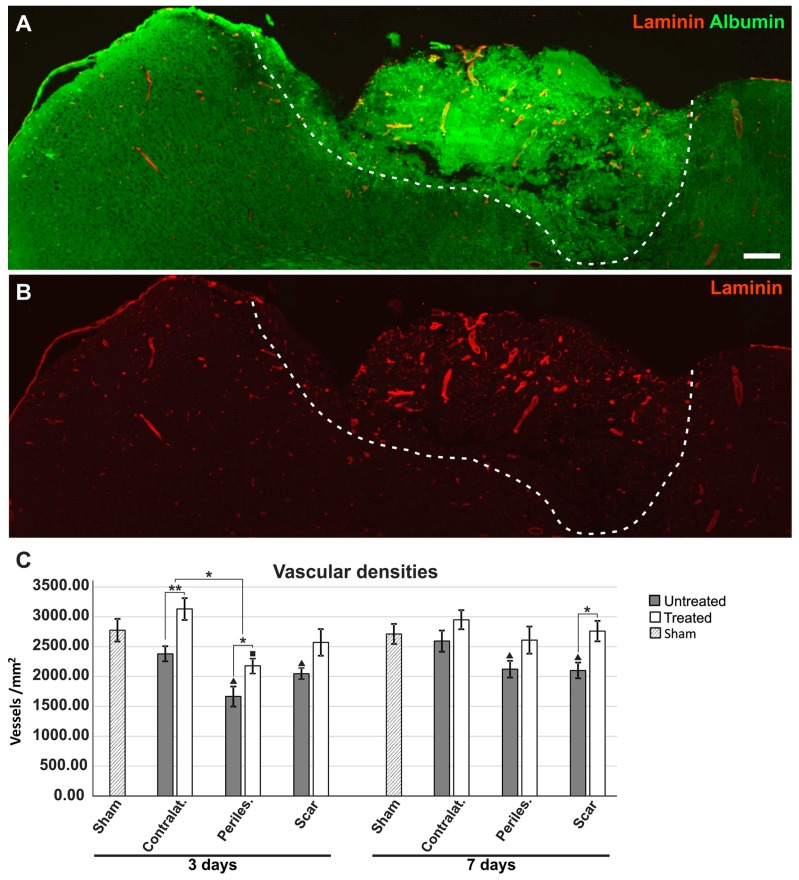
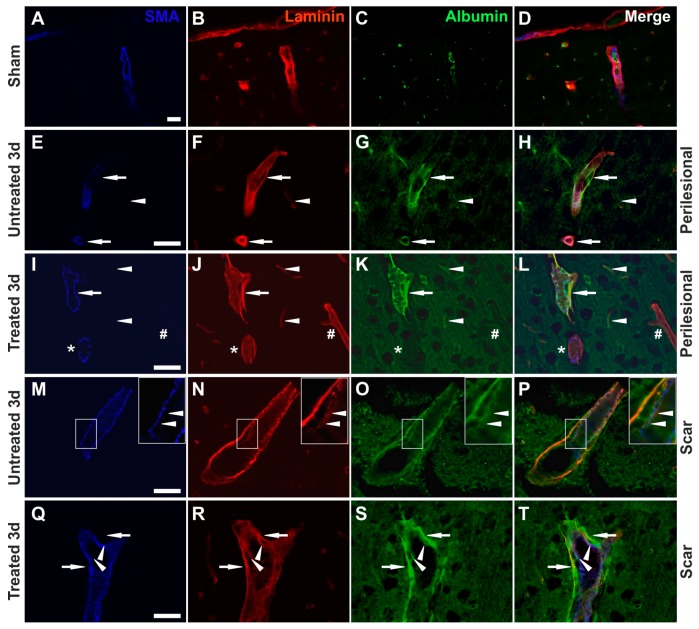
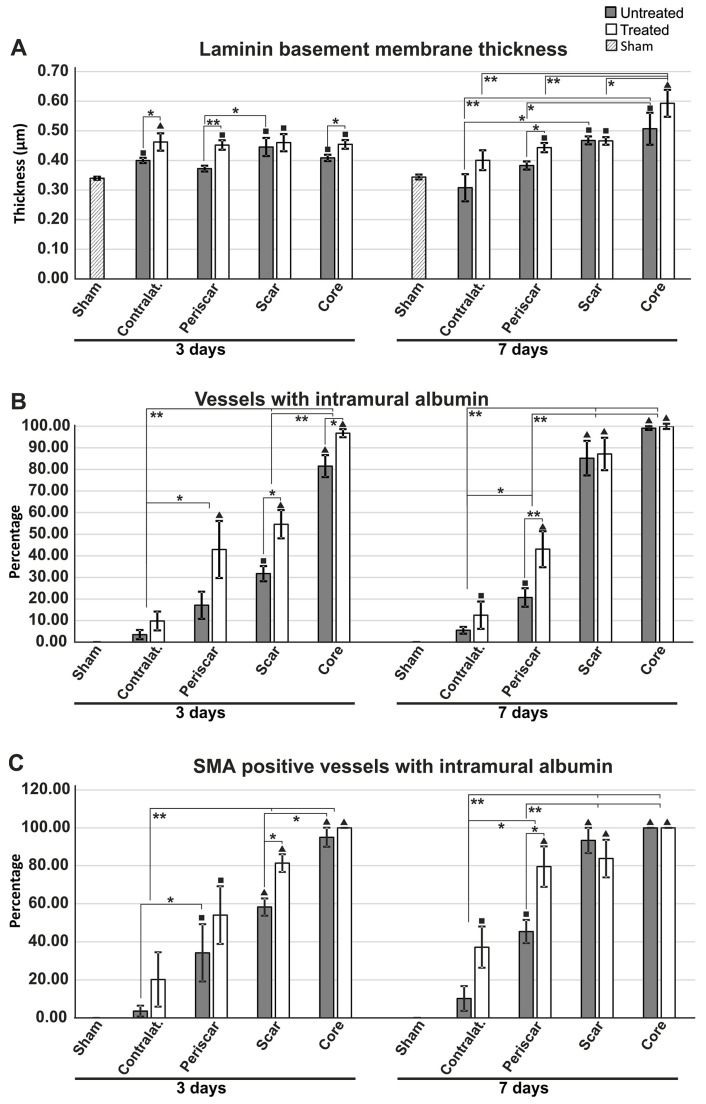
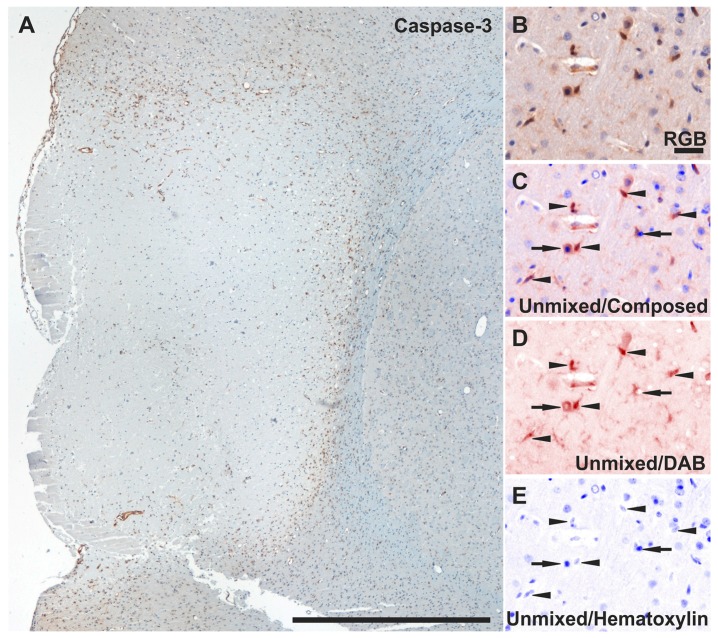
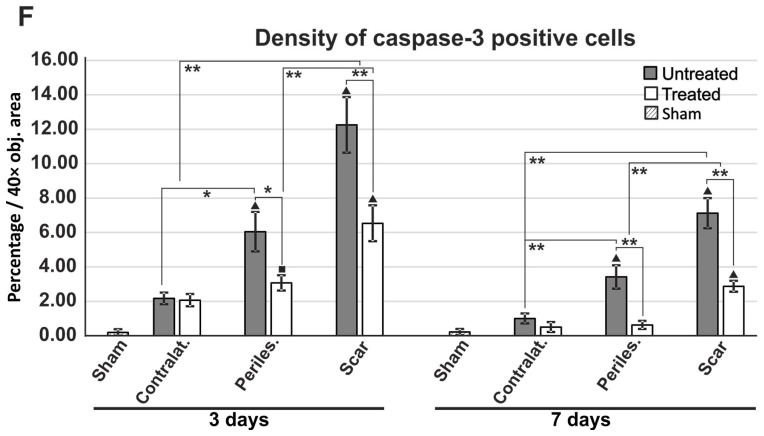
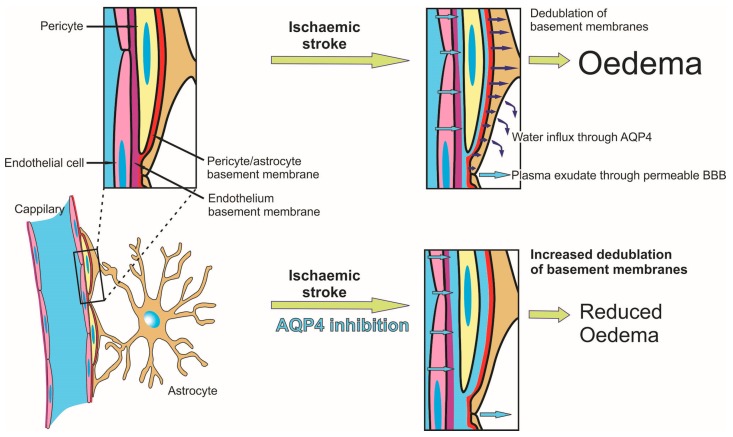
Aquaporin-4 (AQP4) is the most abundant water channel in the brain, and its inhibition before inducing focal ischemia, using the AQP4 inhibitor TGN-020, has been showed to reduce oedema in imaging studies. Here, we aimed to evaluate, for the first time, the histopathological effects of a single dose of TGN-020 administered after the occlusion of the medial cerebral artery (MCAO). On a rat model of non-reperfusion ischemia, we have assessed vascular densities, albumin extravasation, gliosis, and apoptosis at 3 and 7 days after MCAO. TGN-020 significantly reduced oedema, glial scar, albumin effusion, and apoptosis, at both 3 and 7 days after MCAO. The area of GFAP-positive gliotic rim decreased, and 3D fractal analysis of astrocytic processes revealed a less complex architecture, possibly indicating water accumulating in the cytoplasm. Evaluation of the blood vessels revealed thicker basement membranes colocalizing with exudated albumin in the treated animals, suggesting that inhibition of AQP4 blocks fluid flow towards the parenchyma in the paravascular drainage pathways of the interstitial fluid. These findings suggest that a single dose of an AQP4 inhibitor can reduce brain oedema, even if administered after the onset of ischemia, and AQP4 agonists/antagonists might be effective modulators of the paravascular drainage flow.

Keywords: aquaporin-4 inhibition; basement membranes; ischemic stroke; non-reperfusion ischemia; paravascular drainage.


Conflict of interest statement

The authors declare no conflict of interest.

Figures

Figure 1
Figure 1
Motor testing and comparative aquaporin expression patterns. (A) Motor performances showed an overall increase for TGN-020-treated animals, with a significant difference for the 6 rpm testing at 7 days; (BI) Aquaporin-4 (Aqp4) expression is decreased in the glial feltwork around the infarct tissue while still retaining strong vascular expression, and in perilesional regions (JM) it is more intense and diffusely present in the glial feltwork, both for 3-day treated and untreated animals. At 7 days, Aqp4 is present around the infarct, less in the blood vessels and more in the astrocytes forming the more robust scar, and is overall, more intense in untreated animals (D,E,H,I); (JM) Further from the infarct, it is diffuse in the neuropil for the untreated animals and more petechial in the treated rats; (N) Integrated optical density (IOD) of the immunohistochemistry staining shows significant lower values for scar regions for both treated and untreated animals at both time points. Data are expressed as the means ± SEM, * p < 0.05, ** p < 0.01 using a one-way ANOVA followed by a post hoc Fisher’s LSD test, n = 5–6/group. Unless indicated, significance is shown for differences from the measurements in sham animals. Dotted lines in the micrographs delineate the infarct areas. Scale bars represent 20 µm.
Figure 2
Figure 2
Albumin infiltration in perilesional cortex. (AO) Immunostaining for endogenous rat albumin reveals infiltration in infarct areas and cellular silhouettes in the surrounding parenchyma, apparently more in untreated animals than in TGN-020-treated rats, and overall, reduced gliosis in treated animals compared to untreated animals; (P) Distance frequency distribution of albumin-positive cellular silhouettes shows more frequent elements for the untreated animals around the infarct, with a peak at 500–1000 µm from the necrotic tissue (Student’s t-test, p < 0.001), at 3 days; (Q) The total number of albumin-positive cells quantified in (P) shows a significantly higher density for untreated rats (Student’s t-test, p < 0.05). Data are expressed as the means ± SEM. The dotted lines delineate the infarct cores on the left side in images BE. Scale bars in the micrographs represent 200 µm. * p < 0.05
Figure 3
Figure 3
Increased astrogliosis and different astroglial morphologies in untreated animals compared to the treatment group. (A) Gliotic areas increase from the contralateral hemisphere to the ipsilateral hemisphere and the scar region, where they are significantly higher for untreated animals compared to treated rats, for 3-day and 7-day survival times (* p < 0.05, ** p < 0.01; p < 0.01 (for pathological regions versus sham animals), using a one-way ANOVA followed by a post hoc Fisher’s LSD test, n = 5–6/group). The differences between 3 and 7 days are not included for reasons of clarity; (BD) Representative three-dimensional projections of scar astrocytes show different morphologies and 3D fractal dimension values (FD) for the sham, untreated, and treated animals at 3 days; EG images include also the DAPI nuclear morphology for better orientation; (H) Due to the high diversity of the astrocyte morphologies, three-dimensional FD values could only differentiate between sham and untreated astrocytes (F(2,16) = 3.843, * p = 0.047). Data are expressed as the means ± SEM. Scale bars in the micrographs represent 20 µm.
Figure 4
Figure 4
Increased vascular densities in TGN-020-treated animals. (A,B) Immunohistochemistry for albumin and laminin-1 reveal increased/conserved laminin expression in the infarcted areas (delineated by a dotted line) and adjacent tissue, in a 3-day post-MCAO TGN-020-treated animal; (C) Vascular densities show increased values for 3-day treated animals for the contralateral hemisphere and perilesional ipsilateral hemisphere, while in 7-day surviving animals, the difference was significant only for the scar tissue (* p < 0.05, ** p < 0.01; p < 0.05 and p < 0.01 (for pathological regions versus sham animals), using a one-way ANOVA followed by a post hoc Fisher’s LSD test, n = 5–6/group). The differences between 3 and 7 days are not included for reasons of clarity. Data are expressed as the means ± SEM. Scale bars in the micrographs represent 200 µm.
Figure 5
Figure 5
Increased retention of albumin along the vascular basement membranes. (AD) An exemplary image from a sham animal shows endogenous rat albumin being present only in the vascular lumen for an arteriole (SMA-positive) and surrounding capillaries; (EH) In untreated MCAO animals, arterioles (arrows) and capillaries (arrowhead) show albumin colocalizing with laminin on their basement membranes, and frequently these basement membranes with albumin deposits are thickened (arrows); (IL) In TGN-020-treated MCAO animals, arterioles (arrow) and capillaries (arrowheads) also show albumin colocalizing with laminin in their external basement membranes, and these basement membranes with albumin deposits are even thicker here (arrow). Not all SMA-positive (*)/SMA-negative (#) vessels have albumin deposits; (MP) Albumin colocalization occurs in arterioles in the exterior basement membranes, and less in those of the tunica media and under the endothelium (arrowheads), (QT), but to a lesser extent than in the external basement membranes for the treated animals (arrowheads versus arrows). Scale bars in the micrographs represent 40 µm.
Figure 6
Figure 6
Characterization of the vessels with intramural albumin retention. (A) Direct measurement of the outermost basement membrane based on laminin immunohistochemistry reveals an increased thickness for treated animals compared to untreated animals, especially at 3 days after MCAO (in the infarct core, the ipsilateral hemisphere around the gliotic scar, and the contralateral hemisphere), while this difference was significant only for the ipsilateral peri-scar tissue at 7 days of survival; (B) There were more albumin-positive vessels in treated animals than in untreated ones for the infarct core and scar region at 3 days after MCAO, and in the peri-scar regions at 7 days after MCAO. Overall, there was an increase in the number of albumin-positive vessels from the distant contralateral hemisphere to the infarct core; (C) The percentage of larger muscular vessels (SMA-positive) being stained for albumin increases from the contralateral hemisphere to the infarct core, with a tendency toward higher values in treated animals (* p < 0.05, ** p < 0.01; p < 0.05 and p < 0.01 (for pathological regions versus sham animals), using a one-way ANOVA followed by a post hoc Fisher’s LSD test, n = 5–6/group). The differences between 3 and 7 days are not included for reasons of clarity. Data are expressed as the means ± SEM.
Figure 7
Figure 7
Assessment of apoptosis by counting cleaved caspase-3-positive cells. (A) Low-magnification overview of cleaved caspase-3 expression pattern in a 3-day untreated MCAO animal. (B) Representative perilesional higher-magnification RGB images decomposed as pure DAB and hematoxylin signals after spectral unmixing (CE) showing that only cells presenting immunoreactivity in the nucleus (arrowheads) were counted for the analysis, while cells immunopositive in the cytoplasm only were rejected (arrows); (F) Direct counting revealed lower apoptosis levels for treated animals in the ipsilateral perilesional hemisphere and the scar areas at 3 days and 7 days after injury (* p < 0.05, ** p < 0.01; p < 0.05 and p < 0.01 (for pathological regions versus sham animals), using a one-way ANOVA followed by a post hoc Fisher’s LSD test, n = 5–6/group). The differences between 3 and 7 days are not included for reasons of clarity. Data are expressed as the means ± SEM. Scale bars in the micrographs represent 1 mm (A), and 20 µm (BE).
Figure 7
Figure 7
Assessment of apoptosis by counting cleaved caspase-3-positive cells. (A) Low-magnification overview of cleaved caspase-3 expression pattern in a 3-day untreated MCAO animal. (B) Representative perilesional higher-magnification RGB images decomposed as pure DAB and hematoxylin signals after spectral unmixing (CE) showing that only cells presenting immunoreactivity in the nucleus (arrowheads) were counted for the analysis, while cells immunopositive in the cytoplasm only were rejected (arrows); (F) Direct counting revealed lower apoptosis levels for treated animals in the ipsilateral perilesional hemisphere and the scar areas at 3 days and 7 days after injury (* p < 0.05, ** p < 0.01; p < 0.05 and p < 0.01 (for pathological regions versus sham animals), using a one-way ANOVA followed by a post hoc Fisher’s LSD test, n = 5–6/group). The differences between 3 and 7 days are not included for reasons of clarity. Data are expressed as the means ± SEM. Scale bars in the micrographs represent 1 mm (A), and 20 µm (BE).
Figure 8
Figure 8
Overview of the mechanism driving reduced oedema and stasis in the paravascular interstitial drainage pathway following aquaporin-4 inhibition in ischemic tissue. Following ischemia, hypoxic endothelial cells lose their tight junctions and increase their permeability for serum, which infiltrates and splits vascular basement membranes, and finally infiltrates through/between the astrocytes into the parenchyma. As the mechanism of water transport at the level of the pericyte/astrocyte basement membrane is mainly dependent on AQP4, this influx is significantly reduced after its inhibition, leading to reduced water infiltration into the parenchyma, and consecutive further splitting of the basement membranes.

References

    1. Mackay J., Mensah G., Mendis S., Greenlund K. The Atlas of Heart Disease and Stroke. World Health Organization; Geneva, Switzerland: 2004.
    1. Roger V.L., Go A.S., Lloyd-Jones D.M., Adams R.J., Berry J.D., Brown T.M., Carnethon M.R., Dai S., de Simone G., Ford E.S., et al. Heart disease and stroke statistics—2011 update: A report from the American Heart Association. Circulation. 2011;123:e18–e209. doi: 10.1161/CIR.0b013e3182009701. - DOI - PMC - PubMed
    1. Engelhardt S., Patkar S., Ogunshola O.O. Cell-specific blood-brain barrier regulation in health and disease: A focus on hypoxia. Br. J. Pharmacol. 2014;171:1210–1230. doi: 10.1111/bph.12489. - DOI - PMC - PubMed
    1. Qureshi A.I., Suarez J.I., Yahia A.M., Mohammad Y., Uzun G., Suri M.F., Zaidat O.O., Ayata C., Ali Z., Wityk R.J. Timing of neurologic deterioration in massive middle cerebral artery infarction: A multicenter review. Crit. Care Med. 2003;31:272–277. doi: 10.1097/00003246-200301000-00043. - DOI - PubMed
    1. Dziedzic T., Szczudlik A., Klimkowicz A., Rog T.M., Slowik A. Is mannitol safe for patients with intracerebral hemorrhages? Renal considerations. Clin. Neurol. Neurosurg. 2003;105:87–89. doi: 10.1016/S0303-8467(02)00106-3. - DOI - PubMed

MeSH terms

LinkOut - more resources