. 2018 Mar;29(3):961-976.
doi: 10.1681/ASN.2017070774. Epub 2018 Jan 2.

Potentiating Tissue-Resident Type 2 Innate Lymphoid Cells by IL-33 to Prevent Renal Ischemia-Reperfusion Injury

Affiliations

Potentiating Tissue-Resident Type 2 Innate Lymphoid Cells by IL-33 to Prevent Renal Ischemia-Reperfusion Injury

Qi Cao et al. J Am Soc Nephrol. 2018 Mar.

Abstract

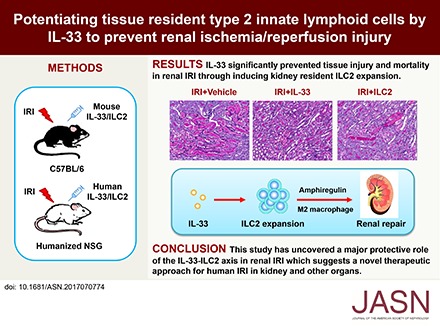
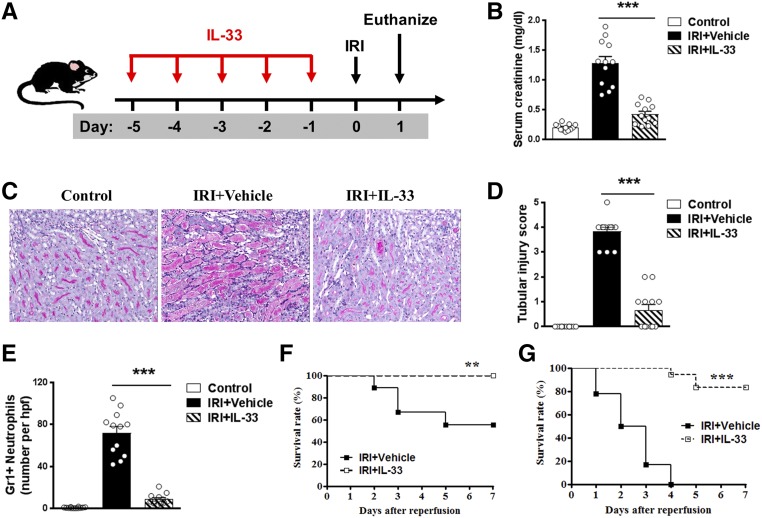
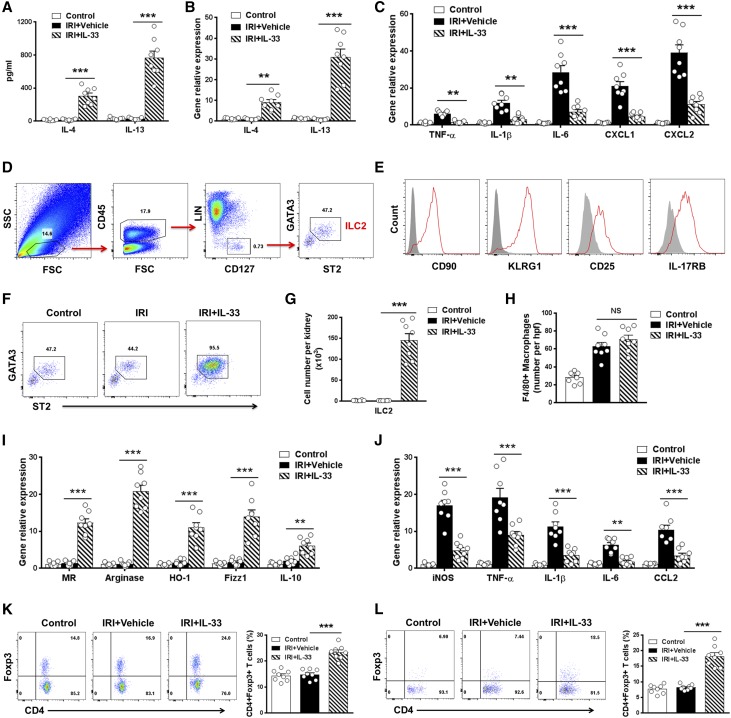
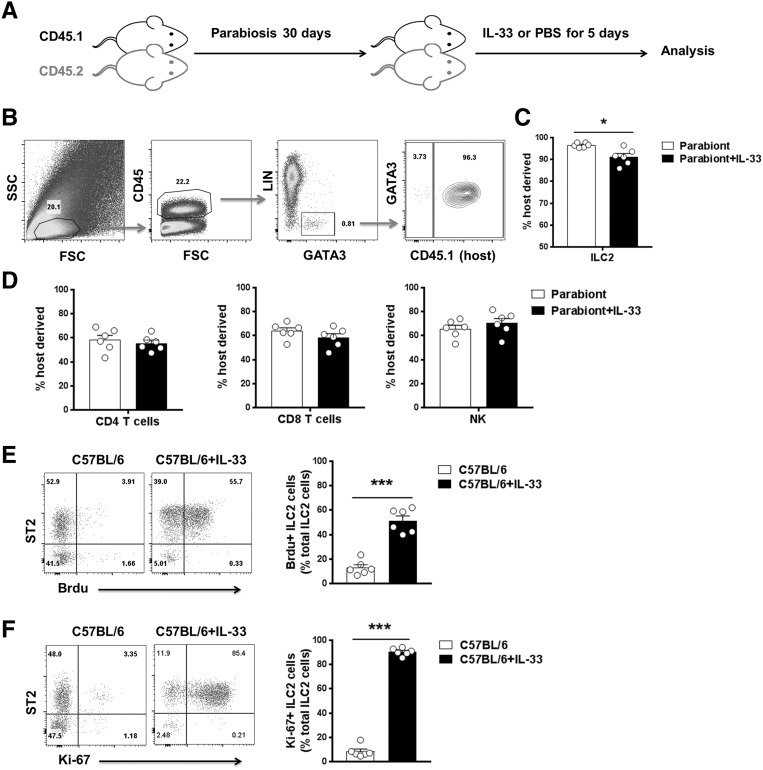
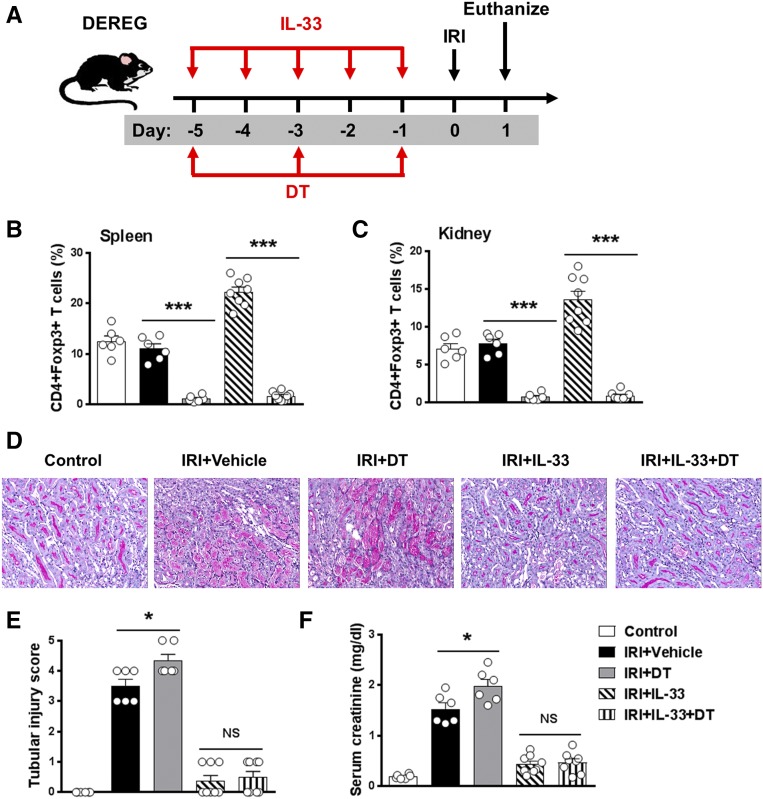
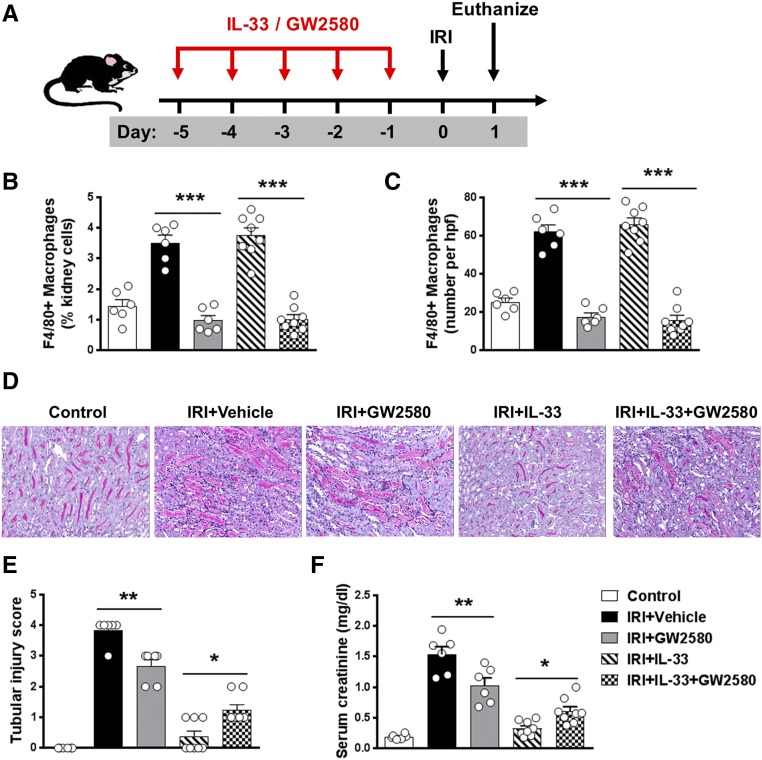
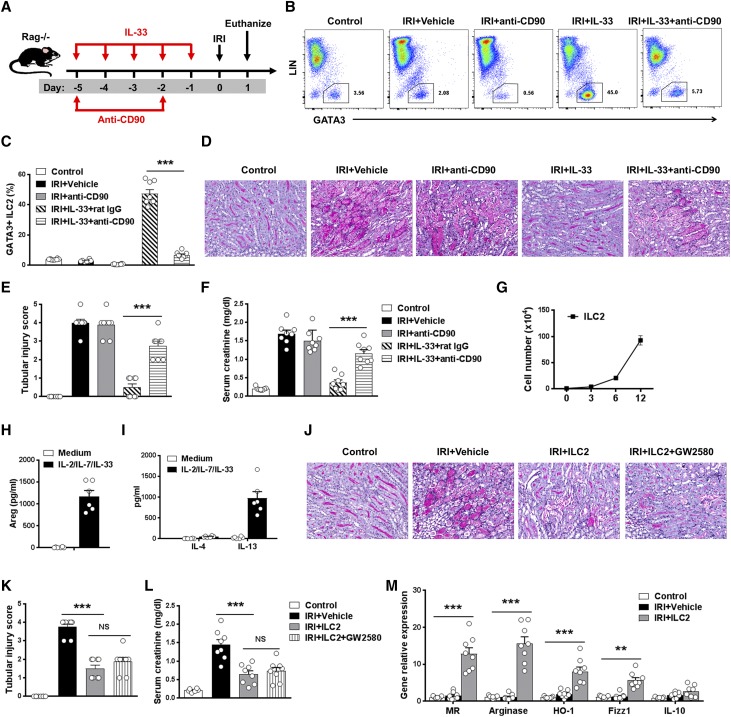
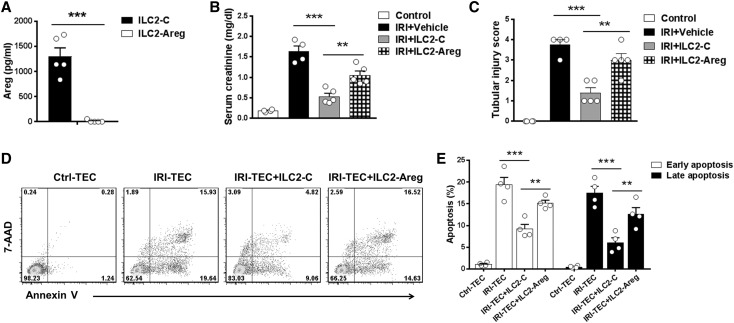
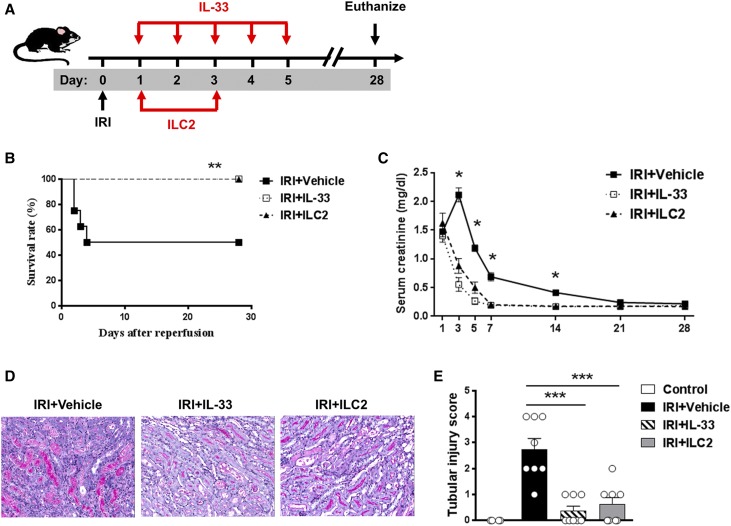
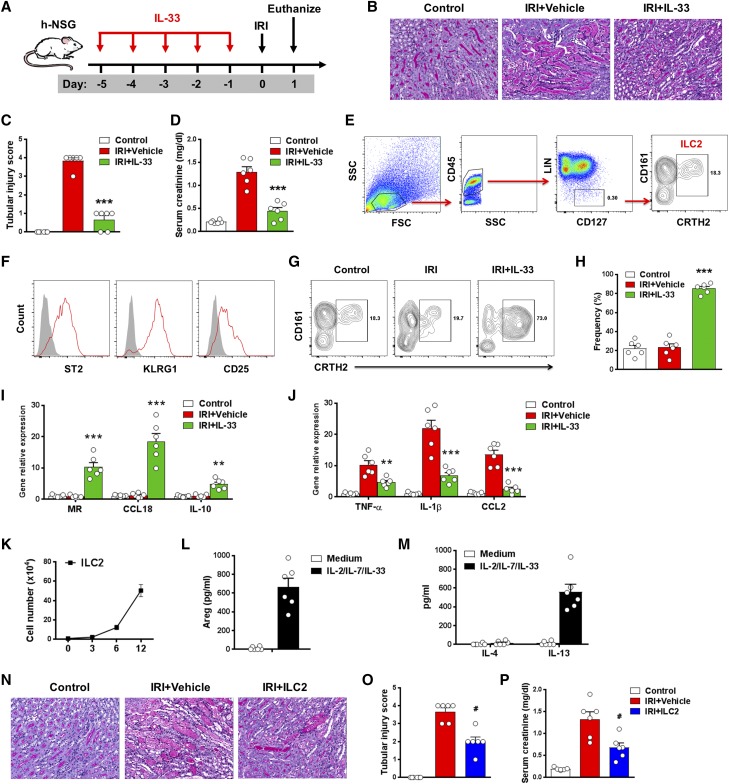
The IL-33-type 2 innate lymphoid cell (ILC2) axis has an important role in tissue homeostasis, inflammation, and wound healing. However, the relative importance of this innate immune pathway for immunotherapy against inflammation and tissue damage remains unclear. Here, we show that treatment with recombinant mouse IL-33 prevented renal structural and functional injury and reduced mortality in mice subjected to ischemia-reperfusion injury (IRI). Compared with control-treated IRI mice, IL-33-treated IRI mice had increased levels of IL-4 and IL-13 in serum and kidney and more ILC2, regulatory T cells (Tregs), and anti-inflammatory (M2) macrophages. Depletion of ILC2, but not Tregs, substantially abolished the protective effect of IL-33 on renal IRI. Adoptive transfer of ex vivo-expanded ILC2 prevented renal injury in mice subjected to IRI. This protective effect associated with induction of M2 macrophages in kidney and required ILC2 production of amphiregulin. Treatment of mice with IL-33 or ILC2 after IRI was also renoprotective. Furthermore, in a humanized mouse model of renal IRI, treatment with human IL-33 or transfer of ex vivo-expanded human ILC2 ameliorated renal IRI. This study has uncovered a major protective role of the IL-33-ILC2 axis in renal IRI that could be potentiated as a therapeutic strategy.

Keywords: IL-33; immunotherapy; innate lymphoid cells; ischemia/reperfusion injury; macrophages.


Figures

None
Graphical abstract
Figure 1.
Figure 1.
IL-33 protected against renal injury in IRI mice. (A) C57BL/6 mice were treated with mouse recombinant IL-33 daily for 5 consecutive days before bilateral IRI. Mice were euthanized 1 day after IRI. (B) Serum creatinine levels were assessed in control, IRI + Vehicle (PBS), and IRI + IL-33 at 1 day after IRI. ***P<0.001 versus IRI + vehicle. (C) Representative periodic acid–Schiff-stained sections of kidney outer medulla from IRI mice treated with PBS or IL-33. Original magnification, ×200. (D) Semiquantitative assessment of tubular injury in control, IRI + Vehicle, and IRI + IL-33 1 day after IRI. ***P<0.001 versus IRI + vehicle. (E) Number of Gr-1+ neutrophils was assessed by immunofluorescence staining in outer medulla of kidney. Data shown are the mean±SEM (n=12 per group) from three independent experiments. hpf, High-power field. ***P<0.001 versus IRI + vehicle. (F and G) Survival rate of C57BL/6 mice (male, 8–10 weeks of age) subjected to IRI for (F) 30 minutes or (G) 38 minutes and injected with IL-33 (n=18) or PBS (n=18). Data are from three independent experiments. **P<0.01 between IRI + Vehicle and IRI + IL-33 mice as assessed by log rank test; ***P<0.001 between IRI + Vehicle and IRI + IL-33 mice as assessed by log rank test.
Figure 2.
Figure 2.
IL-33 induced ILC2s, M2 macrophages, and Tregs in IRI mice. (A) IL-4 and IL-13 levels in serum were assessed in control, IRI + Vehicle, and IRI + IL-33 groups day 1 after bilateral IRI. (B and C) The mRNA expression of IL-4, IL-13, and various inflammatory genes in kidney was examined by quantitative PCR and expressed relative to the control of each experiment. (D) Representative FACS analysis showing the gating strategy to identify CD45+Lin−CD127+ST2+GATA3+ ILC2 in mouse kidney. Lin mixture includes CD3, CD5, TCRβ, TCRγδ, CD19, B220, CD49b, CD11b, CD11c, FcεRIα, Gr-1, and Ter-119. (E) Histogram showing expression of CD90, KLRG1, CD25, and IL-17RB on kidney ILC2s. Specific markers (red lines) and isotype controls (gray-filled areas) are shown. (F and G) Percentage and absolute number of ST2+GATA3+ ILC2s in the kidneys of control, IRI + Vehicle, or IRI + IL-33 mice. (H) Number of F4/80+ macrophages was assessed by immunofluorescence staining in kidney. (I and J) F4/80+ kidney macrophages were sorted by flow cytometry in control, IRI + Vehicle, and IRI + IL-33 mice on day 1 after IRI. The mRNA expression of MR, arginase, HO-1, YM1, IL-10, iNOS, TNF-α, IL-1β, IL-6, and CCL2 was quantified by quantitative PCR in F4/80+ kidney macrophages. (K and L) Percentage of CD4+Foxp3+ Tregs in the CD4+ T cell compartment from the (K) spleens and (L) kidneys of control, IRI + Vehicle, or IRI + IL-33 mice. Data shown are the mean±SEM (n=8 per group). **P<0.01 versus IRI + vehicle; ***P<0.001 versus IRI + vehicle.
Figure 3.
Figure 3.
Kidney resident ILC2s proliferated on IL-33 treatment. (A) Congenically marked CD45.1+ and CD45.2+ C57BL/6 mice underwent parabiosis surgery. After 30 days, parabiotic mice were administered 0.5 μg mouse recombinant IL-33 or PBS daily for 5 consecutive days. (B) Representative FACS analysis showing the gating strategy to determine the percentage of host-derived ILC2s in the kidney on day 35 after parabiosis surgery. Lin mixture includes CD3, CD5, TCRβ, TCRγδ, CD19, B220, CD49b, CD11b, CD11c, FcεRIα, Gr-1, and Ter-119. (C and D) The percentages of host-derived ILC2s, CD4+ and CD8+ T cells, and NK cells in kidney on day 35 after parabiosis surgery. Data shown are the mean±SEM (n=6 per group). *P<0.01 versus Parabiont. (E and F) C57BL/6 mice were treated with 0.3 μg mouse recombinant IL-33 or PBS daily for 5 consecutive days. The percentages of (E) BrdU+ ILC2s and (F) Ki-67+ ILC2s in total kidney ILC2s were analyzed in C57BL/6 mice with PBS or IL-33 treatment. Data shown are the mean±SEM (n=6 per group). ***P<0.001 versus C57BL/6.
Figure 4.
Figure 4.
Tregs did not contribute to IL-33–mediated renoprotection in IRI mice. (A) DEREG C57BL/6 mice were treated with mouse recombinant IL-33 daily for 5 consecutive days as well as DT on days −5, −3, and −1 before bilateral IRI. Mice were euthanized 1 day after IRI. (B and C) Frequency of CD4+Foxp3+ Tregs in the CD4+ T cell compartment from the spleens and kidneys of control, IRI + Vehicle, IRI + DT, IRI + IL-33, or IRI + IL-33 + DT mice. (D) Representative periodic acid–Schiff-stained sections of kidney outer medulla from mice 1 day after IRI. Original magnification, ×200. (E and F) Serum creatinine levels and tubular injury score were assessed in control, IRI + Vehicle, IRI + DT, IRI + IL-33, or IRI + IL-33 + DT mice. Data shown are the mean±SEM (n=6–8 per group). *P<0.05, ***P<0.001.
Figure 5.
Figure 5.
M2 macrophages contributed to IL-33–mediated renoprotection in IRI mice. (A) C57BL/6 mice were treated with GW2580 and/or mouse recombinant IL-33 daily for 5 consecutive days before bilateral IRI. Mice were euthanized 1 day after IRI. (B and C) Frequency of F4/80+ macrophages in the total kidney cells and number of F4/80+ macrophages per kidney section (number per high-power field [hpf]) were assessed in control, IRI + Vehicle, IRI + GW2580, IRI + IL-33, or IRI + IL-33 + GW2580 mice. (D) Representative periodic acid–Schiff-stained sections of kidney outer medulla from mice 1 day after IRI. Original magnification, ×200. (E and F) Serum creatinine levels and tubular injury score were assessed in control, IRI + Vehicle, IRI + GW2580, IRI + IL-33, or IRI + IL-33 + GW2580 mice. Data shown are the mean±SEM (n=6–8 per group). *P<0.05; **P<0.01, ***P<0.001.
Figure 6.
Figure 6.
ILC2s played a key role in IL-33–mediated renoprotection in IRI mice. (A) Rag−/− mice were treated with mouse recombinant IL-33 daily for 5 consecutive days as well as anti-CD90 antibody or control rat IgG twice before bilateral IRI surgery. Mice were euthanized 1 day after IRI. (B and C) Percentage of GATA3+ ILC2s in the CD45+ leukocyte compartment from the kidneys of control, IRI + Vehicle, IRI + anti-CD90, IRI + IL-33 + rat IgG, or IRI + IL-33 + anti-CD90 mice. (D) Representative periodic acid–Schiff-stained sections of kidney outer medulla from mice 1 day after IRI. Original magnification, ×200. (E and F) Serum creatinine levels and tubular injury score were assessed in control, IRI + Vehicle, IRI + anti-CD90, IRI + IL-33 + rat IgG, or IRI + IL-33 + anti-CD90 mice. Data shown are the mean±SEM (n=8 per group) from two independent experiments. ***P<0.001. (G–I) ILC2s were isolated from C57BL/6 mice treated with IL33 by flow sorting, and sort purified ILC2 cultured with IL-2, IL-7, and IL-33 for 12 days. The number of ILC2 was calculated on days 3, 6, and 12. Areg, IL-4, and IL-13 were measured in culture supernatant via ELISA. Data are representative of at least three independent experiments. (J–M) Rag−/− mice were treated with ex vivo–expanded ILC2s 1 day before IRI and GW2580 daily for 5 consecutive days before IRI. Mice were euthanized 1 day after IRI. (J) Representative periodic acid–Schiff-stained sections of kidney outer medulla from mice 1 day after IRI. Original magnification, ×200. (K and L) Serum creatinine levels and tubular injury score were assessed in control, IRI + Vehicle, IRI + ILC2, or IRI + ILC2 + GW2580 mice. (M) The mRNA expression of MR, arginase, HO-1, FIZZ1, and IL-10 was quantified by quantitative PCR in F4/80+ kidney macrophages sorted from control, IRI + Vehicle, IRI + ILC2, or IRI + ILC2 + GW2580 mice. Data shown are the mean±SEM (n=8 per group) from two independent experiments. **P<0.01; ***P<0.001.
Figure 7.
Figure 7.
ILC2s protected against renal IRI in an Areg-dependent manner. (A) Ex vivo–expanded ILC2s were transfected with control (type 2 innate lymphoid cell-control [ILC2-C]) or Areg CRISPR-Cas9 (type 2 innate lymphoid cell-amphiregulin [ILC2-Areg]). Areg was measured in culture supernatant of ILC2-C and ILC2-Areg via ELISA. (B and C) Transfected ILC2s were adoptively transferred into C57BL/6 1 day before IRI. Serum creatinine levels and tubular injury score were assessed in control, IRI + Vehicle, IRI + ILC2-C, or IRI + ILC2-Areg mice 1 day after IRI. Data shown are the mean±SEM (n=4–5 per group). **P<0.01; ***P<0.001. (D and E) Renal TEC ischemia was induced in vitro by immersing the cellular monolayer in mineral oil for 60 minutes at 37°C. Transfected ILC2s (ILC2-C or ILC2-Areg) were cocultured with ischemic renal tubular epithelial cells (IRI-TECs) for 1 day. TECs were exposed to serum-free K1 medium alone as the nonischemic control (control tubular epithelial cell [Ctrl-TEC]). (D) Representative FACS analysis of apoptosis in TECs after a 1-day coculture. (E) Frequency of early apoptosis (Annexin V+7AAD− cells) and late apoptosis (Annexin V+7AAD+ cells) in TECs after a 1-day coculture. Data shown are the mean±SEM (n=4 per group). **P<0.01; ***P<0.001.
Figure 8.
Figure 8.
IL-33 and ILC2 protected against IRI when administered post-IRI surgery. (A) C57BL/6 mice were treated with mouse recombinant IL-33 daily for 5 consecutive days or ILC2 twice beginning 24 hours after bilateral IRI surgery. Mice were euthanized on day 28 after IRI. (B) Survival rate of C57BL/6 mice subjected to IRI and injected with PBS, IL-33, or ILC2 (n=8 per group). **P<0.01 between IRI + Vehicle and IRI + IL-33/IRI + ILC2 mice as assessed by log rank test. (C) Serum creatinine levels were assessed in IRI + Vehicle (PBS), IRI + IL-33, and IRI + IL-33 at different time points after IRI. Data shown are the mean±SEM. *P<0.05 versus IRI + IL-33 and IRI + ILC2. (D) Representative periodic acid–Schiff-stained sections of kidney outer medulla from IRI mice treated with PBS, IL-33, or ILC2. Original magnification, ×200. (E) Tubular injury score was assessed in necropsy of moribund IRI mice or control, IRI + Vehicle, IRI + IL-33, and IRI + ILC2 mice on day 28 after IRI. Data shown are the mean±SEM. ***P<0.001.
Figure 9.
Figure 9.
Human IL-33 reduced renal IRI in humanized NOD scid-γ (h-NSG) mice. (A) h-NSG mice were treated with human recombinant IL-33 daily for 5 consecutive days before bilateral IRI surgery. Mice were euthanized 1 day after IRI. (B) Representative periodic acid–Schiff-stained sections of kidney outer medulla from mice day 1 after IRI. Original magnification, ×200. (C and D) Serum creatinine levels and tubular injury score were assessed in control, IRI + Vehicle, or IRI + IL-33 mice. (E) Representative FACS analysis showing the gating strategy to identify human CD45+Lin−CD127+CD161+CRTH2+ ILC2s in the kidneys of h-NSG mice. Lin mixture includes CD3, TCRαβ, CD19, CD20, CD14, CD16, CD11b, CD11c, CD123, CD56, and FcεRIα. (F) Histogram showing expression of ST2, KLRG1, and CD25 on human kidney ILC2s. Specific markers (red lines) and isotype controls (gray-filled areas) are shown. (G and H) Percentage of CD161+CRTH2+ ILC2s in the CD45+LIN−CD127+ cell compartment from the kidneys of control, IRI + Vehicle, or IRI + IL-33 mice. (I and J) CD14+ human monocytes/macrophages were sorted from kidneys of control, IRI + Vehicle, and IRI + IL-33 mice on day 1 after IRI. The mRNA expression of MR, CCL18, IL-10, TNF-α, IL-1β, and CCL2 was quantified by quantitative PCR in kidney CD14+ human monocytes/macrophages. Data shown are the mean±SEM (n=6 per group) from two independent experiments. **P<0.01 versus IRI + vehicle; ***P<0.001 versus IRI + vehicle. (K–M) Human ILC2s were isolated from PBMCs and cultured with IL-2, IL-7, and IL-33 for 12 days. The number of ILC2s was calculated on days 3, 6, and 12. Areg, IL-4, and IL-13 were measured in culture supernatant via ELISA. Data are representative of at least three independent experiments. (N–P) h-NSG mice were treated with ex vivo–expanded human ILC2s 1 day before IRI. Mice were euthanized 1 day after IRI. (N) Representative periodic acid–Schiff-stained sections of kidney outer medulla from mice 1 day after IRI. Original magnification, ×200. (O and P) Serum creatinine levels and tubular injury score were assessed in control, IRI + Vehicle, or IRI + ILC2 mice. Data shown are the mean±SEM (n=6 per group) from two independent experiments. #P<0.01 versus IRI + vehicle.

References

    1. Sonnenberg GF, Artis D: Innate lymphoid cells in the initiation, regulation and resolution of inflammation. Nat Med 21: 698–708, 2015 - PMC - PubMed
    1. Eberl G, Colonna M, Di Santo JP, McKenzie AN: Innate lymphoid cells. Innate lymphoid cells: A new paradigm in immunology. Science 348: aaa6566, 2015 - PMC - PubMed
    1. Eberl G, Di Santo JP, Vivier E: The brave new world of innate lymphoid cells. Nat Immunol 16: 1–5, 2015 - PubMed
    1. Monticelli LA, Sonnenberg GF, Abt MC, Alenghat T, Ziegler CG, Doering TA, Angelosanto JM, Laidlaw BJ, Yang CY, Sathaliyawala T, Kubota M, Turner D, Diamond JM, Goldrath AW, Farber DL, Collman RG, Wherry EJ, Artis D: Innate lymphoid cells promote lung-tissue homeostasis after infection with influenza virus. Nat Immunol 12: 1045–1054, 2011 - PMC - PubMed
    1. Rak GD, Osborne LC, Siracusa MC, Kim BS, Wang K, Bayat A, Artis D, Volk SW: IL-33-dependent group 2 innate lymphoid cells promote cutaneous wound healing. J Invest Dermatol 136: 487–496, 2016 - PMC - PubMed

Publication types

MeSH terms