

Range Expansion and the Origin of USA300 North American Epidemic Methicillin-Resistant Staphylococcus aureus
- PMID: 29295910
- PMCID: PMC5750399
- DOI: 10.1128/mBio.02016-17
Range Expansion and the Origin of USA300 North American Epidemic Methicillin-Resistant Staphylococcus aureus
Abstract
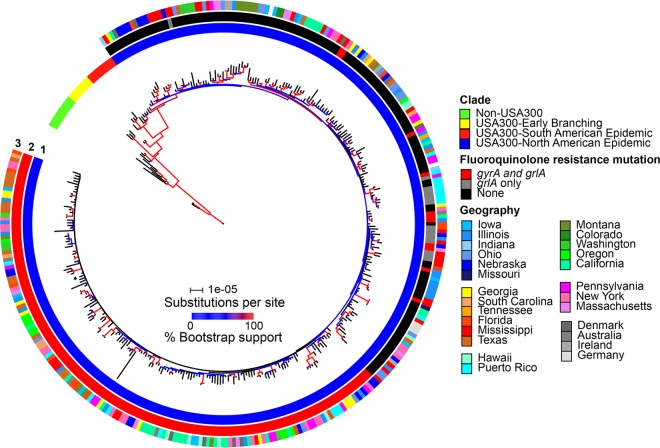
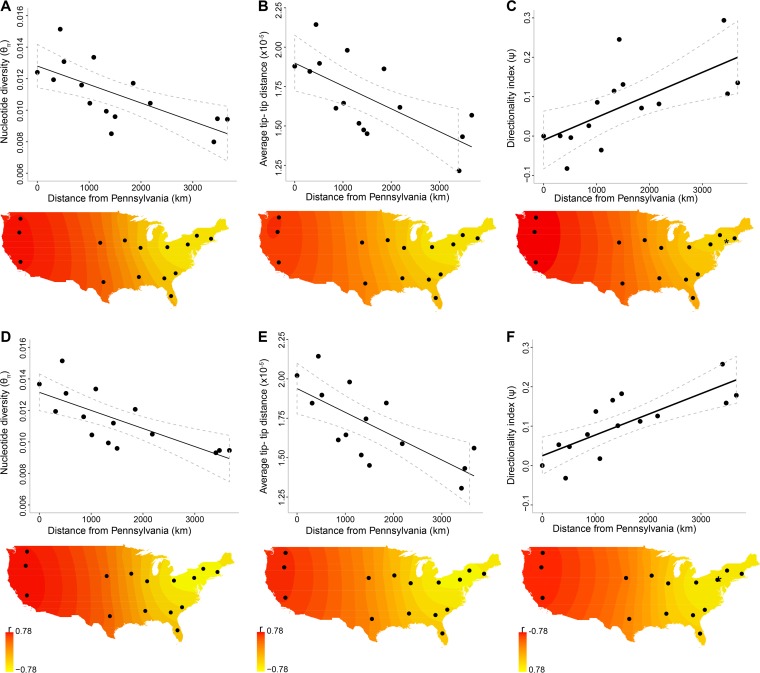
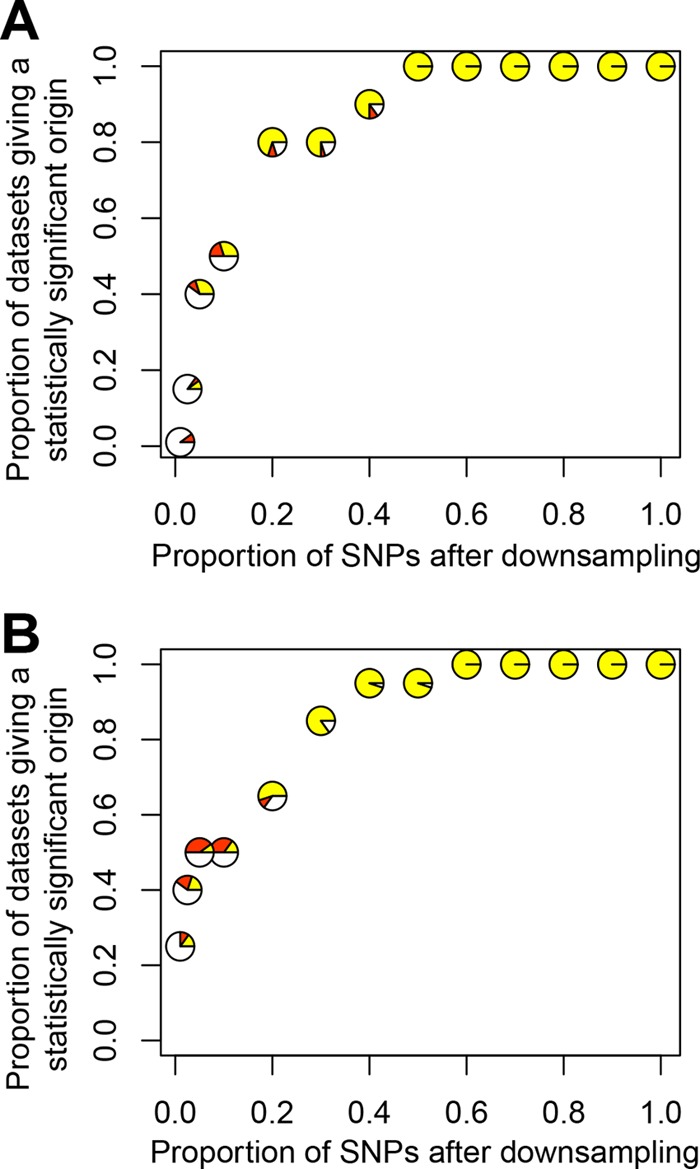
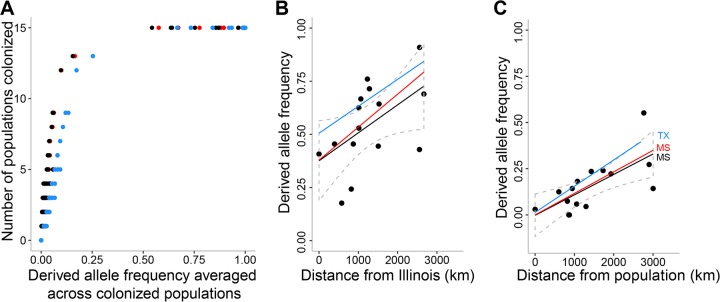
The USA300 North American epidemic (USA300-NAE) clone of methicillin-resistant Staphylococcus aureus has caused a wave of severe skin and soft tissue infections in the United States since it emerged in the early 2000s, but its geographic origin is obscure. Here we use the population genomic signatures expected from the serial founder effects of a geographic range expansion to infer the origin of USA300-NAE and identify polymorphisms associated with its spread. Genome sequences from 357 isolates from 22 U.S. states and territories and seven other countries are compared. We observe two significant signatures of range expansion, including decreases in genetic diversity and increases in derived allele frequency with geographic distance from the Pennsylvania region. These signatures account for approximately half of the core nucleotide variation of this clone, occur genome wide, and are robust to heterogeneity in temporal sampling of isolates, human population density, and recombination detection methods. The potential for positive selection of a gyrA fluoroquinolone resistance allele and several intergenic regions, along with a 2.4 times higher recombination rate in a resistant subclade, is noted. These results are the first to show a pattern of genetic variation that is consistent with a range expansion of an epidemic bacterial clone, and they highlight a rarely considered but potentially common mechanism by which genetic drift may profoundly influence bacterial genetic variation.IMPORTANCE The process of geographic spread of an origin population by a series of smaller populations can result in distinctive patterns of genetic variation. We detect these patterns for the first time with an epidemic bacterial clone and use them to uncover the clone's geographic origin and variants associated with its spread. We study the USA300 clone of methicillin-resistant Staphylococcus aureus, which was first noticed in the early 2000s and subsequently became the leading cause of skin and soft tissue infections in the United States. The eastern United States is the most likely origin of epidemic USA300. Relatively few variants, which include an antibiotic resistance mutation, have persisted during this clone's spread. Our study suggests that an early chapter in the genetic history of this epidemic bacterial clone was greatly influenced by random subsampling of isolates during the clone's geographic spread.
Keywords: epidemics; fluoroquinolones; founder effects; genetic drift; population genetics; range expansion.
Copyright © 2018 Challagundla et al.
Figures
References
-
- Centers for Disease Control and Prevention 2001. Methicillin-resistant Staphylococcus aureus skin or soft tissue infections in a state prison—Mississippi, 2000. MMWR Morb Mortal Wkly Rep 50:919–922. https://www.cdc.gov/mmwr/preview/mmwrhtml/mm5042a2.htm. - PubMed
-
- Centers for Disease Control and Prevention 2003. Methicillin-resistant Staphylococcus aureus infections among competitive sports participants—Colorado, Indiana, Pennsylvania, and Los Angeles County, 2000–2003. MMWR Morb Mortal Wkly Rep 52:793–795. https://www.cdc.gov/mmwr/preview/mmwrhtml/mm5233a4.htm. - PubMed
-
- Centers for Disease Control and Prevention 2003. Methicillin-resistant Staphylococcus aureus infections in correctional facilities—Georgia, California, and Texas, 2001–2003. MMWR Morb Mortal Wkly Rep 52:992–996. https://www.cdc.gov/mmwr/preview/mmwrhtml/mm5241a4.htm. - PubMed
Publication types
MeSH terms
Grants and funding
LinkOut - more resources
Full Text Sources
Other Literature Sources
Medical
