. 2018 Jan 2;9(1):37.
doi: 10.1038/s41467-017-02448-6.

Staphylococcus aureus produces pain through pore-forming toxins and neuronal TRPV1 that is silenced by QX-314

Affiliations

Staphylococcus aureus produces pain through pore-forming toxins and neuronal TRPV1 that is silenced by QX-314

Kimbria J Blake et al. Nat Commun. .

Abstract

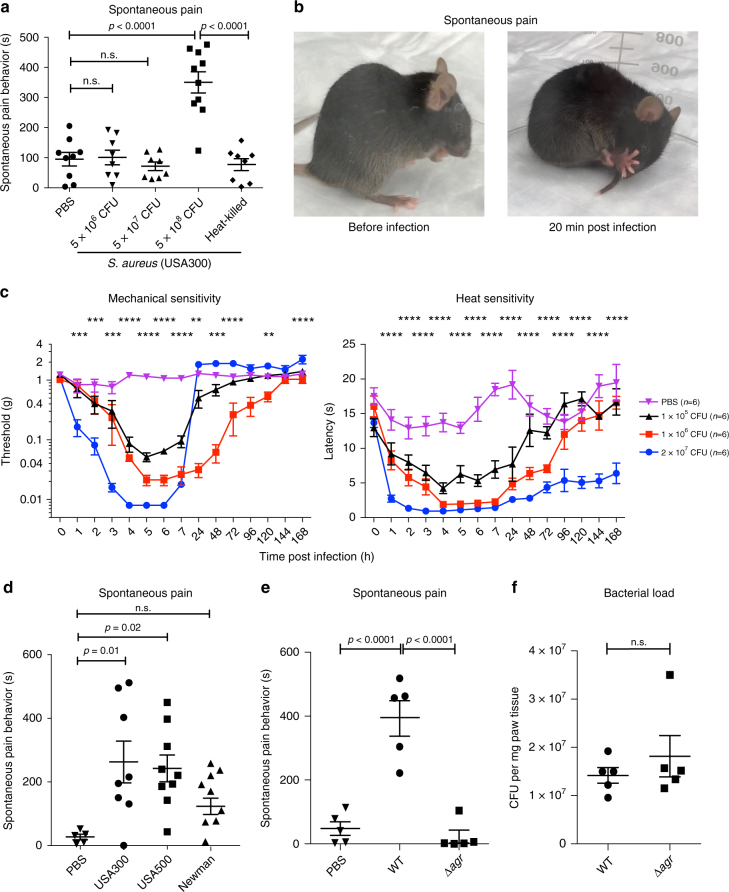
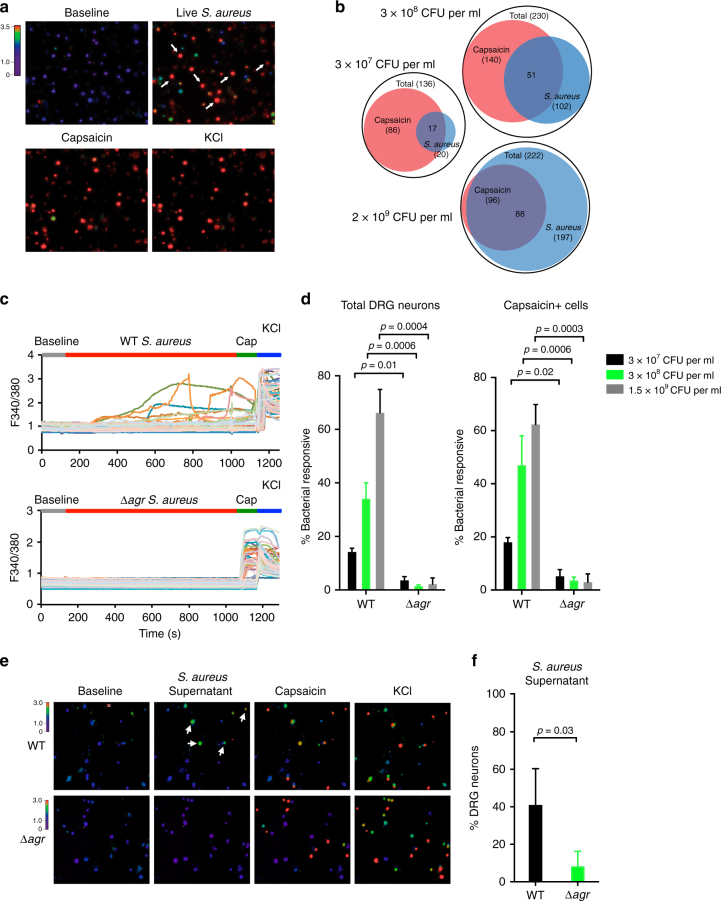
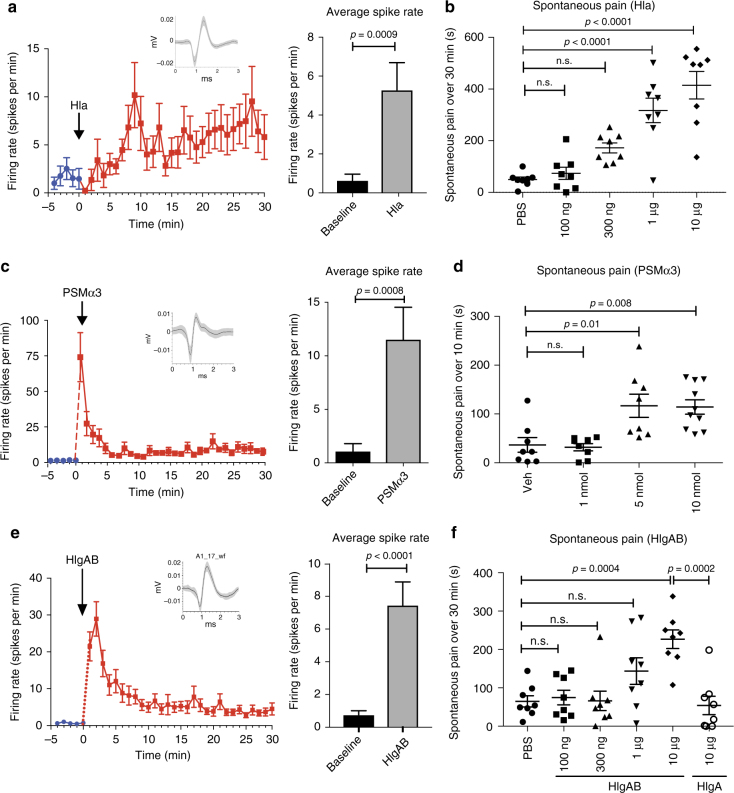
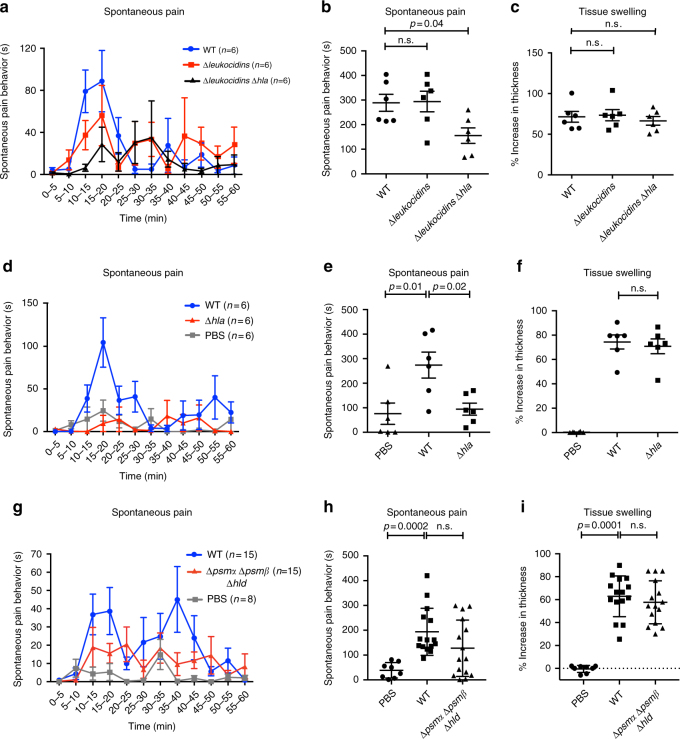
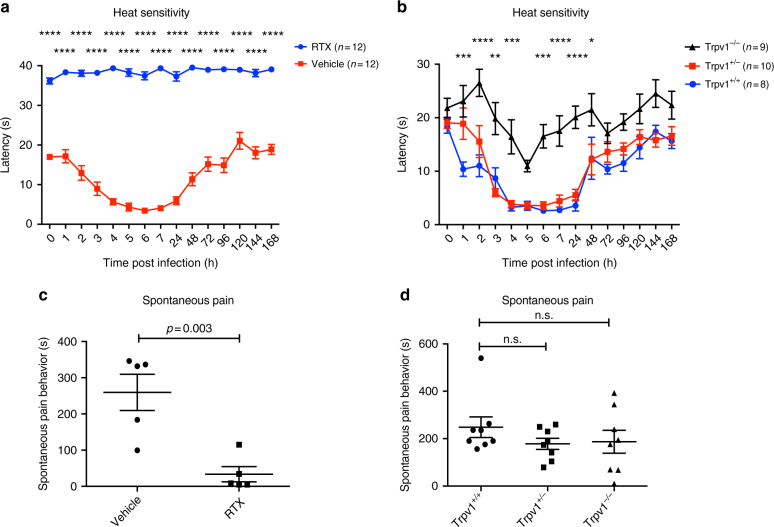
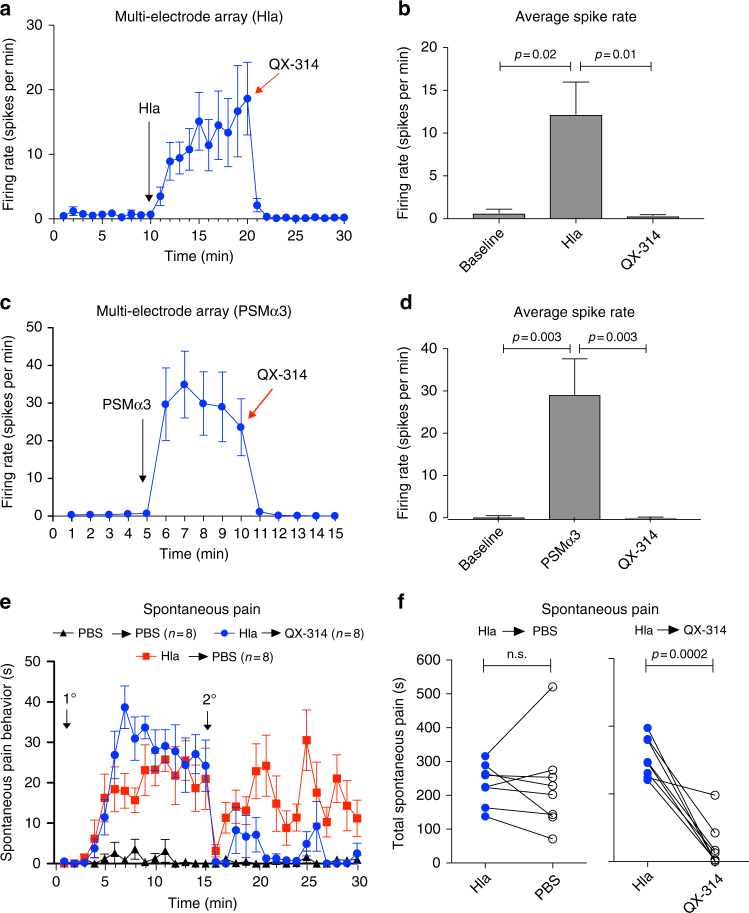
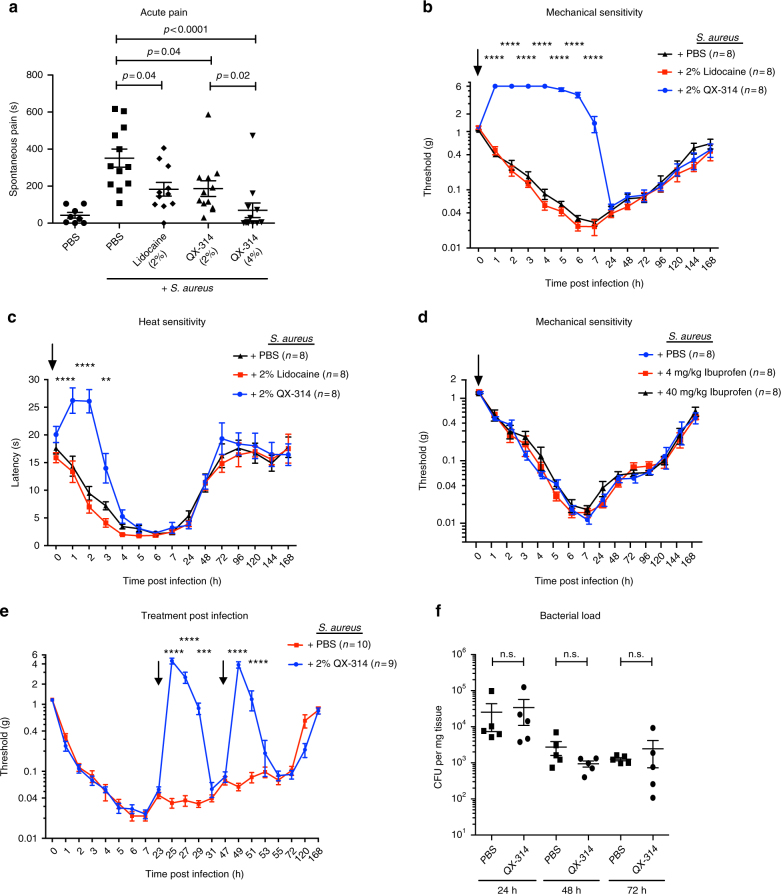
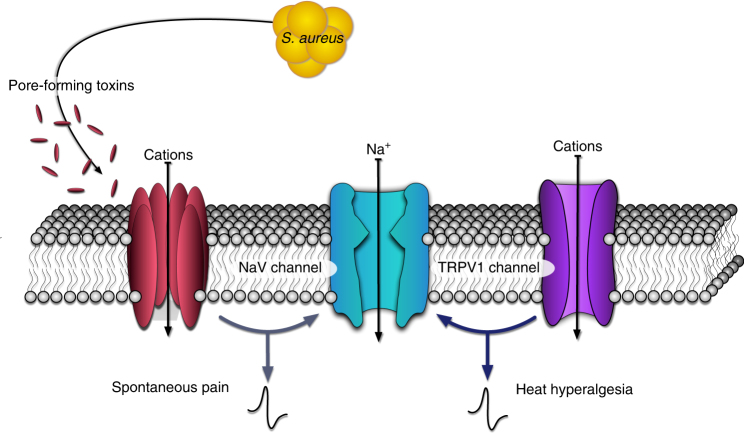
The hallmark of many bacterial infections is pain. The underlying mechanisms of pain during live pathogen invasion are not well understood. Here, we elucidate key molecular mechanisms of pain produced during live methicillin-resistant Staphylococcus aureus (MRSA) infection. We show that spontaneous pain is dependent on the virulence determinant agr and bacterial pore-forming toxins (PFTs). The cation channel, TRPV1, mediated heat hyperalgesia as a distinct pain modality. Three classes of PFTs-alpha-hemolysin (Hla), phenol-soluble modulins (PSMs), and the leukocidin HlgAB-directly induced neuronal firing and produced spontaneous pain. From these mechanisms, we hypothesized that pores formed in neurons would allow entry of the membrane-impermeable sodium channel blocker QX-314 into nociceptors to silence pain during infection. QX-314 induced immediate and long-lasting blockade of pain caused by MRSA infection, significantly more than lidocaine or ibuprofen, two widely used clinical analgesic treatments.


Conflict of interest statement

The authors declare no competing financial interests.

Figures

Fig. 1
Fig. 1
Methicillin-resistant S. aureus infection induces dose-dependent spontaneous pain and mechanical and heat hyperalgesia. a S. aureus infection (MRSA strain USA300) induces dose-dependent spontaneous pain reflexes (lifting/licking/flinching behaviors) in mice measured over 60 min post infection (5 × 106, n = 8 mice per group; 5 × 107, n = 8 mice per group; 5 × 108, n = 10 mice per group CFU). By contrast, heat-killed bacteria (5 × 108 CFU), n = 8 mice per group does not produce spontaneous pain. PBS control, n = 9 mice per group. b Representative images of a mouse before (left) and 20 min after infection (right) with 5 × 108 CFU of S. aureus. c S. aureus (USA300) induces dose-dependent mechanical hyperalgesia (assayed by von Frey filaments) and heat hyperalgesia (assayed by the Hargreaves’ test) measured over 168 h post infection. Two-way ANOVA with Tukey’s post-tests comparing PBS vs. 2 × 107 CFU S. aureus: **p < 0.01; ***p < 0.001; ****p < 0.0001. n = 6 mice per group. d Spontaneous pain induced by injection with PBS or 5 × 108 CFU of different S. aureus strains (methicillin-resistant strains USA300 and USA500, or methicillin-sensitive strain Newman). PBS, n = 5; USA300, n = 7; USA500 and Newman, n = 8 mice per group. e Spontaneous pain reflexes induced by PBS, USA300 (WT), or USA300 isogenic mutant bacteria lacking the agr system (∆agr). Pain depends on the presence of agr. n = 5 mice per group. f Bacterial load recovery from mice infected by WT or Δagr USA300 1 h post infection. n = 5 mice per group. a, d N = 3 replicates; c, e, N = 2 replicates; f, N = 1 replicate. af Symbols represent individual mice. Statistical comparisons by one-way ANOVA with Tukey’s post-tests. Error bars throughout figure, mean ± s.e.m.
Fig. 2
Fig. 2
Live S. aureus directly induces DRG neuronal responses dependent on the agr virulence determinant. a Representative fields of Fura-2 calcium imaging of DRG sensory neurons exposed to live S. aureus (USA300, 2 × 109 CFU per ml), followed by capsaicin (1 μM) to activate nociceptors, and KCl (40 mM) to depolarize all sensory neurons. Arrows indicate neurons responding to bacteria. b Venn diagrams showing subsets of DRG neurons responding to different doses of live S. aureus or to the TRPV1 ligand, capsaicin. c Neuronal calcium traces from representative fields of neurons exposed to WT or Δagr S. aureus (1.5 × 109 CFU per ml), followed by capsaicin (1 μM), and KCl (40 mM). d Quantification of the proportion of total DRG neurons (left) or capsaicin + neurons (right) responding to WT or Δagr S. aureus at three different bacterial doses: 3 × 107 CFU per ml: n = 3 fields each; 3 × 108 CFU per ml: n = 5 fields each; 1.5 × 109 CFU per ml: n = 4 fields each. p values, unpaired t test. e Representative imaging fields (arrows indicate neurons responding to bacterial supernatant) and f quantification of the proportion of neurons responding to culture supernatant from WT or Δagr S. aureus. n = 4 fields (WT), n = 3 fields (Δagr). ad, N = 3 replicates; f, N = 2 replicates. p values, unpaired t test; error bars throughout figure, mean ± s.e.m.
Fig. 3
Fig. 3
Three distinct types of PFTs from S. aureus induce DRG neuron firing in vitro and induce spontaneous pain reflexes in vivo. a, c, e DRG neuron action potential generation was quantified on multi-electrode arrays (MEAs) after application of PFTs. On left, spike rate is plotted before (blue) and after (red) application of the toxin to neurons. Arrow indicates addition of toxin. Representative action potential of an active electrode is shown above the time course. On right, average spike rate was quantified and compared at baseline (over 5 min) and after toxin addition (over 30 min) for active electrodes. a α-hemolysin (Hla) of 30 μg/ml (or 1 μM) induces action potential firing in DRG neurons as quantified by MEA analysis, n = 17 active electrodes over five plates. b Hla was injected into mice at increasing doses and spontaneous pain quantified over 30 min (n = 8 mice per group). c PSMα3 of 10 μM (or 270 μg/ml) induces action potential firing in DRG neurons as quantified by MEA analysis. n = 41 electrodes over three plates. d PSMα3 was injected into mice at increasing doses and spontaneous pain in mice quantified over 10 min. Vehicle is 5% DMSO in PBS. (n = 8 mice per group). e HlgAB of 3 μg/ml (1 μM of each subunit) induces action potential firing in DRG neurons as quantified by MEA analysis, n = 74 electrodes over seven plates. f HlgAB was injected into mice at increasing doses and spontaneous pain quantified over 30 min. HgAB’s individual component, HlgA does not induce spontaneous pain behavior. (n = 8 mice per group). a, c, e Statistical comparisons by paired t test; N = 3 replicates per toxin. b, d, f Statistical comparisons and p values by one-way ANOVA with Tukey’s post-tests; N = 2–3 replications per toxin. Error bars throughout figure, mean ± s.e.m.
Fig. 4
Fig. 4
Alpha-hemolysin is necessary for spontaneous pain during live S. aureus infection. Mice were infected with WT or isogenic mutant strains of S. aureus lacking specific PFTs (USA300, 5 × 108 CFU) to determine the role of distinct toxins in spontaneous pain production. a Time course of spontaneous pain reflexes plotted over 5-min intervals after infection with WT S. aureus, Δleukocidins, or ΔleukocidinsΔhla isogenic mutant S. aureus. n = 6 mice per group. b Quantification of pain over 60 min of infection with WT, Δleukocidins, or ΔleukocidinsΔhla S. aureus. n = 6 mice per group. c Measurement of tissue swelling after infection with WT, ΔleukocidinsΔhla, or Δhla S. aureus. n = 6 mice per group. d Time course of spontaneous pain behavior for WT vs. Δhla S. aureus. n = 6 mice per group. e Quantification of pain over 60 min of infection with WT vs. Δhla S. aureus. n = 6 mice per group. f Measurement of tissue swelling after infection with WT vs. Δhla S. aureus. Hla contributes only to spontaneous pain. n = 6 mice per group. g Time course of spontaneous pain behavior for PBS vs. WT S. aureus vs. S. aureus deficient in all phenol-soluble modulins (PSMs) (ΔpsmαΔpsmβΔhld). n = 8–15 mice per group. h Quantification of spontaneous pain after infection with PBS (n = 8 mice per group) vs. WT (n = 14 mice per group) vs. ΔpsmαΔpsmβΔhld (n = 15 mice per group) S. aureus over 60 min. i Measurement of tissue swelling after infection with PBS (n = 8 mice per group) vs. WT S. aureus (n = 14 mice per group) vs. S. aureus deficient in all PSMs (n = 15 mice per group). bi: p values, one-way ANOVA with Tukey’s post-tests. af N = 2 replicates; gi N = 4 replicates. Error bars throughout figure, mean ± s.e.m.
Fig. 5
Fig. 5
Trpv1 mediates heat hyperalgesia during S. aureus infection. a Heat hyperalgesia was measured by the Hargreaves’ radiant heat test in resiniferatoxin (RTX) vs. vehicle-treated mice following S. aureus infection (1 × 106 CFU, USA300). Forty seconds is the maximum cutoff for this assay. n = 12 mice per group. p values, two-way ANOVA with Sidak’s post-test. b Heat hyperalgesia measured in Trpv1−/− compared to Trpv1+/− or Trpv1+/+ littermates following S. aureus infection. Statistical comparisons shown: Trpv1−/− vs. Trpv1+/+ littermates. p values, two-way ANOVA with Tukey’s post-test. n = 8–10 mice per group. c Spontaneous pain was quantified over 60 min in RTX or vehicle-treated mice infected with S. aureus (USA300, 5 × 108 CFU). n = 5 mice per group. p values by unpaired t test. d Spontaneous pain was quantified over 60 min in Trpv1−/− mice and littermate (Trpv1+/−, Trpv1+/+) controls in S. aureus-infected mice (USA300, 5 × 108 CFU). n = 8 mice per group. a, c N = 2 replicates; b, d N = 3 replicates each. p values, one-way ANOVA, Tukey’s post-test. ****p < 0.0001; ***p < 0.001; **p < 0.01; *p < 0.05. Error bars throughout figure, mean ± s.e.m.
Fig. 6
Fig. 6
QX-314 blocks PFT induced DRG neuronal firing in vitro and spontaneous pain in vivo. a, c DRG neuronal firing measurement on multi-electrode array (MEA) plates after sequential applications of Hla (30 μg/ml or 1 μM) at 10 min and 5 mM QX-314 at 20 min (a) or PSMα3 (270 μg/ml or 10 μM) at 5 min and 5 mM QX-314 at 10 min (c). Arrows indicate time of Hla, PSMα3, and QX-314 applications; n = 20 electrodes over six plates (a) and n = 46 electrodes over three plates (c). b, d Average spike rate calculated over 5 min at baseline and after applications of the toxin (Hla (b) and PSMα3 (d)) and after application of QX-314, statistical comparisons by repeated measures (RM) one-way ANOVA with Tukey’s post-tests. e Spontaneous pain was measured in 1-min time intervals after injection of either Hla (1 μg or 1.7 μM) or PBS into the hind paw. At the 15-min time point, mice were then injected with either 2% QX-314 or PBS (arrows indicate times of injection of each item; n = 8 mice per group). f Quantification of spontaneous pain over 30 min. Data in e shows a significant decrease in total Hla-induced spontaneous pain after QX-314 but not PBS treatment. af N = 3 replicates. p values, paired t tests. n = 8 mice per group. Error bars throughout figure, mean ± s.e.m.
Fig. 7
Fig. 7
QX-314 alleviates spontaneous pain, mechanical, and thermal hyperalgesia during S. aureus infection. a Total spontaneous pain over 60 min induced by S. aureus (5 × 108 CFU, USA300) injection together with QX-314 (2 or 4%), n = 12 mice per group; lidocaine (2%), n = 11 mice per group; or vehicle (PBS), n = 12 mice per group. Vehicle control (PBS followed with PBS treatment), n = 8 mice per group. p values by one-way ANOVA, Tukey’s post-tests. b Mechanical hyperalgesia induced by S. aureus infection (1 × 106 CFU) was measured by von Frey hair tests. Mice were co-injected with QX-314 (2%), lidocaine (2%), or PBS at infection (arrows). Statistical comparisons: QX-314 vs. PBS, two-way ANOVA with Tukey’s post-tests. n = 8 mice per group. c Heat hyperalgesia induced by S. aureus (1 × 106 CFU) was measured by the Hargreaves’ radiant heat test. Mice were co-injected with QX-314 (2%), lidocaine (2%), or PBS at infection (arrows). Statistical comparison: QX-314 vs. PBS. n = 8 mice per group. p values, two-way ANOVA, Tukey’s post-tests. d Mechanical hyperalgesia induced by S. aureus infection (1 × 106 CFU) was measured in presence of ibuprofen. Ibuprofen (4 mg/kg or 40 mg/kg) or PBS was co-injected of at the time of S. aureus infection (1 × 106 CFU) (arrows), n = 8 mice per group. p values, two-way ANOVA with Tukey’s post-tests. e Mice were infected with S. aureus (1 × 106 CFU) and injected with QX-314 (2%) or with PBS at two indicated time points post infection (arrows indicate QX-314 or PBS injections). n = 9–10 mice per group. p values, two-way ANOVA, Sidak’s post-tests. f Bacterial load of S. aureus infection (1 × 106 CFU) after treatment (1, 2, or 3 times) with 2% QX-314. n = 5 mice per group. a N = 4 replicates; b, c N = 2 replicates; df N = 1 replicate. p values, one-way ANOVA with Tukey’s post-tests. ****p < 0.0001, ***p < 0.001, **p < 0.01, *p < 0.05. Error bars throughout figure, mean ± s.e.m.
Fig. 8
Fig. 8
Molecular mechanisms of pain during live S. aureus infection. S. aureus induces significant spontaneous pain mediated by PFTs. S. aureus secretes several types of PFTs including α-hemolysin, PSMα3, and HlgAB, which can form pores in DRG neuronal membranes sufficient for cation influx and action potential generation. All three types of PFTs produce spontaneous pain when injected into mice, but only α-hemolysin is necessary for S. aureus-induced spontaneous pain. As a separate pain modality, S. aureus induces significant heat hyperalgesia, which is dependent on TRPV1 ion channels

References

    1. Basbaum AI, Bautista DM, Scherrer G, Julius D. Cellular and molecular mechanisms of pain. Cell. 2009;139:267–284. doi: 10.1016/j.cell.2009.09.028. - DOI - PMC - PubMed
    1. Dubin AE, Patapoutian A. Nociceptors: the sensors of the pain pathway. J. Clin. Invest. 2010;120:3760–3772. doi: 10.1172/JCI42843. - DOI - PMC - PubMed
    1. Julius D. TRP channels and pain. Annu. Rev. Cell Dev. Biol. 2013;29:355–384. doi: 10.1146/annurev-cellbio-101011-155833. - DOI - PubMed
    1. Chiu IM, Pinho-Ribeiro FA, Woolf CJ. Pain and infection: pathogen detection by nociceptors. Pain. 2016;157:1192–1193. doi: 10.1097/j.pain.0000000000000559. - DOI - PMC - PubMed
    1. Chiu IM, et al. Bacteria activate sensory neurons that modulate pain and inflammation. Nature. 2013;501:52–57. doi: 10.1038/nature12479. - DOI - PMC - PubMed

Publication types

MeSH terms