. 2017 Nov 7;8(12):5384-5398.
doi: 10.1364/BOE.8.005384. eCollection 2017 Dec 1.

Automated detection of photoreceptor disruption in mild diabetic retinopathy on volumetric optical coherence tomography

Affiliations

Automated detection of photoreceptor disruption in mild diabetic retinopathy on volumetric optical coherence tomography

Zhuo Wang et al. Biomed Opt Express. .

Abstract

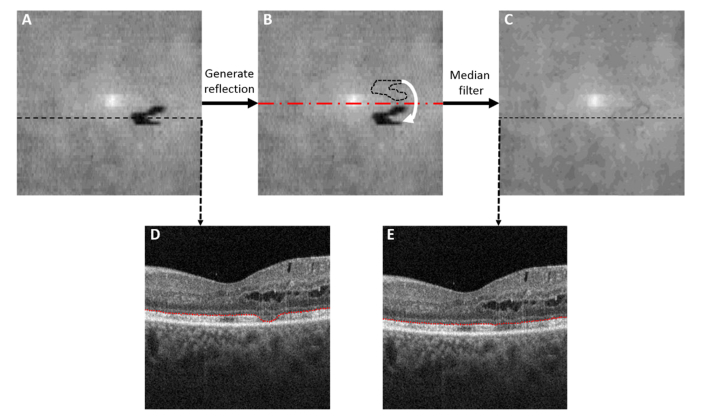
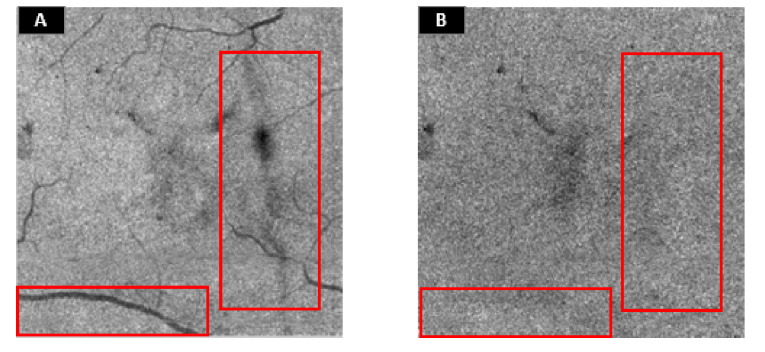
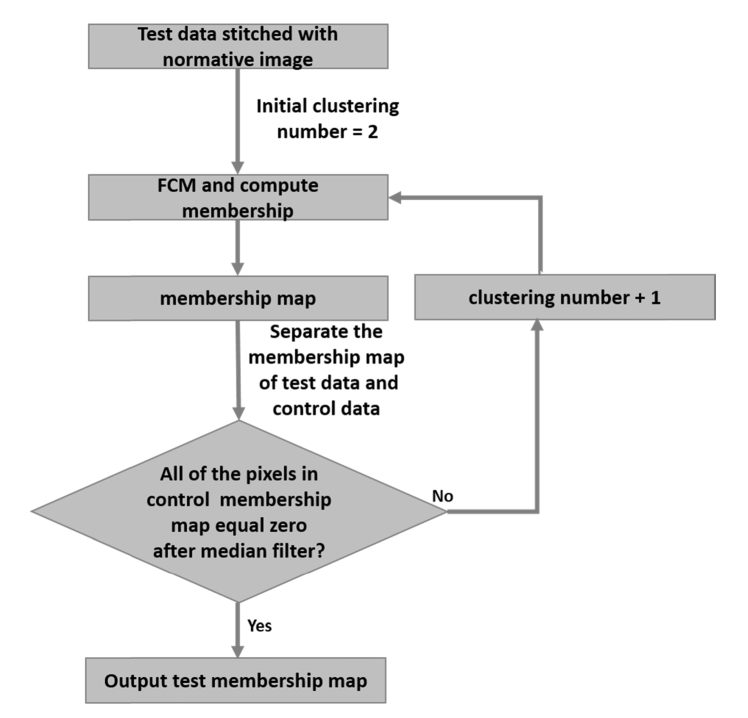
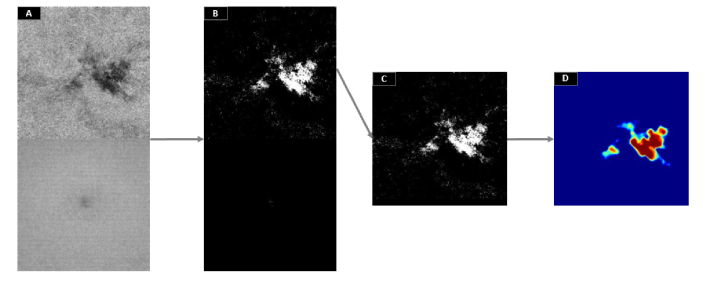
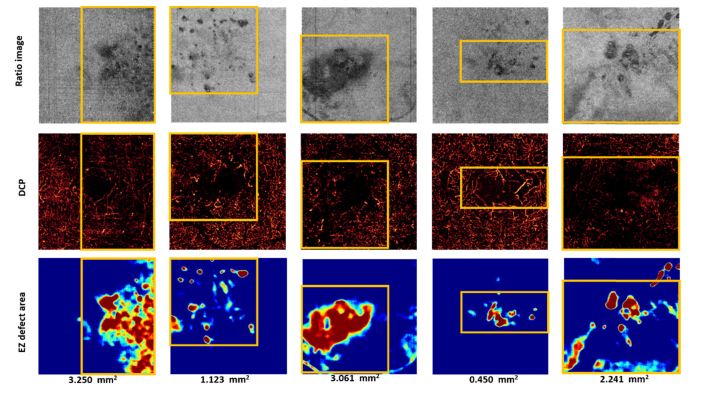
Diabetic retinopathy is a pathology where microvascular circulation abnormalities ultimately result in photoreceptor disruption and, consequently, permanent loss of vision. Here, we developed a method that automatically detects photoreceptor disruption in mild diabetic retinopathy by mapping ellipsoid zone reflectance abnormalities from en face optical coherence tomography images. The algorithm uses a fuzzy c-means scheme with a redefined membership function to assign a defect severity level on each pixel and generate a probability map of defect category affiliation. A novel scheme of unsupervised clustering optimization allows accurate detection of the affected area. The achieved accuracy, sensitivity and specificity were about 90% on a population of thirteen diseased subjects. This method shows potential for accurate and fast detection of early biomarkers in diabetic retinopathy evolution.

Keywords: (100.6890) Three-dimensional image processing; (170.1610) Clinical applications; (170.4470) Ophthalmology; (170.4500) Optical coherence tomography.


Conflict of interest statement

Oregon Health & Science University (OHSU), Yali Jia, and David Huang have a significant financial interest in Optovue, Inc. Miao Zhang is an employee of Optovue, Inc. These potential conflicts of interest have been reviewed and managed by OHSU.

Figures

Fig. 1
Fig. 1
Flow chart of the ellipsoid zone (EZ) defect detection algorithm. The pre-processing step generates a ratio image of registered EZ and external limiting membrane (ELM) en face images. The EZ defect detection step first stitches the ratio image under examination to a normative ratio image obtained from the healthy control group, then calculates the optimal number of clusters by a fuzzy c-means algorithm, removes noise by a median filter and finally assigns to each pixel a defect severity degree by a redefined function of membership to the defect category. The post-processing step filters out residual noise and generates the final defect severity map.
Fig. 2
Fig. 2
Routine for detection of inner boundary of ellipsoid zone (EZ) location slab. Firstly, drastic EZ segmentation changes due to large photoreceptor loss are identified by pixels with abnormally low value in an EZ/Bruch’s membrane thickness map (A). Then, the reflection of the EZ segmentation area is generated with respect to a horizontal line crossing the center of the en face image (B) and the EZ location at the pixels below threshold is substituted by the pixels in its symmetric reflection. Finally, a median filter is applied to ensure a smooth EZ segmentation across the whole scan (C). Representative B-scans are shown before (D) and after EZ smoothing (E). As observed in (D), the directional graph search algorithm can properly segment the areas with partial EZ loss but not the areas with total EZ loss.
Fig. 3
Fig. 3
Generation of external limiting membrane (ELM) and ellipsoid zone (EZ) en face images based on the smoothed EZ inner boundary segmentation . (A) A representative B-scan. The red dashed line indicates the smoothed EZ inner boundary. The blue dashed line indicates the boundary position of the slab used to generate the EZ en face image in (B). The yellow dashed line indicates the boundary position of the slab used to generate the ELM en face image in (C).
Fig. 4
Fig. 4
Illustration of the reduced signal variation on the ratio image. (A) Ellipsoid zone (EZ) en face image. (B) Ratio image. The suppression of shadowing artifacts is shown in the red boxes.
Fig. 5
Fig. 5
Different damage degree of the ellipsoid zone (EZ) observed on a ratio en face image (A) and a representative B-scan (B). The yellow arrow represents the more severely damaged EZ area; the orange arrow represent the healthy EZ area; the blue arrow represents the slightly damaged EZ area.
Fig. 6
Fig. 6
Iterating routine that calculates the optimal number of clusters to divide the en face ratio data. FCM – Fuzzy c-means.
Fig. 7
Fig. 7
Generation of a defect severity map. (A) The ratio image from a mild diabetic retinpathy scan with an ellipsoid zone (EZ) defect (upper half) is stitched to the normative ratio image obtained from a control group of ten healthy subjects (bottom half). (B) Fuzzy c-means with corrected membership function is applied on image (A) for progressively larger cluster numbers until the bottom half shows a detected area equal to zero. (C) The upper half of image (B) showing the detected EZ defect region, corrupted by peripheral noise. (D) is the defect severity map after cleanup by a median filter.
Fig. 8
Fig. 8
Comparison of the number of clusters (A) and defect area (B) found for the mild diabetic retinopathy (DR) and healthy groups upon either convergence of the iterative cluster optimization routine or reaching the maximum allowed number of iterations. Defect area is given in mm2.
Fig. 9
Fig. 9
Comparison of detection of ellipsoid zone (EZ) defect area between the automated algorithm and manual grading on B-scans in five representative diabetic retinpathy (DR) cases. The top row shows the ratio images, the middle row shows the EZ defect area extracted by the proposed algorithm. The bottom row shows the comparison of automatic detection with B-scan manual grading. The red area represents the subgroups where the EZ defect was identified correctly by both the algorithm and the grader. The light blue area represents the EZ defect subgroups detected by manual grading. The dark blue area was the healthy area detected by the manual grader. The yellow area represents the subgroups identified by the algorithm only.
Fig. 10
Fig. 10
Comparison of detection of ellipsoid zone (EZ) defect area between the automated algorithm and manual grading on ratio image. The top row shows the ratio images. The second row shows the manual grading results. Annular regions with EZ defect (red) were differentiated from regions with healthy EZ (green). The bottom row shows the EZ defect area extracted by the fuzzy logic algorithm. DR – Diabetic retinopathy.
Fig. 11
Fig. 11
Relationship between ellipsoid zone (EZ) defect area and the area with microvascular abnormalities. The top row shows the ratio images. The middle row shows the deep capillary plexus. The yellow boxes indicate areas of reduced capillary perfusion. The bottom row shows the EZ defect area extracted by the proposed algorithm. DCP – Deep capillary plexus.

Similar articles

Cited by

References

    1. Yau J. W. Y., Rogers S. L., Kawasaki R., Lamoureux E. L., Kowalski J. W., Bek T., Chen S.-J., Dekker J. M., Fletcher A., Grauslund J., Haffner S., Hamman R. F., Ikram M. K., Kayama T., Klein B. E. K., Klein R., Krishnaiah S., Mayurasakorn K., O’Hare J. P., Orchard T. J., Porta M., Rema M., Roy M. S., Sharma T., Shaw J., Taylor H., Tielsch J. M., Varma R., Wang J. J., Wang N., West S., Xu L., Yasuda M., Zhang X., Mitchell P., Wong T. Y., Meta-Analysis for Eye Disease (META-EYE) Study Group , “Global Prevalence and Major Risk Factors of Diabetic Retinopathy,” Diabetes Care 35(3), 556–564 (2012). - PMC - PubMed
    1. Lee R., Wong T. Y., Sabanayagam C., “Epidemiology of diabetic retinopathy, diabetic macular edema and related vision loss,” Eye Vis (Lond) 2, 17 (2015). - PMC - PubMed
    1. Huang D., Swanson E. A., Lin C. P., Schuman J. S., Stinson W. G., Chang W., Hee M. R., Flotte T., Gregory K., Puliafito C. A., et al. ., “Optical coherence tomography,” Science 254(5035), 1178–1181 (1991). - PMC - PubMed
    1. Tao L. W., Wu Z., Guymer R. H., Luu C. D., “Ellipsoid zone on optical coherence tomography: a review,” Clin. Experiment. Ophthalmol. 44(5), 422–430 (2016). - PubMed
    1. Staurenghi G., Sadda S., Chakravarthy U., Spaide R. F., International Nomenclature for Optical Coherence Tomography (IN•OCT) Panel , “Proposed Lexicon for Anatomic Landmarks in Normal Posterior Segment Spectral-Domain Optical Coherence Tomography: the IN•OCT consensus,” Ophthalmology 121(8), 1572–1578 (2014). - PubMed