. 2017 Nov 13;8(12):5560-5578.
doi: 10.1364/BOE.8.005560. eCollection 2017 Dec 1.

Multi-directional optical coherence tomography for retinal imaging

Affiliations

Multi-directional optical coherence tomography for retinal imaging

Andreas Wartak et al. Biomed Opt Express. .

Abstract

We introduce multi-directional optical coherence tomography (OCT), a technique for investigation of the scattering properties of directionally reflective tissue samples. By combining the concepts of multi-channel and directional OCT, this approach enables simultaneous acquisition of multiple reflectivity depth-scans probing a mutual sample location from differing angular orientations. The application of multi-directional OCT in retinal imaging allows for in-depth investigations on the directional reflectivity of the retinal nerve fiber layer, Henle's fiber layer and the photoreceptor layer. Major ophthalmic diseases (such as glaucoma or age-related macular degeneration) have been reported to alter the directional reflectivity properties of these retinal layers. Hence, the concept of multi-directional OCT might help to gain improved understanding of pathology development and progression. As a first step, we demonstrate the capabilities of multi-directional OCT in the eyes of healthy human volunteers.

Keywords: (110.4500) Optical coherence tomography; (170.0170) Medical optics and biotechnology; (170.4470) Ophthalmology.


Conflict of interest statement

The authors declare that there are no conflicts of interest related to this article.

Figures

Fig. 1
Fig. 1
(a) Fundus photo of a healthy eye indicating the two retinal regions of interest (ROIs) investigated in this work: the perpapillary (including the ONH) and the macular region (including the fovea). The applied scanning patterns per ROI are indicated by black arrows (ONH: circumpapillary (CP); fovea: linear and raster). (b) Representative linear scan through the macular region of the same eye. Retinal and choroidal layers (labelled according to [36]): ILM – inner limiting membrane; RNFL – retinal nerve fiber layer; GCL – ganglion cell layer; IPL – inner plexiform layer; INL – inner nuclear layer; OPL – outer plexiform layer; HFL – Henle’s fiber layer; ONL – outer nuclear layer; ELM – external limiting membrane; IS/OS – inner segment/outer segment junction; OS – outer segments; COST/RPE – cone outer segment tips/retinal pigment epithelium; ICH – inner choroid; OCH – outer choroid. (c) Schematics of the three-channel illumination (equilateral triangle geometry). (d) Beam configuration on the 2D-MEMS scanner (in the equilateral triangle geometry all three beams are positioned off-pivot).
Fig. 2
Fig. 2
Flowchart diagram of image analysis for revealing directional contrast among the three simultaneously acquired intensity B-scans. (a) Single-frame registered B-scans of the three channels. (b) Color coded B-scans of (a). (c) Intensity/color averaged and intensity/color maximum intensity projection (MIP) of the three respective fused B-scans. (d) Additive color scheme of primary and secondary colors.
Fig. 3
Fig. 3
CP intensity B-scans of the ONH region. (a) Channel-1 (cyan). (b) Channel-2 (magenta). (c) Channel-3 (yellow). (d) Color averaged image of the three channels. (e)-(h) Zoom-ins of the indicated respective ROI. Scale bars: 0.5 mm (horizontally), 0.2 mm (vertically).
Fig. 4
Fig. 4
Quantitative evaluation of the IS/OS-COST complex. (a) Representative CP B-scan indicating the evaluation window in between the red lines (20 depth-pixels or ~70 μm). (b) Normalized and smoothed intensity distribution within the evaluation window as a function of the azimuth angle (channel-1: cyan; channel-2: magenta; channel-3: yellow). (c) Polar plot of (b): intensity (radius) as a function of the azimuth angle. (d) Color fundus photo (grayscale) overlay of (c) and indication of the respective equilateral triangle beam geometry.
Fig. 5
Fig. 5
Investigation of the repeatability of the quantitative evaluation of the IS/OS-COST complex in one eye of a healthy volunteer. (a) Mean and standard deviation (shaded area indicates ± one standard deviation) of five measurements (acquired within two consecutive days) per channel (channel-1: cyan; channel-2: magenta; channel-3: yellow). Normalized intensity as a function of the A-scan number (or the respective azimuth angle). (b) Polar plot of the mean data of (a): intensity (radius) as a function of the azimuth angle.
Fig. 6
Fig. 6
Investigation of the variability among subjects of multi-directional OCT findings in two additional eyes of two healthy volunteers. (a), (c) Color averaged images of two eyes of two subjects. (b), (d) Respective normalized and smoothed polar plots of the intensity distribution within the evaluation window as a function of the azimuth angle (channel-1: cyan; channel-2: magenta; channel-3: yellow). Scale bars: 0.5 mm (horizontally), 0.2 mm (vertically).
Fig. 7
Fig. 7
Quantitative evaluation of the RNFL. (a) Representative CP B-scan indicating the evaluation window in between the green lines (15 depth-pixels or ~53 μm). (b) Normalized and smoothed intensity distribution within the evaluation window as a function of the azimuth angle (channel-1: cyan; channel-2: magenta; channel-3: yellow). (c) Polar plot of (b): intensity (radius) as a function of the azimuth angle.
Fig. 8
Fig. 8
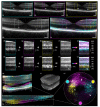
Linear ((a)-(o); 16-times averaged) and volumetric ((p)-(s); single-frame) intensity macular imaging results. (a) Channel-1 (cyan). (b) Channel-2 (magenta). (c) Channel-3 (yellow). (d) Intensity average of the three channels. (e) Color averaged image of the three channels. (f)-(o) Zoom-ins of the indicated respective ROIs. (p) Cross-sectional view of a 3D rendering of a color MIP near the foveal pit. (q) Zoom-in of the indicated ROI in (p) to better visualize HFL. (r) 3D rendering of the volumetric data cube (channel-2). (s) Visualization of HFL in a color MIP en-face projection including indication of the respective equilateral triangle beam geometry. Scale bars: 0.5 mm (horizontally), 0.2 mm (vertically).
Fig. 9
Fig. 9
Compensation of directional reflectivity and comparison of pupil entry position. (a) Single-frame CP intensity B-scan of the off-centered channel-2. (b) Three-channel off-center CP intensity B-scan MIP. (c), (d) Indicated ROI zoom-ins of the PR-layer. (e) Single-frame CP intensity B-scan of the pupil-centered channel-1. (f) MIP of a CP intensity B-scan of the three-frame averaged pupil centered channel-1. Scale bars: 0.5 mm (horizontally), 0.2 mm (vertically).
Fig. 10
Fig. 10
Speckle reduction comparison. (a) Single-frame CP intensity B-scan of channel-1 (a). (b) Three-channel-averaged CP intensity B-scan. (c), (d) Indicated ROI-1 zoom-in on the entire retinal cross-section. (e), (f) Indicated ROI-2 zoom-in on the RNFL. Scale bars: 0.5 mm (horizontally), 0.2 mm (vertically).

References

    1. Schmitt J. M., “Array detection for speckle reduction in optical coherence microscopy,” Phys. Med. Biol. 42(7), 1427–1439 (1997). - PubMed
    1. Iftimia N., Bouma B. E., Tearney G. J., “Speckle reduction in optical coherence tomography by “path length encoded” angular compounding,” J. Biomed. Opt. 8(2), 260–263 (2003). - PubMed
    1. Desjardins A. E., Vakoc B. J., Tearney G. J., Bouma B. E., “Speckle reduction in OCT using massively-parallel detection and frequency-domain ranging,” Opt. Express 14(11), 4736–4745 (2006). - PMC - PubMed
    1. Klein T., André R., Wieser W., Pfeiffer T., Huber R., “Joint aperture detection for speckle reduction and increased collection efficiency in ophthalmic MHz OCT,” Biomed. Opt. Express 4(4), 619–634 (2013). - PMC - PubMed
    1. Yang V. X. D., Munce N., Pekar J., Gordon M. L., Lo S., Marcon N. E., Wilson B. C., Vitkin I. A., “Micromachined array tip for multifocus fiber-based optical coherence tomography,” Opt. Lett. 29(15), 1754–1756 (2004). - PubMed