

Automated multimodal spectral histopathology for quantitative diagnosis of residual tumour during basal cell carcinoma surgery
- PMID: 29296502
- PMCID: PMC5745117
- DOI: 10.1364/BOE.8.005749
Automated multimodal spectral histopathology for quantitative diagnosis of residual tumour during basal cell carcinoma surgery
Abstract
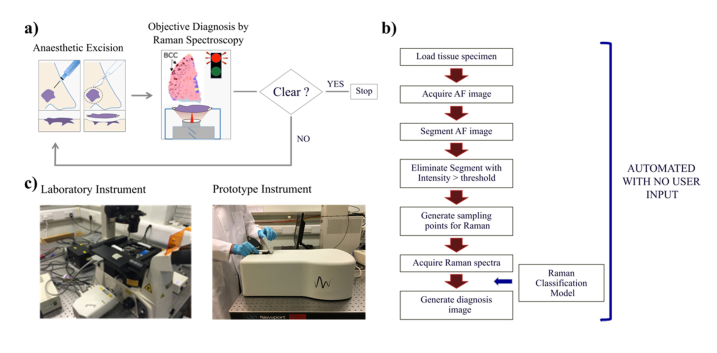
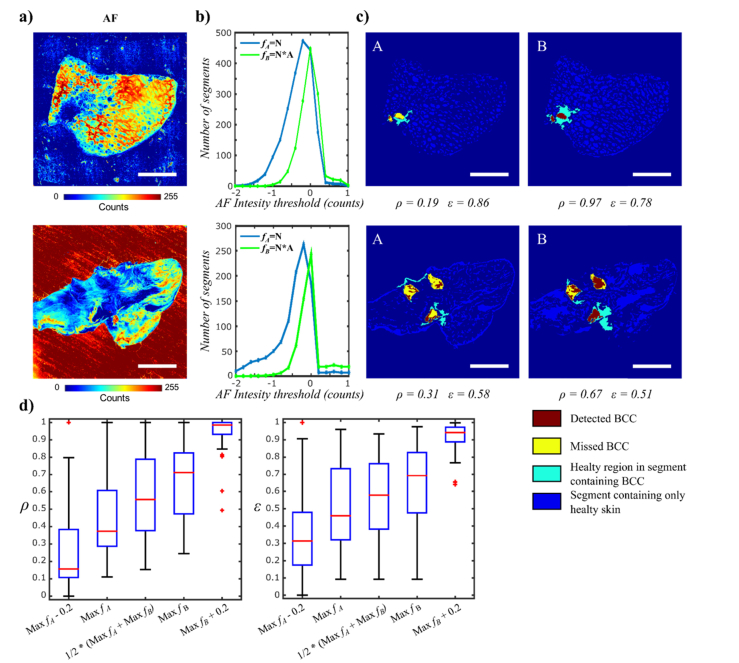
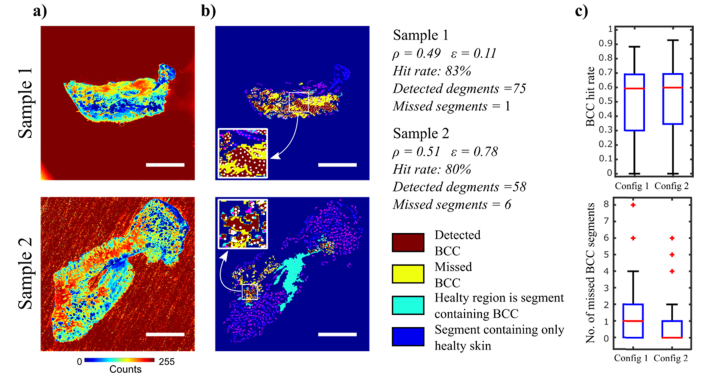
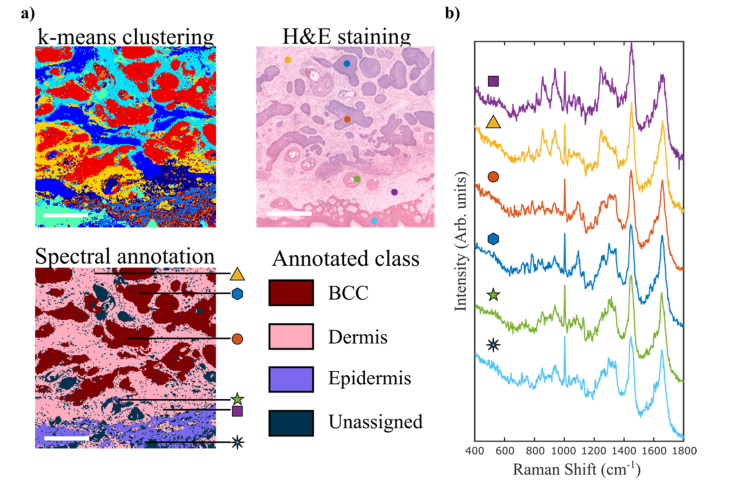
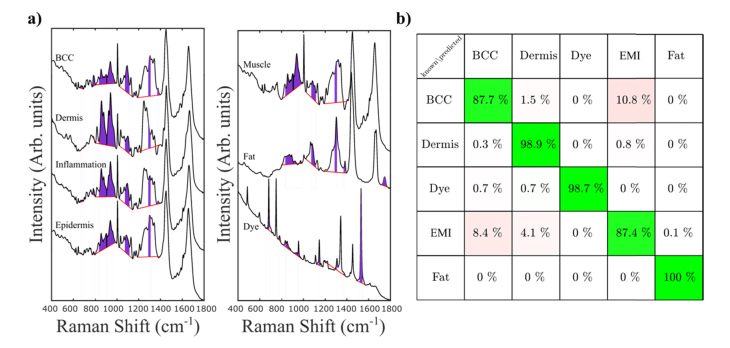
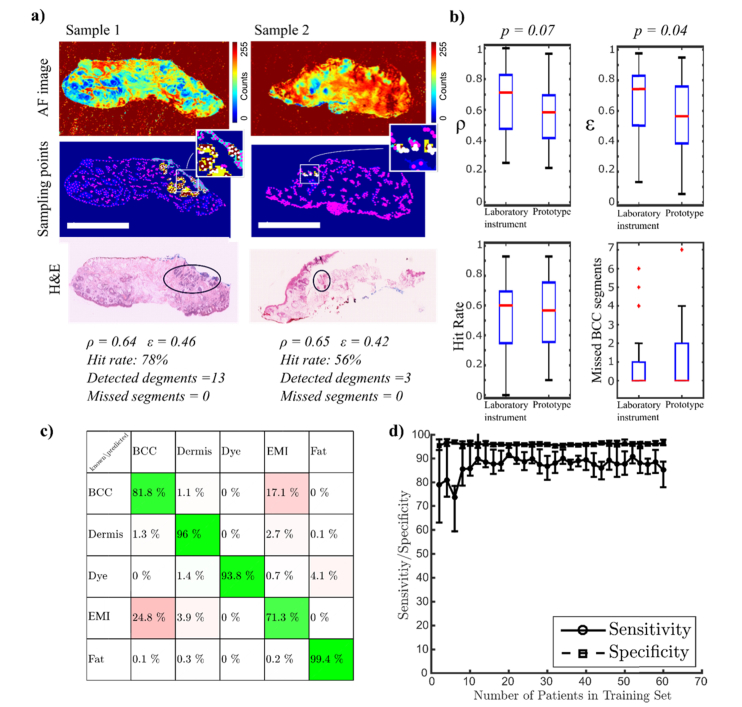
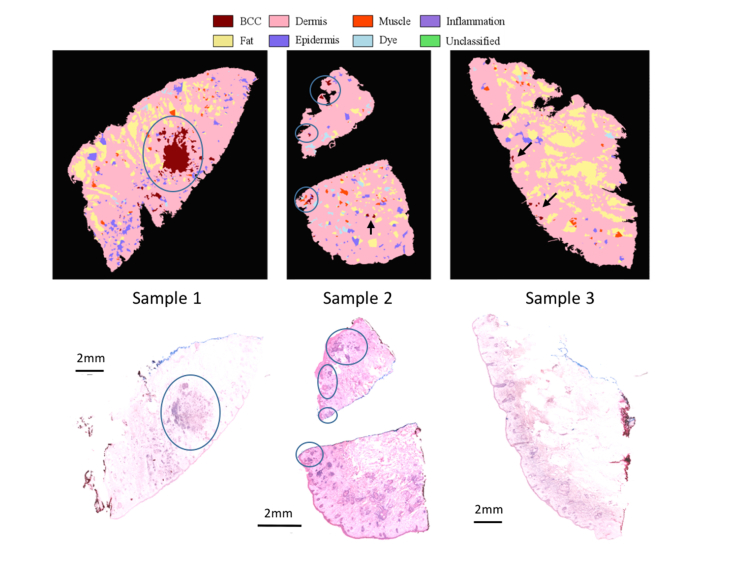
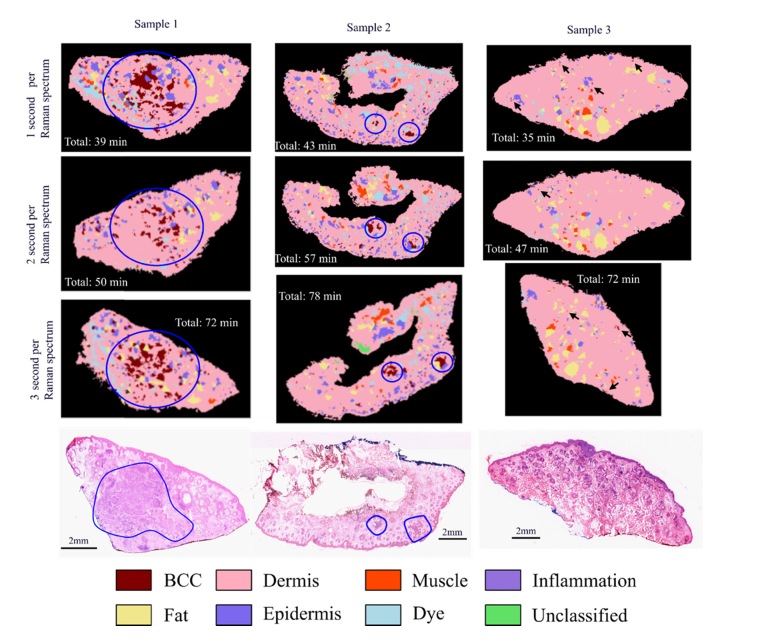
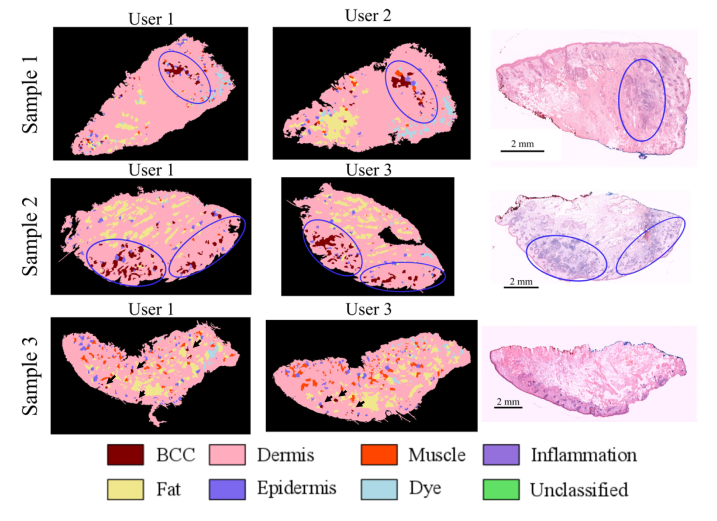
Multimodal spectral histopathology (MSH), an optical technique combining tissue auto-fluorescence (AF) imaging and Raman micro-spectroscopy (RMS), was previously proposed for detection of residual basal cell carcinoma (BCC) at the surface of surgically-resected skin tissue. Here we report the development of a fully-automated prototype instrument based on MSH designed to be used in the clinic and operated by a non-specialist spectroscopy user. The algorithms for the AF image processing and Raman spectroscopy classification had been first optimised on a manually-operated laboratory instrument and then validated on the automated prototype using skin samples from independent patients. We present results on a range of skin samples excised during Mohs micrographic surgery, and demonstrate consistent diagnosis obtained in repeat test measurement, in agreement with the reference histopathology diagnosis. We also show that the prototype instrument can be operated by clinical users (a skin surgeon and a core medical trainee, after only 1-8 hours of training) to obtain consistent results in agreement with histopathology. The development of the new automated prototype and demonstration of inter-instrument transferability of the diagnosis models are important steps on the clinical translation path: it allows the testing of the MSH technology in a relevant clinical environment in order to evaluate its performance on a sufficiently large number of patients.
Keywords: (170.0170) Medical optics and biotechnology; (170.3880) Medical and biological imaging; (300.6450) Spectroscopy, Raman.
Conflict of interest statement
IN, SV, HW: hold unlicenced patents (P), TBS, PC, GP, MvdW, ES: RiverD International (E).
Figures
Similar articles
-
Diagnostic accuracy of autofluorescence-Raman microspectroscopy for surgical margin assessment during Mohs micrographic surgery of basal cell carcinoma.Br J Dermatol. 2024 Aug 14;191(3):428-436. doi: 10.1093/bjd/ljae196. Br J Dermatol. 2024. PMID: 38736216
-
Optimization of multimodal spectral imaging for assessment of resection margins during Mohs micrographic surgery for basal cell carcinoma.Biomed Opt Express. 2014 Dec 10;6(1):98-111. doi: 10.1364/BOE.6.000098. eCollection 2015 Jan 1. Biomed Opt Express. 2014. PMID: 25657878 Free PMC article.
-
Development of Raman microspectroscopy for automated detection and imaging of basal cell carcinoma.J Biomed Opt. 2009 Sep-Oct;14(5):054031. doi: 10.1117/1.3251053. J Biomed Opt. 2009. PMID: 19895133
-
Who should have Mohs micrographic surgery?Curr Opin Otolaryngol Head Neck Surg. 2010 Aug;18(4):283-9. doi: 10.1097/MOO.0b013e32833b6f19. Curr Opin Otolaryngol Head Neck Surg. 2010. PMID: 20613530 Review.
-
Clinical multi-colour fluorescence imaging of malignant tumours--initial experience.Acta Radiol. 1998 Jan;39(1):2-9. doi: 10.1080/02841859809172141. Acta Radiol. 1998. PMID: 9498864 Review.
Cited by
-
Intra-operative spectroscopic assessment of surgical margins during breast conserving surgery.Breast Cancer Res. 2018 Jul 9;20(1):69. doi: 10.1186/s13058-018-1002-2. Breast Cancer Res. 2018. PMID: 29986750 Free PMC article.
-
Clinical integration of fast Raman spectroscopy for Mohs micrographic surgery of basal cell carcinoma.Biomed Opt Express. 2021 Mar 11;12(4):2015-2026. doi: 10.1364/BOE.417896. eCollection 2021 Apr 1. Biomed Opt Express. 2021. PMID: 33996213 Free PMC article.
-
The complementary value of intraoperative fluorescence imaging and Raman spectroscopy for cancer surgery: combining the incompatibles.Eur J Nucl Med Mol Imaging. 2022 Jun;49(7):2364-2376. doi: 10.1007/s00259-022-05705-z. Epub 2022 Feb 1. Eur J Nucl Med Mol Imaging. 2022. PMID: 35102436 Free PMC article. Review.
-
AI-assisted identification of nonmelanoma skin cancer structures based on combined line-field confocal optical coherence tomography and confocal Raman microspectroscopy.J Biomed Opt. 2025 Jul;30(7):076008. doi: 10.1117/1.JBO.30.7.076008. Epub 2025 Jul 28. J Biomed Opt. 2025. PMID: 40726594 Free PMC article.
-
Intraoperative spectroscopic evaluation of sentinel lymph nodes in breast cancer surgery.Breast Cancer Res Treat. 2024 Aug;207(1):223-232. doi: 10.1007/s10549-024-07349-z. Epub 2024 May 20. Breast Cancer Res Treat. 2024. PMID: 38769222 Free PMC article.
References
-
- Baxter J. M., Patel A. N., Varma S., “Facial basal cell carcinoma,” BMJ 345, e5342 (2012). - PubMed
-
- Wolf D. J., Zitelli J. A., “Surgical margins for basal cell carcinoma,” Arch. Dermatol. 123(3), 340–344 (1987). - PubMed
-
- Breuninger H., Dietz K., “Prediction of subclinical tumor infiltration in basal cell carcinoma,” J. Dermatol. Surg. Oncol. 17(7), 574–578 (1991). - PubMed
-
- Kimyai-Asadi A., Alam M., Goldberg L. H., Peterson S. R., Silapunt S., Jih M. H., “Efficacy of narrow-margin excision of well-demarcated primary facial basal cell carcinomas,” J. Am. Acad. Dermatol. 53(3), 464–468 (2005). - PubMed
Grants and funding
LinkOut - more resources
Full Text Sources
Other Literature Sources