

IL-21 promotes the development of a CD73-positive Vγ9Vδ2 T cell regulatory population
- PMID: 29296543
- PMCID: PMC5739578
- DOI: 10.1080/2162402X.2017.1379642
IL-21 promotes the development of a CD73-positive Vγ9Vδ2 T cell regulatory population
Abstract
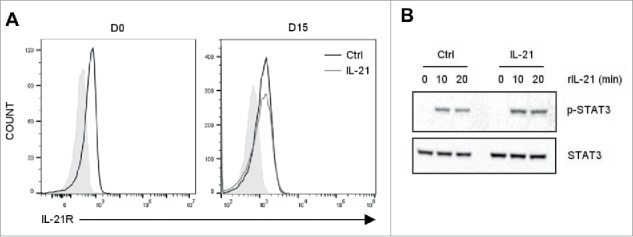
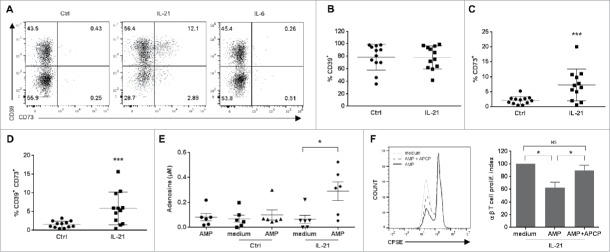
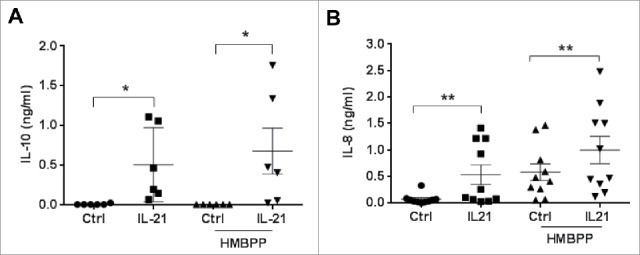
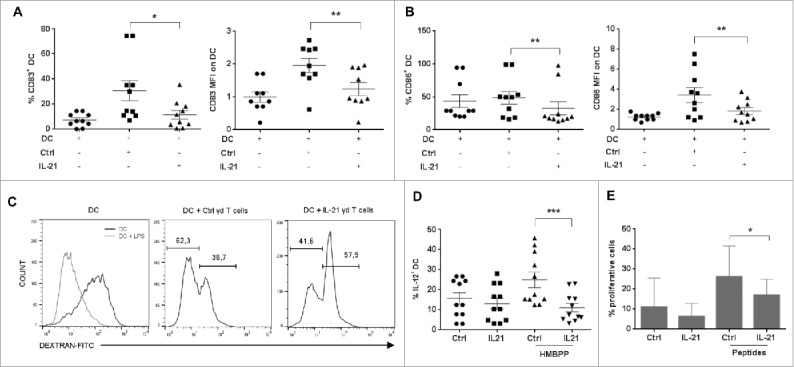
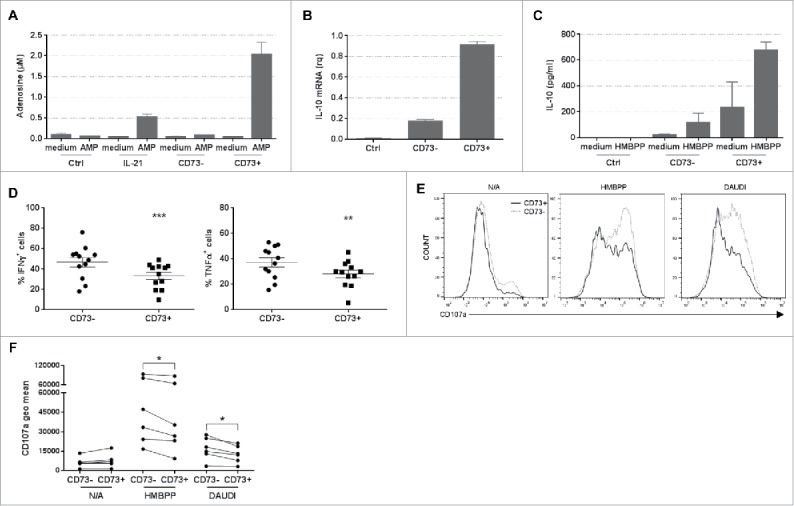
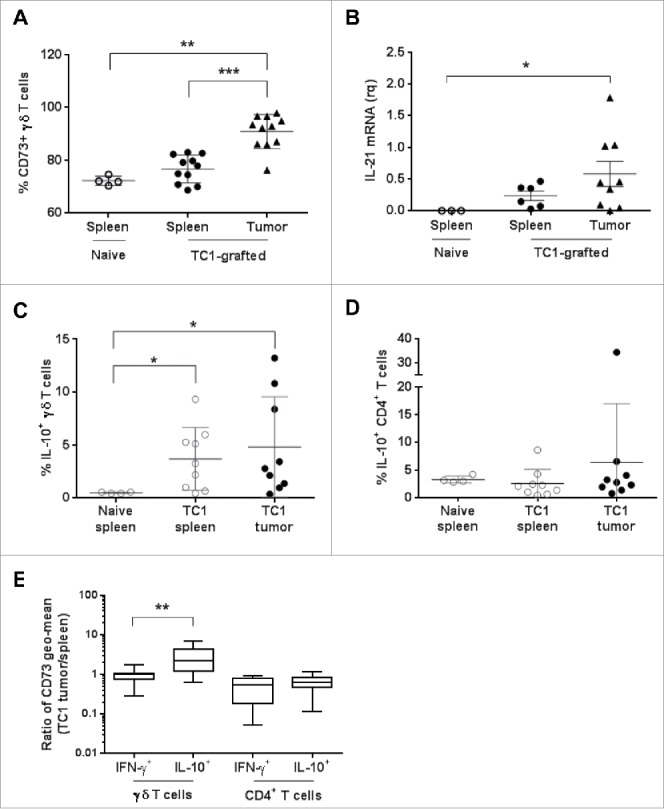
Vγ9Vδ2 T cells contribute to the immune response against many tumor types through their direct cytotoxic activity and capacity to regulate the biological functions of other immune cells, such as dendritic cells and IFN-γ-producing CD8+ T cells. However, their presence in the tumor microenvironment has also been associated with poor prognosis in breast, colon and pancreatic cancers. Additionally, recent studies demonstrated that cytokines can confer some plasticity to Vγ9Vδ2 T cells and promote their differentiation into cells with regulatory functions. Here, we demonstrated that activation of Vγ9Vδ2 T cells isolated from healthy donors and cultured in the presence of IL-21 favors the emergence of a subpopulation of Vγ9Vδ2 T cells that express the ectonucleotidase CD73 and inhibits T cell proliferation in a CD73/adenosine-dependent manner. This subpopulation produces IL-10 and IL-8 and displays lower effector functions and cytotoxic activity than CD73-negative Vγ9Vδ2 T cells. We also showed, in a syngeneic mouse tumor model, the existence of a tumor-infiltrating γδ T cell subpopulation that produces IL-10 and strongly expresses CD73. Moreover, maturation, IL-12 production and induction of antigen-specific T cell proliferation are impaired in DC co-cultured with IL-21-amplified Vγ9Vδ2 T cells. Altogether, these data indicate that IL-21 promotes Vγ9Vδ2 T cell regulatory functions by favoring the development of an immunosuppressive CD73+ subpopulation. Thus, when present in the tumor microenvironment, IL-21 might negatively impact γδ T cell anti-tumor functions.
Keywords: CD73; IL-10; IL-21; adenosine; regulatory functions; tumor microenvironment; γδ T cells.
Figures
Similar articles
-
Identification of a regulatory Vδ1 gamma delta T cell subpopulation expressing CD73 in human breast cancer.J Leukoc Biol. 2020 Jun;107(6):1057-1067. doi: 10.1002/JLB.3MA0420-278RR. Epub 2020 May 3. J Leukoc Biol. 2020. PMID: 32362028
-
IL-23R and TCR signaling drives the generation of neonatal Vgamma9Vdelta2 T cells expressing high levels of cytotoxic mediators and producing IFN-gamma and IL-17.J Leukoc Biol. 2011 May;89(5):743-52. doi: 10.1189/jlb.0910501. Epub 2011 Feb 17. J Leukoc Biol. 2011. PMID: 21330350
-
Plasticity of γδ T Cells: Impact on the Anti-Tumor Response.Front Immunol. 2014 Dec 8;5:622. doi: 10.3389/fimmu.2014.00622. eCollection 2014. Front Immunol. 2014. PMID: 25538706 Free PMC article. Review.
-
Human Vδ2(+) γδ T Cells Differentially Induce Maturation, Cytokine Production, and Alloreactive T Cell Stimulation by Dendritic Cells and B Cells.Front Immunol. 2014 Dec 19;5:650. doi: 10.3389/fimmu.2014.00650. eCollection 2014. Front Immunol. 2014. PMID: 25566261 Free PMC article.
-
The multifunctionality of human Vγ9Vδ2 γδ T cells: clonal plasticity or distinct subsets?Scand J Immunol. 2012 Sep;76(3):213-22. doi: 10.1111/j.1365-3083.2012.02727.x. Scand J Immunol. 2012. PMID: 22670577 Review.
Cited by
-
Pro-tumor γδ T Cells in Human Cancer: Polarization, Mechanisms of Action, and Implications for Therapy.Front Immunol. 2020 Sep 16;11:2186. doi: 10.3389/fimmu.2020.02186. eCollection 2020. Front Immunol. 2020. PMID: 33042132 Free PMC article. Review.
-
Baseline Cytokine Profile Identifies a Favorable Outcome in a Subgroup of Colorectal Cancer Patients Treated with Regorafenib.Vaccines (Basel). 2023 Feb 2;11(2):335. doi: 10.3390/vaccines11020335. Vaccines (Basel). 2023. PMID: 36851213 Free PMC article.
-
Gamma delta T-cell-based immune checkpoint therapy: attractive candidate for antitumor treatment.Mol Cancer. 2023 Feb 15;22(1):31. doi: 10.1186/s12943-023-01722-0. Mol Cancer. 2023. PMID: 36793048 Free PMC article. Review.
-
Diversity of Tumor-Infiltrating, γδ T-Cell Abundance in Solid Cancers.Cells. 2020 Jun 24;9(6):1537. doi: 10.3390/cells9061537. Cells. 2020. PMID: 32599843 Free PMC article.
-
Influence of Indoleamine-2,3-Dioxygenase and Its Metabolite Kynurenine on γδ T Cell Cytotoxicity against Ductal Pancreatic Adenocarcinoma Cells.Cells. 2020 May 6;9(5):1140. doi: 10.3390/cells9051140. Cells. 2020. PMID: 32384638 Free PMC article.
References
-
- Hintz M, Reichenberg A, Altincicek B, Bahr U, Gschwind RM, Kollas AK, Beck E, Wiesner J, Eberl M, Jomaa H. Identification of (E)-4-hydroxy-3-methyl-but-2-enyl pyrophosphate as a major activator for human gammadelta T cells in Escherichia coli. FEBS Letters. 2001;509:317-22. doi:10.1016/S0014-5793(01)03191-X. PMID:11741609 - DOI - PubMed
-
- Altincicek B, Moll J, Campos N, Foerster G, Beck E, Hoeffler JF, Grosdemange-Billiard C, Rodríguez-Concepción M, Rohmer M, Boronat A, et al.. Cutting edge: human gamma delta T cells are activated by intermediates of the 2-C-methyl-D-erythritol 4-phosphate pathway of isoprenoid biosynthesis. J Immunol. 2001;166:3655-8. doi:10.4049/jimmunol.166.6.3655. PMID:11238603 - DOI - PubMed
Publication types
LinkOut - more resources
Full Text Sources
Other Literature Sources
Research Materials