. 2017 Mar 30;1(10):577-589.
doi: 10.1182/bloodadvances.2016002352. eCollection 2017 Apr 11.

IL-33, IL-25, and TSLP induce a distinct phenotypic and activation profile in human type 2 innate lymphoid cells

Affiliations

IL-33, IL-25, and TSLP induce a distinct phenotypic and activation profile in human type 2 innate lymphoid cells

Ana Camelo et al. Blood Adv. .

Abstract

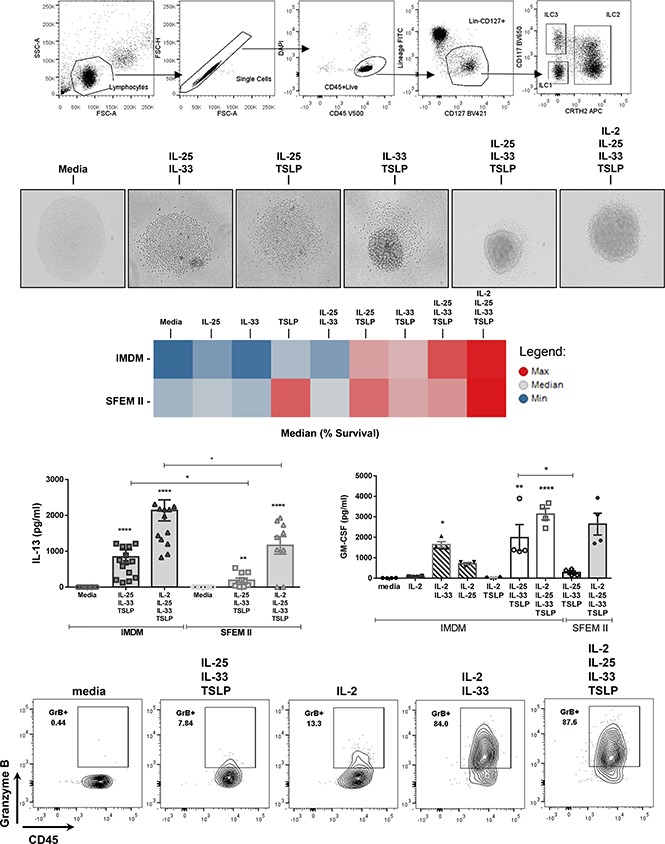
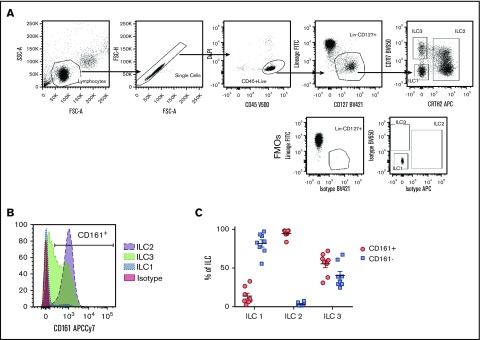
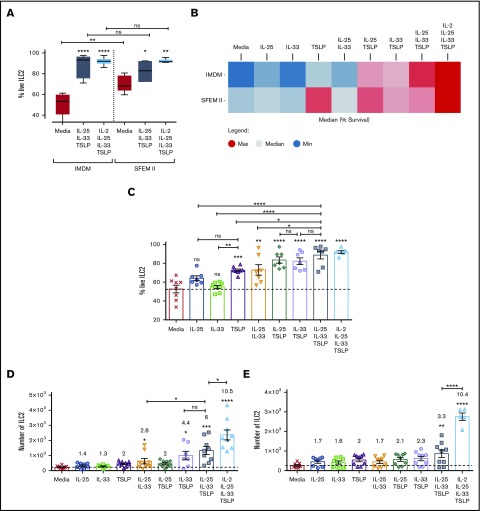
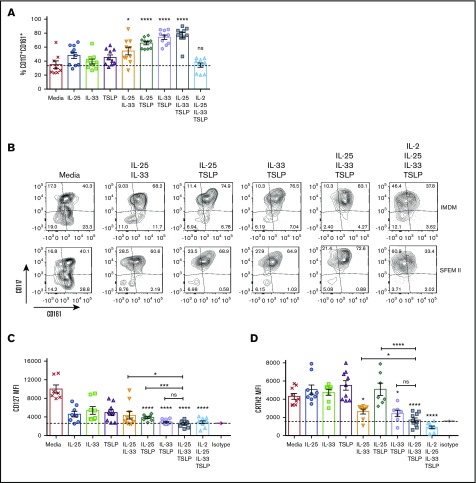
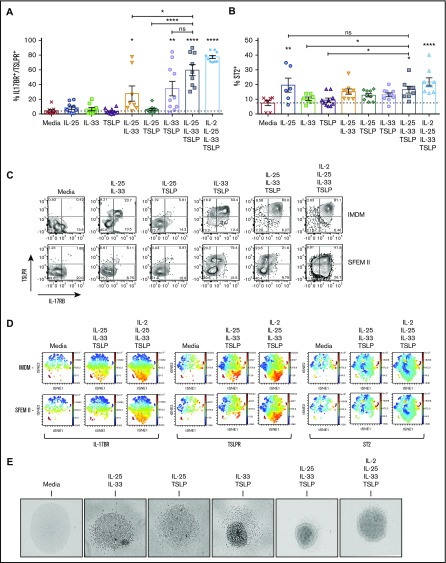
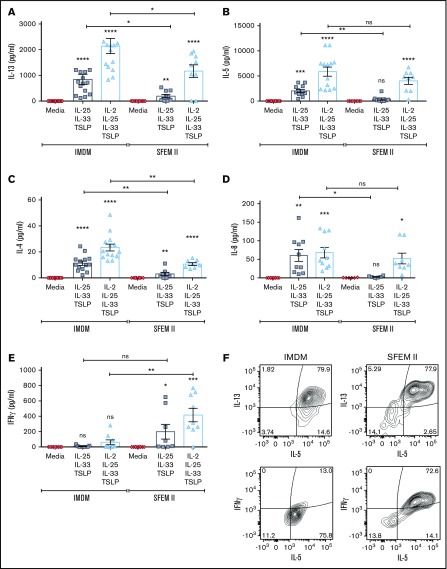
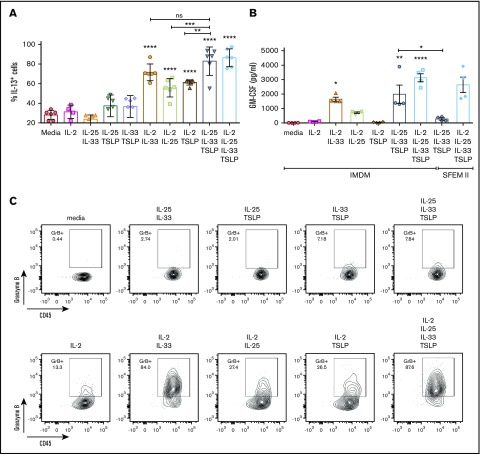
Innate lymphoid cells (ILCs) represent a distinct branch of the lymphoid lineage composed of 3 major subpopulations: ILC1, ILC2, and ILC3. ILCs are mainly described as tissue-resident cells but can be detected at low levels in human blood. However, unlike mouse ILCs, there is still no consistent methodology to purify and culture these cells that enables in-depth analysis of their intrinsic biology. Here, we describe defined culture conditions for ILC2s, which allowed us to dissect the roles of interleukin 2 (IL-2), IL-25, IL-33, and thymic stromal lymphopoietin (TSLP) individually, or in combination, in modulating ILC2 phenotype and function. We show that TSLP is important for ILC2 survival, while ILC2 activation is more dependent on IL-33, especially when in combination with IL-2 or TSLP. We found that activation of ILC2s by IL-33 and TSLP dramatically upregulated their surface expression of c-Kit and downregulated expression of the canonical markers IL-7Rα and CRTH2. IL-2 further amplified ILC2 production of IL-5, IL-13, and granulocyte-macrophage colony-stimulating factor but also induced a more natural killer (NK)-like phenotype in ILC2, with upregulation of granzyme B production by these cells. Furthermore, ILC2 plasticity was observed in serum-free SFEM II media in response to IL-33, IL-25, and TSLP stimulation and independently of IL-12 and IL-1β. This is the first comprehensive report of an in vitro culture system for human ILC2s, without the use of feeder layers, which additionally evaluates the impact of IL-25, IL-33, and TSLP alone or in combination on ILC2 surface phenotype and activation status.


Conflict of interest statement

Conflict-of-interest disclosure: The authors declare no competing financial interests.

Figures

None
Graphical abstract
Figure 1.
Figure 1.
Phenotype of leukocyte cone–derived ILC populations (A) Gating strategy used to purify ILC1s, ILC2s, and ILC3s from peripheral blood, in comparison with fluorescence minus one control controls, following pre-enrichment with NK combo protocol. Dot plots are representative of >10 independent experiments (n = 2 donors/experiment). (B) Differential expression of CD161 across the 3 ILC populations as depicted by a representative histogram. (C) Graph representative of the percentages of CD161+ and CD161 populations for each of the ILC types. Data are shown as mean of the population; each dot represents 1 donor. FITC, fluorescein isothiocyanate; FMO, fluorescence minus one; FSC, forward scatter; SSC, side scatter.
Figure 2.
Figure 2.
Survival and proliferation of ILC2s. Purified ILC2s were stimulated with different cytokine cocktails for 5 days, and their survival and proliferation were evaluated by flow cytometry. (A) Percentage of survival, as defined by exclusion of the DAPI dye was compared in cells cultured in either IMDM or SFEM II media. (B) Heat map representing the average ILC2 survival between the 2 baseline media in all stimulation cocktails, where red represent highest expression and blue lowest expression. (C) Bar graph representing each individual replicate. (D-E) ILC2 cell number, following activation with EC alone, in double or triple combination in IMDM (D) or SFEM II media (E). Numbers above each treatment group represent fold change of proliferation above media control. Data are shown as mean ± standard error of the mean (SEM) from 3 independent experiments, with n = 2/3 donors each. Significance was calculated using 1-way ANOVA followed by correction for multiple comparisons, where *P < .05, **P < .01, ***P < .001, and ****P < .0001. Statistics above bars represent comparison with media baseline; comparison between samples is represented by the connecting line. ns, not significant.
Figure 3.
Figure 3.
ECs differentially modulate the expression of ILC2 canonical markers. ILC2s were stimulated in vitro with ECs or EC combinations, and surface expression of CD127, CRTH2, CD161, and CD117 was evaluated by flow cytometry. (A) Percentage of CD117+CD161+ in IMDM. (B) Contour plots showing the expression pattern of CD161 (x-axis) and CD117 (y-axis) after stimulation with double or triple cytokine combinations. (C-D) Mean fluorescence intensity (MFI) was also calculated for CD127 (C) and CRTH2 (D) in IMDM. Data are shown as mean ± SEM from 2 independent experiments, with n = 2 or 3 donors each. Significance was calculated using 1-way ANOVA followed by correction for multiple comparisons, where *P < .05, **P < .01, ***P < .001, and ****P < .0001. Statistics above bars represent comparison with media baseline; comparison between samples is represented by the connecting line. ns, not significant.
Figure 4.
Figure 4.
Surface expression of TSLPR, IL-17BR, and ST2 reveals different ILC2 subpopulations. ILC2s were stimulated with ECs or EC combinations, and surface expression of EC receptors was evaluated by flow cytometry. (A) Percentage of IMDM-cultured ILC2s that show double-positive expression for IL-17BR and TSLPR. (B) Percentage of IMDM-cultured ST2+ ILC2s. (C) Contour plots showing the percentage of cells in each gate for IL-17BR (x-axis) and TSLPR (y-axis), comparing IMDM and SFEM II. (D) viSNE plots, as analyzed in Cytobank, showing the population clustering for each receptor. Red indicates the highest expression and blue the lowest expression. (E) Photographs depicting ILC2s when stimulated with double or triple cytokine combinations, or the latter combination with the addition of IL-2 (phase contrast microscopy, original magnification ×100). Data are shown as mean ± SEM from 2 independent experiments, with n = 2 or 3 donors each. Significance was calculated using 1-way ANOVA followed by correction for multiple comparisons, where *P < .05, **P < .01, ***P < .001, and ****P < .0001. Statistics above the bars represent comparison with media baseline; comparison between samples is represented by the connecting line. ns, not significant.
Figure 5.
Figure 5.
ILC2 cytokine secretion pattern following stimulation with different combinations of ECs in IMDM or SFEM II culture media. ILC2s were stimulated with the triple EC combination or with all 3 ECs plus IL-2, and effector cytokine production was quantified in the supernatants after 5 days in culture with either IMDM or SFEM II. (A-E) Multiplexed ELISA was performed to measure IL-13 (A), IL-5 (B), IL-4 (C), IL-8 (D), and IFN-γ (E). Data are shown as mean ± SEM from 2 independent experiments, with n = 2 or 3 donors each. Significance was calculated using 1-way ANOVA followed by correction for multiple comparisons, where *P < .05, **P < .01, ***P < .001, and ****P < .0001. Statistics above bars represent comparison with media baseline; comparison between samples is represented by the connecting line. (F) Representative contour plots showing intracellular expression of IL-13, IL-5, and IFN-γ in ILC2s cultured in either IMDM or SFEM II following 4-hour incubation with brefeldin A. Data are representative of 2 independent experiments (n = 2 donors). ns, not significant.
Figure 6.
Figure 6.
IL-2 amplifies the response of ILC2s to ECs. ILC2s were cultured for 5 days in the presence of EC ± IL-2. (A) Percentage of ILC2s expressing intracellular IL-13 following activation with EC ± IL-2 for 5 days and 4-hour incubation with brefeldin A prior to cell staining. Data depict 3 independent experiments (n = 2 donors/experiment). (B) GM-CSF production was also analyzed in the cells supernatants following a 5-day in vitro culture. Data depict 2 independent experiments (n = 2 donors). Data are shown as mean ± SEM from 2 independent experiments, with n = 2 donors each. Significance was calculated using 1-way ANOVA followed by correction for multiple comparisons, where *P < .05, **P < .01, ***P < .001, and ****P < .0001. Statistics above bars represent comparison with media baseline; comparison between samples is represented by the connecting line. (C) Representative contour plots of granzyme B expression by ILC2s cultured with EC ± IL-2 for 5 days and incubation with brefeldin A for 4 hours prior to intracellular cell staining. ns, not significant.

References

    1. Neill DR, Wong SH, Bellosi A, et al. Nuocytes represent a new innate effector leukocyte that mediates type-2 immunity. Nature. 2010;464(7293):1367-1370. - PMC - PubMed
    1. Wong SH, Walker JA, Jolin HE, et al. Transcription factor RORα is critical for nuocyte development. Nat Immunol. 2012;13(3):229-236. - PMC - PubMed
    1. Klose CS, Artis D. Innate lymphoid cells as regulators of immunity, inflammation and tissue homeostasis. Nat Immunol. 2016;17(7):765-774. - PubMed
    1. Barlow JL, Peel S, Fox J, et al. IL-33 is more potent than IL-25 in provoking IL-13-producing nuocytes (type 2 innate lymphoid cells) and airway contraction. J Allergy Clin Immunol. 2013;132(4):933-941. - PubMed
    1. Bergot AS, Monnet N, Le Tran S, et al. HPV16 E7 expression in skin induces TSLP secretion, type 2 ILC infiltration and atopic dermatitis-like lesions. Immunol Cell Biol. 2015;93(6):540-547. - PMC - PubMed