. 2017 Apr 6;1(10):601-614.
doi: 10.1182/bloodadvances.2017004358. eCollection 2017 Apr 11.

A functional DC cross talk promotes human ILC homeostasis in humanized mice

Affiliations

A functional DC cross talk promotes human ILC homeostasis in humanized mice

Silvia Lopez-Lastra et al. Blood Adv. .

Abstract

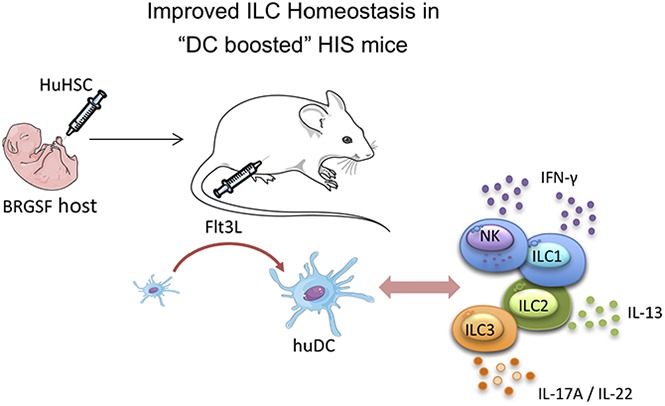
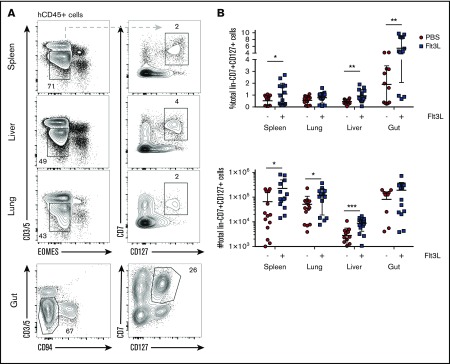
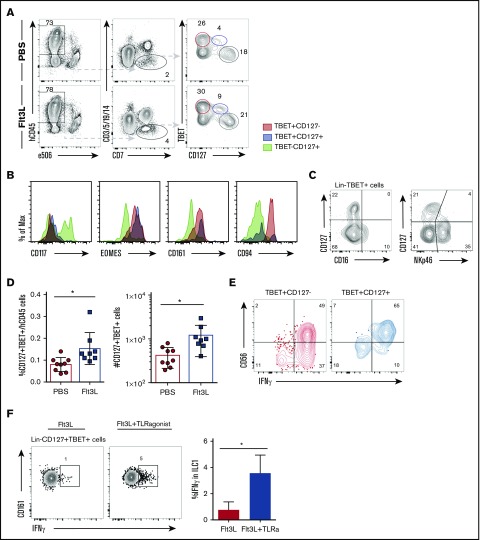
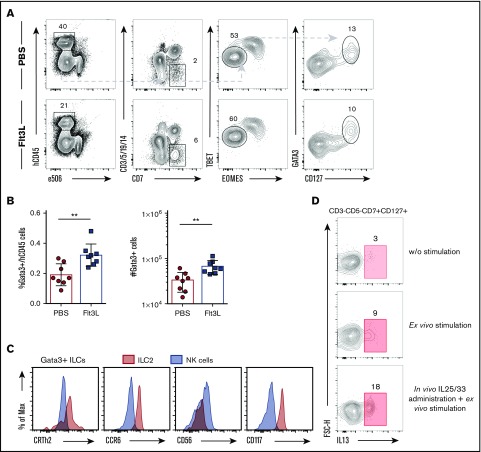
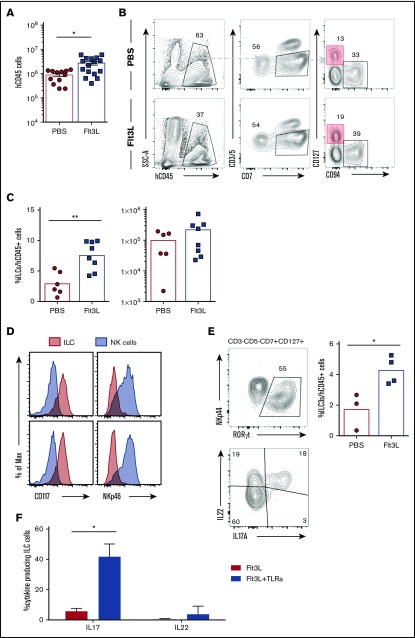
Humanized mice harboring human hematopoietic systems offer a valuable small-animal model to assess human immune responses to infection, inflammation, and cancer. Human immune system (HIS) mice develop a broad repertoire of antigen receptor bearing B and T cells that can participate in adaptive immune responses after immunization. In contrast, analysis of innate immune components, including innate lymphoid cells (ILCs) and natural killer (NK) cells, is limited in current HIS mouse models, partly because of the poor development of these rare lymphoid subsets. Here we show that novel dendritic cell (DC)-boosted BALB/c Rag2-/-Il2rg-/-SirpaNODFlk2-/- (BRGSF) HIS mice harbor abundant NK cells and tissue-resident ILC subsets in lymphoid and nonlymphoid mucosal sites. We find that human NK cells and ILCs are phenotypically and functionally mature and provide evidence that human DC activation in BRGSF-based HIS mice can "cross talk" to human NK cells and ILCs. This novel HIS mouse model should provide the opportunity to study the immunobiology of human NK cell and ILC subsets in vivo in response to various environmental challenges.


Conflict of interest statement

Conflict-of-interest disclosure: J.P.D. is a stakeholder in AXENIS (founder, member of the executive board). The remaining authors declare no conflict of interest.

Figures

None
Graphical abstract
Figure 1.
Figure 1.
Distribution of human myeloid subsets in BRGSF mice and effect of Flt3L on their development. Representative flow cytometry immunophenotypic analysis of hCD45+HLADR+CD19CD3CD56 cells from bone marrow (A) and spleen (C) of an Flt3L-treated mouse and a PBS-treated littermate engrafted with the same CD34+ HSC donor. Comparison of frequencies within the human CD45+ cells and total number of the 4 myeloid subsets (CD14+ monocytes, CD123+ pDCs, CD141+ cDCs, and CD1c+ cDCs) with or without Flt3L treatment in bone marrow (B) and spleen (D). Each dot represents 1 mouse. Composite data from 3 independent experiments are shown. Numbers in plots represent frequencies within gates.
Figure 2.
Figure 2.
Distribution of human NK cells in reconstituted BRGSF mice with or without Flt3L treatment. (A) Representative flow cytometry immunophenotypic analysis of alive hCD45+CD3CD94+NKp46+ NK cells from liver, spleen, and lung of an Flt3L-treated mouse and a PBS-treated littermate engrafted with the same CD34+ HSC donor. (B) Comparison of CD94+ cell frequencies within the human CD45+ cells (top) and total number of NK cells (bottom) with or without Flt3L treatment in liver, spleen, and lung. (C) Representative flow cytometry plot of CD56 and CD16 expression in liver NKp46+CD94+ cells as gated in top panels (left) and comparative quantification (right). (D) Expression of NKG2A and NKG2C in liver NKp46+CD94+ cells (left) and comparative quantification (right). (E) Distribution of activating (CD158i) and inhibitory (CD158a/b) KIR expression in liver, spleen, and lung NK cells of a representative BRGSF mouse treated with Flt3L (left) and comparative quantification of the total KIR-expressing CD94+ NK cells with or without Flt3L treatment (right). Each dot represents 1 mouse. Composite data from at least 3 independent experiments are shown. Numbers in plots represent frequencies within gates.
Figure 3.
Figure 3.
Flt3L treatment enhances human NK cell function in spleen cells from reconstituted BRGSF mice. (A) Human NK cells were magnetic-activated cell sorting–enriched from spleens of BRGSF Flt3L treated or not and were stimulated ex vivo with the monokines IL-12, IL-15, and IL-18. Representative flow cytometry immunophenotypic analysis of degranulation (CD107a) and cytokine production (IFN-γ) in NKp46+ NK cells is shown. (B) Quantification of IFN-γ–producing and CD107a-expressing NK cells from Flt3L-treated or control BRGSF mice. (C) In vivo functionality of NK cells in BRGSF mice was evaluated by quantifying IFN-γ production and degranulation after in vivo poly(I:C) stimulation. (B,C) Composite data of 4 mice per condition in 2 experiments. Each dot represents 1 mouse. Numbers in plots represent frequencies within gates.
Figure 4.
Figure 4.
Distribution of human ILCs in BRGSF mice and effect of Flt3L treatment. (A) Representative flow cytometry analysis of CD3CD5EOMESCD7+CD127+ innate lymphoid cells in spleen, liver, and lung and CD3CD5CD94CD7+CD127+ cells in gut of an Flt3L-treated BRGSF mouse. (B) Comparative quantification of ILCs in spleen, lung, liver, and gut of BRGSF mice treated or not with Flt3L as a percentage of hCD45+ cells (top) and total number of cells (bottom). Composite data from of 14 mice per condition in 4 experiments are shown. Each dot represents 1 mouse. Numbers in plots represent frequencies within gates.
Figure 5.
Figure 5.
Flt3L treatment expands a population of ILC type 1 cells differently from NK cells. (A) Representative flow cytometry analysis of TBET and CD127 expression on LinCD7+ cells in liver of a PBS- and a littermate Flt3L-treated BRGSF mouse. (B) Expression of CD117, EOMES, CD161, and CD94 (histograms) on liver TBET+CD127 (red), TBET+CD127+ (blue), and TBETCD127+ cells (gray) assessed by flow cytometry. (C) Expression of CD127, CD16, and NKp46 on liver LinTBET+ cells, assessed by flow cytometry. (D) Frequency among hCD45+ cells (left) and total number (right) of LinCD7+CD127+TBET+ liver cells. (E) Representative functional analysis by IFN-γ intracellular flow cytometry after phorbol 12-myristate 13-acetate/ionomycin plus cytokine 4-hour stimulation of TBET+CD127 (red) and TBET+CD127+ (blue) cells. Gated cells were determined using unstimulated controls. (F) Flow cytometry representation of IFN-γ production by LinCD127+TBET+CD161+ ILC1 cells in response to TLR-mediated in vivo stimulation. Composite data from of 3 to 4 mice per condition are shown at left. Numbers in plots represent frequencies within gates.
Figure 6.
Figure 6.
Flt3L treatment also augments ILC type 2 cells in reconstituted BRGSF mice. (A) Representative flow cytometry analysis of GATA-3+ ILCs in lung of reconstituted BRGSF mice treated or not with Flt3L. (B) Frequency among hCD45+ cells and total number of GATA-3+ ILCs in lung of reconstituted BRGSF mice treated or not with Flt3L. Composite data from 8 mice of 2 experiments is shown. (C) Representative functional analysis by IL-13 intracellular flow cytometry from freshly isolated lung ILCs, after P/I ex vivo stimulation, and after in vivo hydrodynamic cytokine injection and ex vivo stimulation. (D) Expression of CRTh2, CCR6, CD56, and CD117 (histograms) on lung GATA-3 ILCs (red) and EOMES+TBET+ NK cells (gray) assessed by flow cytometry. Each dot represents 1 mouse. Numbers in plots represent frequencies within gates. Max, maximum; w/o, without.
Figure 7.
Figure 7.
ILC3 can be found in the gut of BRGSF-reconstituted mice and their frequency increase after Flt3L treatment. (A) Total human CD45 cell number in gut of BRGSF mice treated or not with Flt3L. Composite data from of 12 to 16 mice per group. (B) Representative flow cytometry analysis of ILCs (CD3CD5CD94CD7+CD127+) in gut of reconstituted BRGSF mice treated or not with Flt3L. (C) Frequency among hCD45+ cells and total number of ILCs in total gut of reconstituted BRGSF treated or not with Flt3L. Composite data from 6/8 mice of 2 experiments is shown. Each dot represents 1 mouse. (D) ILC (CD3CD5CD94CD7+CD127+) (red) expression of CD117 and NKp46 as compared with NK cells (gray). (E) Intracellular expression of RORγt in gut ILCs of a representative Flt3L-treated mouse and the corresponding quantification (top) and representative functional analysis by IL-22 and IL-17 intracellular flow cytometry from ex vivo–stimulated ILCs. (F) Quantification of IL-22 and IL-17 production analyzed by flow cytometry from CD3CD5CD94CD7+CD127+ ILC3 cells in response to TLR-mediated in vivo stimulation. Composite data from of 3 to 4 mice per condition are shown. Numbers in plots represent frequencies within gates.

References

    1. Akkina R. New generation humanized mice for virus research: comparative aspects and future prospects. Virology. 2013;435(1):14-28. - PMC - PubMed
    1. Rongvaux A, Takizawa H, Strowig T, et al. Human hemato-lymphoid system mice: current use and future potential for medicine. Annu Rev Immunol. 2013;31:635-674. - PMC - PubMed
    1. Theocharides APA, Rongvaux A, Fritsch K, Flavell RA, Manz MG. Humanized hemato-lymphoid system mice. Haematologica. 2016;101(1):5-19. - PMC - PubMed
    1. Serafini N, Vosshenrich CAJ, Di Santo JP. Transcriptional regulation of innate lymphoid cell fate. Nat Rev Immunol. 2015;15(7):415-428. - PubMed
    1. Spits H, Artis D, Colonna M, et al. Innate lymphoid cells—a proposal for uniform nomenclature. Nat Rev Immunol. 2013;13(2):145-149. - PubMed