. 2017 May 2;1(12):715-727.
doi: 10.1182/bloodadvances.2016003632. eCollection 2017 May 9.

Clonal evolution underlying leukemia progression and Richter transformation in patients with ibrutinib-relapsed CLL

Affiliations

Clonal evolution underlying leukemia progression and Richter transformation in patients with ibrutinib-relapsed CLL

Sabah Kadri et al. Blood Adv. .

Abstract

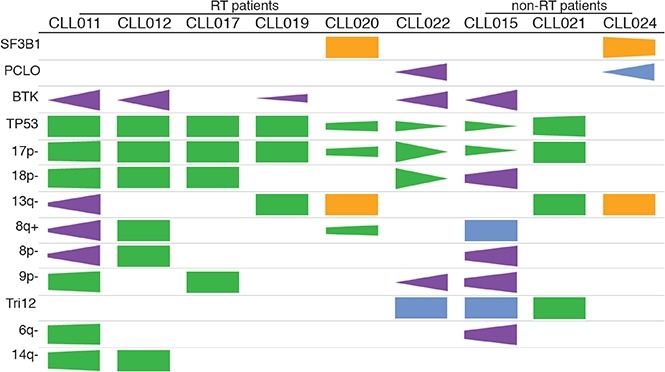
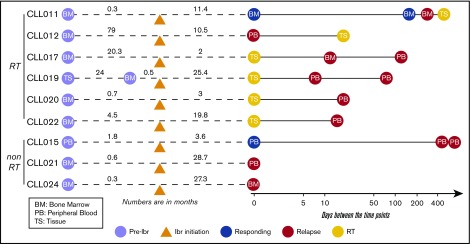
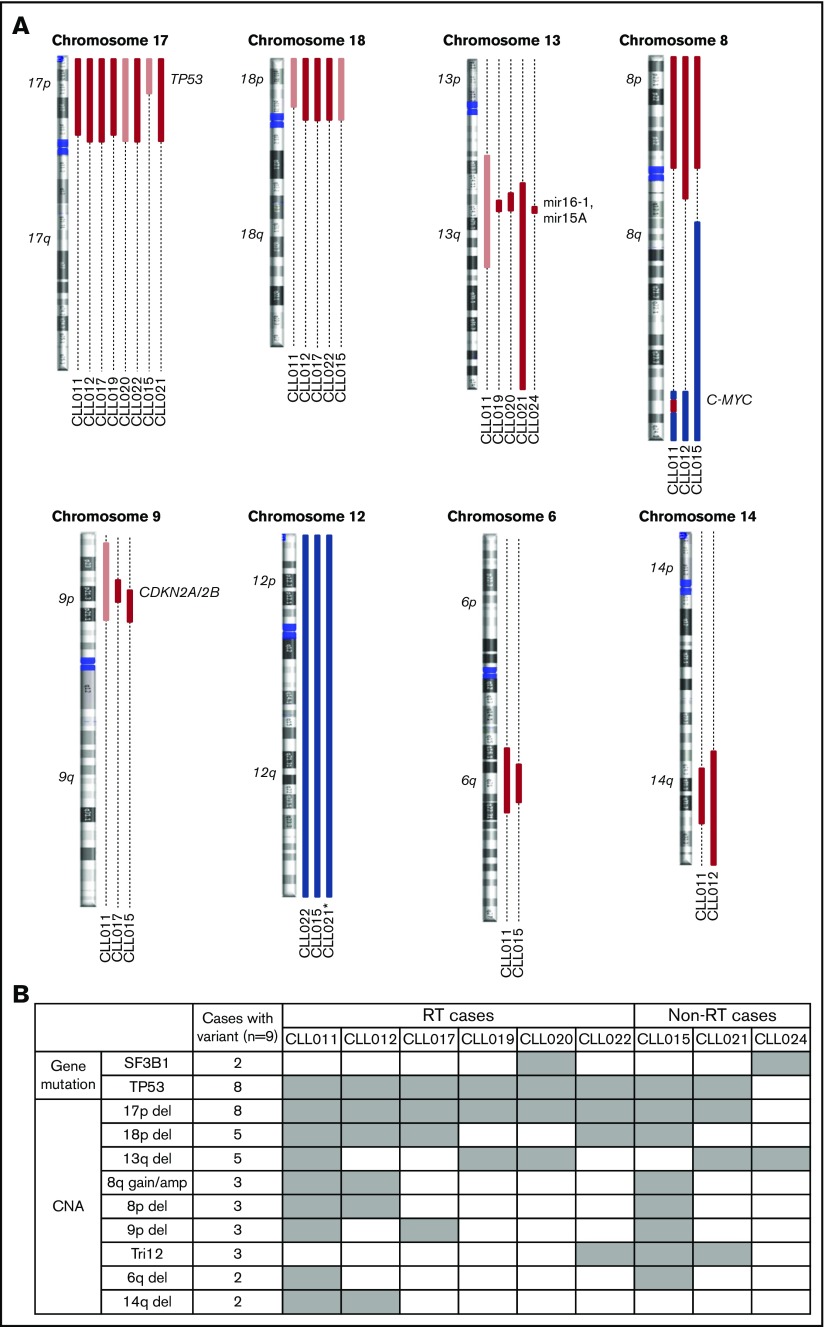
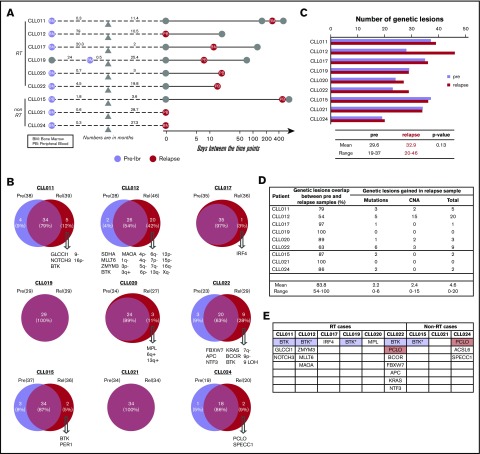
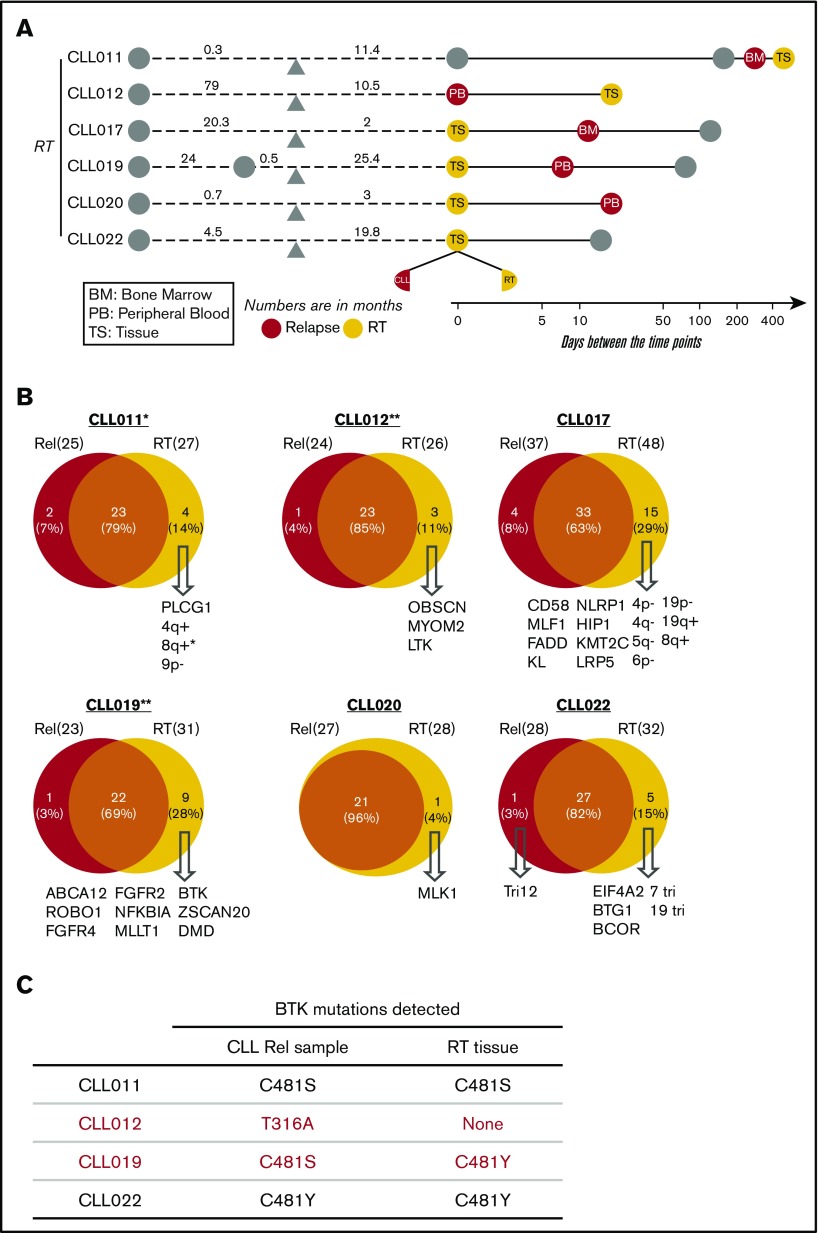
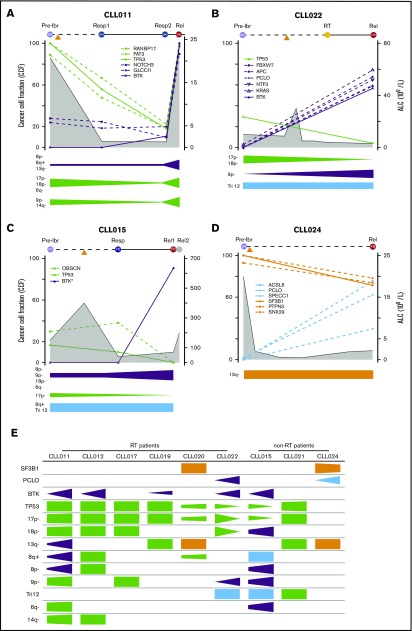
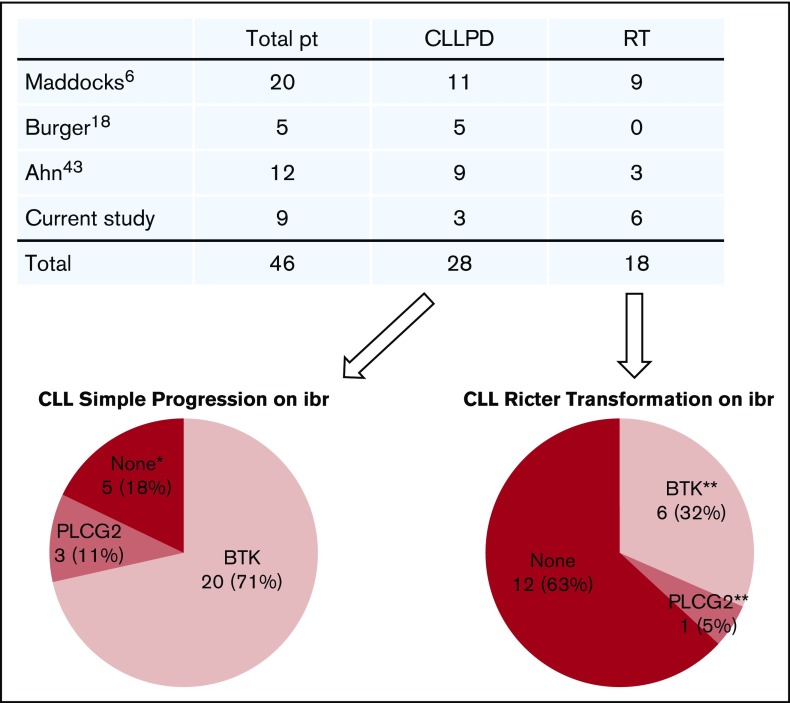
Ibrutinib has generated remarkable responses in patients with chronic lymphocytic leukemia (CLL), including those with an unfavorable cytogenetic profile. However, patients develop resistance, with poor outcomes and no established treatment options. Mutations in BTK and PLCG2 have emerged as main mechanisms of drug resistance, but not all patients carry these mutations. Further understanding of mechanisms of resistance is urgently needed and will support rational development of new therapeutic strategies. To that end, we characterized the genomic profiles of serial samples from 9 patients with ibrutinib-relapsed disease, including 6 who had Richter transformation. Mutations, indels, copy-number aberrations, and loss of heterozygosity were assessed using next-generation sequencing and single-nucleotide polymorphism array. We found that 18p deletion (del(18p)), together with del(17p)/TP53 mutations, was present in 5 of 9 patients before ibrutinib therapy. In addition to BTKC481 , we identified BTKT316A , a structurally novel mutation located in the SH2 domain of BTK. Minor BTK clones with low allele frequencies were captured in addition to major BTK clones. Although TP53 loss predisposes patients for relapse, clone size of TP53 loss may diminish during disease progression while mutant BTK clone expands. In patients who had Richter transformation, we found that the transformed cells were clonal descendants of circulating leukemia cells but continued to undergo evolution and drifts. Surprisingly, transformed lymphoma cells in tissue may acquire a different BTK mutation from that in the CLL leukemia cells. Collectively, these results provide insights into clonal evolution underlying ibrutinib relapse and prompt further investigation on genomic abnormalities that have clinical application potential.


Conflict of interest statement

Conflict-of-interest disclosure: The authors declare no competing financial interests.

Figures

None
Graphical abstract
Figure 1.
Figure 1.
Partially scaled schematic diagram. The line diagrams summarize sample collection for each of the 9 patients (6 with RT and 3 without RT), with reference to ibrutinib (ibr) initiation (orange triangle). The samples to the left of ibr initiation represent the preibrutinib (pre-ibr) time points. The solid line to the right is log scaled. Types of sample are noted. Supplemental Table 2 provides more details about the samples.
Figure 2.
Figure 2.
Recurrent abnormalities detected in patients before ibrutinib initiation. (A) Recurring CNAs. Short and long arms of chromosomes are labeled, and centromeres are highlighted. Red bars represent single-copy loss, light red bars represent mosaic loss (SmoothSignal log2 ≥ 1.5), dark red bars represent homozygous loss, and blue bars represent gains. (B) Heatmap summarizing recurrent abnormalities in all 9 patients. Gray box indicates positive finding. *CLL021 shows complex structural abnormalities of chromosome 12 with concomitant whole-chromosome gain. Amp, amplification.
Figure 3.
Figure 3.
Recurrent abnormalities at relapse vs pretreatment. (A) Schematic representation of the paired samples used for this analysis: lavender for preibrutinib (pre-ibr) and red for relapse sample. (B) Venn diagrams comparing the genetic lesions in the paired pre-ibr and relapse (Rel) samples of each patient. (C) Bar graph summarizing the total number of genetic lesions identified in the pre-ibr and relapse samples. (D) Table summarizing the number of genetic lesions gained in the relapse samples. The line separates patients with RT from those without RT. (E) List of relapse-specific genes for each patient. Colored boxes indicate recurrent genes. *BTK found at low allele frequency (Table 2 also lists emerging minor clones). LOH, loss of heterozygosity.
Figure 4.
Figure 4.
Clonal evolution in CLL-RT transition. (A) Schematic representation of the paired samples used for this analysis: orange for RT and red for liquid sample. (B) Venn diagrams comparing the genetic lesions in the paired RT and relapse samples of each patient. Numbers indicates counts of mutations. (C) Comparison of BTK mutations present in CLL vs RT tissue. *CLL011 showed gains of MYC in liquid relapse sample (Rel), but the copy number was further increased in the RT tissue. **No CNA data were available from the RT samples of patients CLL012 and CLL019. Tri, trisomy.
Figure 5.
Figure 5.
Evolutionary dynamics of the major clones during ibrutinib (ibr) relapse. Clonal trends in selected patients with CLL (supplemental Figure 2 provides details for additional patients). (A-D) Detailed trends for 2 patients with RT (A-B) and 2 without RT (C-D). Samples being analyzed are shown at the top of the plots. Time on the x-axis is partially scaled, consistent with Figure 1. Clonal frequencies are shown on the left y-axis, and absolute lymphocyte count (ALC) values are shown on the right y-axis (gray shaded curves). Mutations that clustered in the same trends are shown in the same colors (green, TP53 clusters; purple, BTK clusters; orange, SF3B1 clusters; and Blue, other clusters). The clonal trends of the copy-number changes are shown below each plot using the same color scheme. (E) Semiquantitative heatmap summarizing clonal trends for all 9 patients; x-axis for each box shows lapse of time. *Minor clones present but not depicted. Rel, relapse; Resp, response.
Figure 6.
Figure 6.
Summary of gene mutations in patients (pt) with ibrutinib (ibr)-relapsed disease. Four studies published to date were summarized. Number of patients in each category is indicated. *Neither BTK nor PLCG2 mutation. **One patient with RT had both BTK and PLCG2 mutations. PD, progressive disease.

Comment in

References

    1. Byrd JC, Furman RR, Coutre SE, et al. . Targeting BTK with ibrutinib in relapsed chronic lymphocytic leukemia. N Engl J Med. 2013;369(1):32-42. - PMC - PubMed
    1. Advani RH, Buggy JJ, Sharman JP, et al. . Bruton tyrosine kinase inhibitor ibrutinib (PCI-32765) has significant activity in patients with relapsed/refractory B-cell malignancies. J Clin Oncol. 2013;31(1):88-94. - PMC - PubMed
    1. Wang ML, Rule S, Martin P, et al. . Targeting BTK with ibrutinib in relapsed or refractory mantle-cell lymphoma. N Engl J Med. 2013;369(6):507-516. - PMC - PubMed
    1. Treon SP, Tripsas CK, Yang G, et al. . A prospective multicenter study of the Bruton’s tyrosine kinase inhibitor ibrutinib in patients with relapsed or refractory Waldenstrom’s macroglobulinemia. Blood. 2013;122(21):251.
    1. Burger JA, Keating MJ, Wierda WG, et al. . Safety and activity of ibrutinib plus rituximab for patients with high-risk chronic lymphocytic leukaemia: a single-arm, phase 2 study. Lancet Oncol. 2014;15(10):1090-1099. - PMC - PubMed