. 2017 May 8;1(12):753-765.
doi: 10.1182/bloodadvances.2017004382. eCollection 2017 May 9.

PD-1 blockade enhances elotuzumab efficacy in mouse tumor models

Affiliations

PD-1 blockade enhances elotuzumab efficacy in mouse tumor models

Natalie A Bezman et al. Blood Adv. .

Abstract

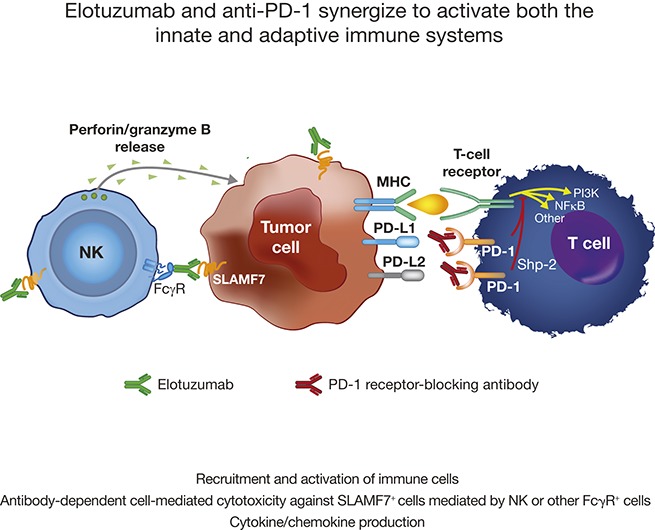
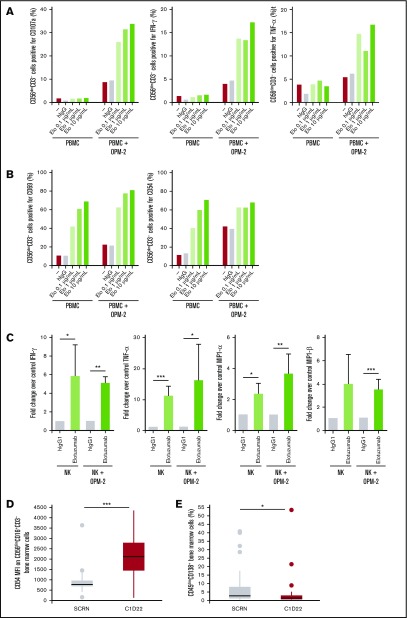
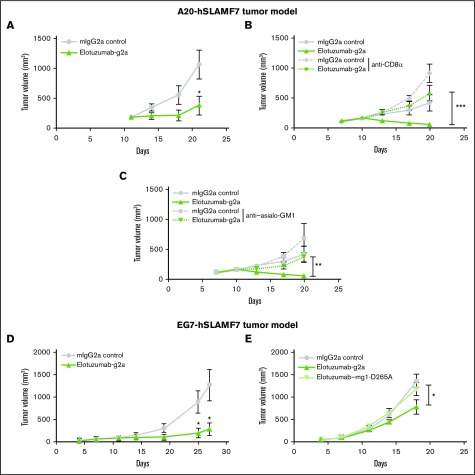
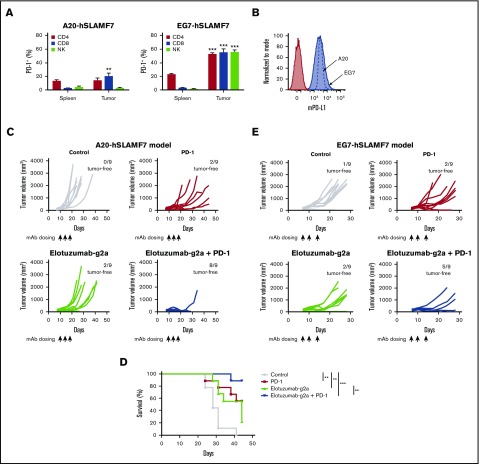
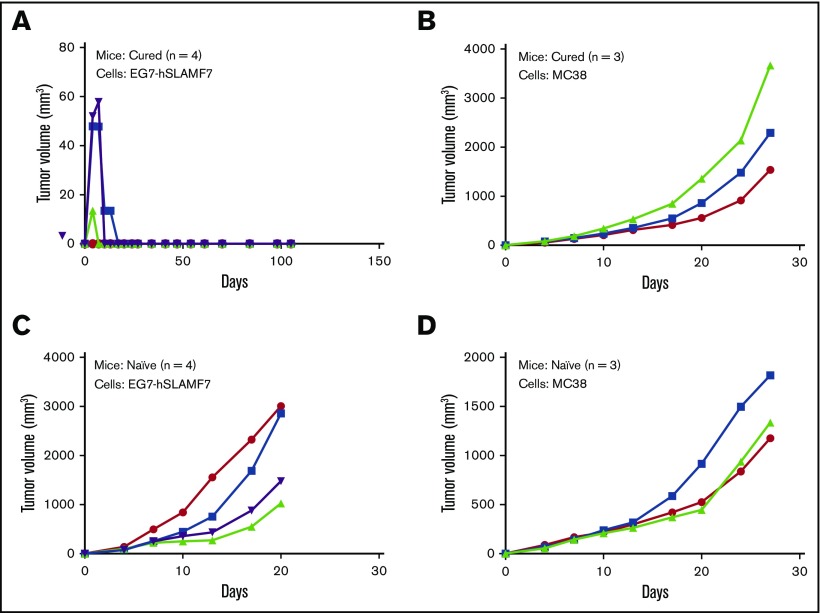
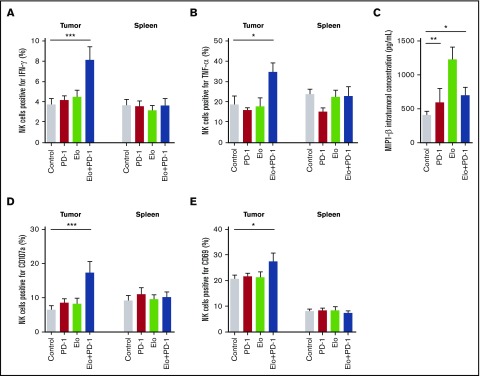
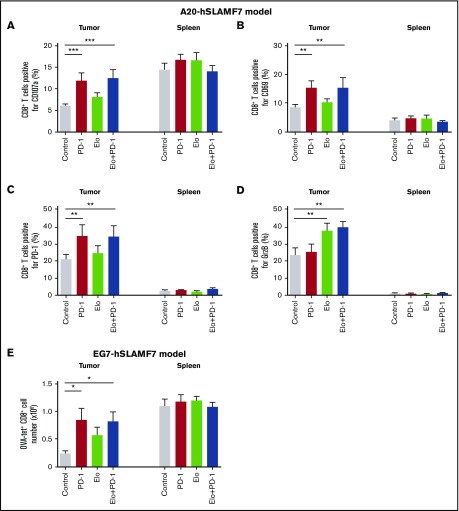
Elotuzumab, a humanized monoclonal antibody that binds human signaling lymphocytic activation molecule F7 (hSLAMF7) on myeloma cells, was developed to treat patients with multiple myeloma (MM). Elotuzumab has a dual mechanism of action that includes the direct activation of natural killer (NK) cells and the induction of NK cell-mediated antibody-dependent cellular cytotoxicity. This study aimed to characterize the effects of elotuzumab on NK cells in vitro and in patients with MM and to determine whether elotuzumab antitumor activity was improved by programmed death receptor-1 (PD-1) blockade. Elotuzumab promoted NK cell activation when added to a coculture of human NK cells and SLAMF7-expressing myeloma cells. An increased frequency of activated NK cells was observed in bone marrow aspirates from elotuzumab-treated patients. In mouse tumor models expressing hSLAMF7, maximal antitumor efficacy of a murine immunoglobulin G2a version of elotuzumab (elotuzumab-g2a) required both Fcγ receptor-expressing NK cells and CD8+ T cells and was significantly enhanced by coadministration of anti-PD-1 antibody. In these mouse models, elotuzumab-g2a and anti-PD-1 combination treatment promoted tumor-infiltrating NK and CD8+ T-cell activation, as well as increased intratumoral cytokine and chemokine release. These observations support the rationale for clinical investigation of elotuzumab/anti-PD-1 combination therapy in patients with MM.


Conflict of interest statement

Presented in oral form at the 21st annual conference of the European Hematology Association, Copenhagen, Denmark, 9-12 June 2016.Conflict-of-interest disclosure: N.A.B., K.H., A.J.K., M.D.R., and R.F.G. are employees of and/or have ownership interest in Bristol-Myers Squibb. A.J. and A.Y.K. are employees of Bristol-Myers Squibb. T.B. and M.M. were employees of Bristol-Myers Squibb at the time of the study. P.J.N. received funding from Bristol-Myers Squibb to perform aspects of this study. The remaining authors declare no competing financial interests.

Figures

None
Graphical abstract
Figure 1.
Figure 1.
Elotuzumab induces NK cell activation in PBMC/myeloma cell coculture in vitro and in patients with MM when combined with lenalidomide and dexamethasone. (A-B) PBMCs from healthy donors were incubated alone or with OPM-2 cells for 4 hours (A) or 20 hours (B) in the presence of either hIgG1 or increasing doses of elotuzumab (Elo). Surface expression of CD107a, CD69, and CD54 and intracellular levels of IFN-γ and TNF-α were determined by using flow cytometry with gating on live CD56dimCD3 lymphocytes. Results are representative of at least 4 donors. (C) Culture supernatant was collected at 20 hours, and NK-secreted IFN-γ, TNF-α, MIP-1α, and MIP-1β levels were measured by CBA. Data are presented as fold change comparing the cytokine levels in the presence of elotuzumab with those obtained in the presence of hIgG1. Differences were assessed by using a Student t test. (D-E) Analysis of bone marrow samples taken at time of screening (SCRN, gray box) and at C1D22 (red box) in patients with RRMM treated with ELd. (D) Median fluorescence intensity (MFI) of CD54 on CD56dimCD16+CD3 cells; n = 44 (P < .01). (E) Percentage of plasma cells (CD45dimCD138+) from bone marrow; n = 44 (P = .026). *P < .05; **P < .01; ***P < .001.
Figure 2.
Figure 2.
Maximal antitumor effect of elotuzumab requires both FcR-expressing NK cells and CD8+T cells in mouse tumor models. (A) BALB/c mice were injected subcutaneously with A20-hSLAMF7 tumor cells (10 × 106 cells) and randomized at day 11 when their tumors reached an average size of 180 ± 60 mm3. Mice were injected intraperitoneally with 10 mg/kg of either control mIgG2a (circles) or elotuzumab-g2a (triangles) on days 11, 14, and 18. n = 12 mice per group. *P = .022 vs IgG2a, day 21. (B-C) A20-hSLAMF7–bearing BALB/c mice were first randomized on day 7 (average tumor size: 117 ± 44 mm3) to receive anti-CD8α or anti–asialo-GM1 (days 7, 14, and 21) and then randomized again on day 10 (average tumor size: 166 ± 59 mm3) to receive 10 mg/kg of either control IgG2a or elotuzumab-g2a (days 10, 13, and 17) mAb. n = 10 mice per group. **P = .002 for elotuzumab-g2a/anti–asialo-GM1 vs elotuzumab-g2a; ***P = .0008 for elotuzumab-g2a/anti-CD8α vs elotuzumab-g2a, day 20. (D) C57BL/6 mice were injected subcutaneously with EG7-hSLAMF7 tumor cells (5 × 10⁶ cells) and randomized on day 7 when their tumors reached an average size of 98.9 ± 9.6 mm3. Mice were injected intraperitoneally with 10 mg/kg of either control IgG2a (circles) or elotuzumab-g2a (triangles) on days 7, 11, and 14. n = 7-8 mice per group. *P = .04 vs IgG2a, day 25; and P = .03 vs IgG2a, day 27. (E) EG7-hSLAMF7–bearing C57BL/6 mice were randomized on day 7 (average tumor size: 82 ± 42 mm3) to receive 10 mg/kg of control IgG2a (circles), elotuzumab-g2a (triangles), or elotuzumab–mg1-D265A (inverted triangles) on days 7, 11, and 14. n = 10-11 mice per group. *P = .04 elotuzumab-g2a vs control IgG2a, day 18. Data are mean ± SEM. Statistical analyses were performed at the indicated time point using the Mann-Whitney U test.
Figure 3.
Figure 3.
Elotuzumab-g2a and anti–PD-1 mAbs show synergistic antitumor activity. (A) Splenocytes and tumor-infiltrating lymphocytes from A20-hSLAMF7– or EG7-hSLAMF7–bearing mice were harvested. The proportion of splenic or tumor-infiltrating CD4+CD3+, CD8+CD3+, or NKp46+CD3 cells that expressed PD-1 was quantified. Results are a composite of 3 independent experiments with a total of 5 to 22 mice per group; error bars show SEM. Frequencies of tumor-infiltrating vs splenic PD-1+ cells were compared by using the paired Student t test. (B) A20-hSLAMF7 and EG7-hSLAMF7 cells prior to implantation were stained with either isotype control (filled red histogram) or anti-mouse PD-L1 (mPD-L1; blue histogram). A flow cytometry histogram representative of PD-L1 expression is shown. (C-D) A20-hSLAMF7–bearing mice were randomized to different treatment groups on day 10 when their tumors reached an average size of 157 ± 63 mm3 and were treated with 10 mg/kg elotuzumab-g2a or control mIgG2a and/or 3 mg/kg anti–PD-1 injected intraperitoneally on days 10, 14, and 17. Tumor volumes for individual mice (C) and percent survival (D) are shown. n = 9 per group. Differences between survival curves were analyzed by using the Mantel-Cox test. (E) EG7-hSLAMF7–bearing mice were randomized to different treatment groups on day 7 when their tumors reached an average size of 120 ± 51 mm3 and were treated with 10 mg/kg elotuzumab-g2a or control mIgG2a and/or 10 mg/kg anti–PD-1 injected intraperitoneally on days 7, 10, and 14. Tumor volumes for individual mice and the number of tumor-free mice per group are shown. n = 9 per group. **P < .01; ***P < .0001.
Figure 4.
Figure 4.
Long-term surviving mice treated with the elotuzumab-g2a/anti–PD-1 combination are protected against subsequent tumor rechallenge. (A-B) At day 88 after initial EG7-hSLAMF7 inoculation, a cohort of long-term surviving mice originally treated with 3 doses of the elotuzumab-g2a/PD-1 combination were rechallenged with either EG7-hSLAMF7 (A) or MC38 (B) cells. (C-D) Naive C57BL/6 mice were implanted with the same tumor cells to confirm tumor growth. Groups contained 3 to 4 mice and are from a single experiment. Symbols represent individual data points from individual mice.
Figure 5.
Figure 5.
Elotuzumab-g2a and anti–PD-1 combination promotes NK cell activation and cytokine and chemokine release within A20-hSLAMF7 tumors. A20-hSLAMF7–bearing mice were treated with control, 3 mg/kg anti–PD-1, 10 mg/kg elotuzumab-g2a (Elo), or elotuzumab-g2a plus anti–PD-1. Tumor-infiltrating and splenic NK cells were analyzed by flow cytometry. Results are a composite of 3 independent experiments with a total of 9 to 15 mice per group unless indicated otherwise. NK cells were gated as live, GFPCD19CD3NKp46+. (A-B) Quantification of (A) IFN-γ–producing and (B) TNF-α–producing tumor-infiltrating and splenic NK cells as percentages of total NK cells isolated 4 to 7 days after the start of treatment. (C) Intratumoral concentration of MIP-1β in tumors isolated 5 days after the start of treatment, measured by enzyme-linked immunosorbent assay. n = 5 per group. (D-E) Quantification of (D) CD107a+ and (E) CD69+ tumor-infiltrating and splenic NK cells as percentages of total NK cells isolated 10 to 14 days after the start of treatment. Results are shown as mean ± SEM. Statistical analyses were performed by using ANCOVA (A-B,D-E) and unpaired Student t test (C). *P < .05; ** P < .01; ***P < .0001.
Figure 6.
Figure 6.
Elotuzumab-g2a/anti–PD-1 combination promotes infiltration and effector function of CD8+T cells. (A-E) A20-hSLAMF7–bearing mice were treated with control, 3 mg/kg anti–PD-1, 10 mg/kg elotuzumab-g2a, or elotuzumab-g2a plus anti–PD-1. Tumor-infiltrating and splenic CD8+ T cells were analyzed by flow cytometry (gated as live, GFPCD19CD3+CD8+). Quantification of (A) CD107a, (B) CD69, (C) PD-1, and (D) intracellular GrzB tumor-infiltrating and splenic CD8+ T cells as percentages of total CD8+ T cells isolated 10 to 14 days after the start of treatment. Results are a composite of 3 independent experiments with a total of 8 to 18 mice per group. (E) EG7-hSLAMF7–bearing mice were treated with control, 10 mg/kg elotuzumab-g2a, 10 mg/kg anti–PD-1, or elotuzumab-g2a plus anti–PD-1, injected intraperitoneally. Tumor-infiltrating and splenic OVA-tet+ CD8+ T cells were analyzed by flow cytometry (gated as live, GFPCD19CD3+CD8+OVA-tet+) and enumerated. Results are shown as mean ± SEM and are from a representative experiment with 7 to 8 mice per group. Statistical analyses were performed by using ANCOVA (A-D) and unpaired Student t test (E). *P < .05; **P < .01; ***P < .0001.

References

    1. Weiner LM, Dhodapkar MV, Ferrone S. Monoclonal antibodies for cancer immunotherapy. Lancet. 2009;373(9668):1033-1040. - PMC - PubMed
    1. Ferris RL, Jaffee EM, Ferrone S. Tumor antigen-targeted, monoclonal antibody-based immunotherapy: clinical response, cellular immunity, and immunoescape. J Clin Oncol. 2010;28(28):4390-4399. - PMC - PubMed
    1. Clynes RA, Towers TL, Presta LG, Ravetch JV. Inhibitory Fc receptors modulate in vivo cytotoxicity against tumor targets. Nat Med. 2000;6(4):443-446. - PubMed
    1. Taylor RP, Lindorfer MA. Immunotherapeutic mechanisms of anti-CD20 monoclonal antibodies. Curr Opin Immunol. 2008;20(4):444-449. - PMC - PubMed
    1. Uchida J, Hamaguchi Y, Oliver JA, et al. . The innate mononuclear phagocyte network depletes B lymphocytes through Fc receptor-dependent mechanisms during anti-CD20 antibody immunotherapy. J Exp Med. 2004;199(12):1659-1669. - PMC - PubMed