. 2017 Jun 14;1(15):1001-1015.
doi: 10.1182/bloodadvances.2017004457. eCollection 2017 Jun 27.

Hmga2 collaborates with JAK2 V617F in the development of myeloproliferative neoplasms

Affiliations

Hmga2 collaborates with JAK2 V617F in the development of myeloproliferative neoplasms

Koki Ueda et al. Blood Adv. .

Abstract

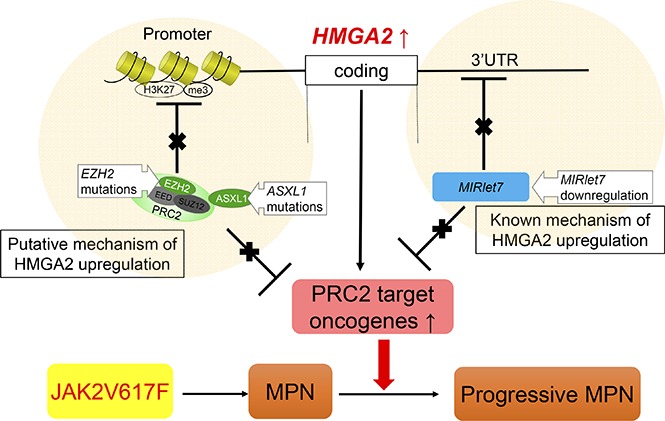
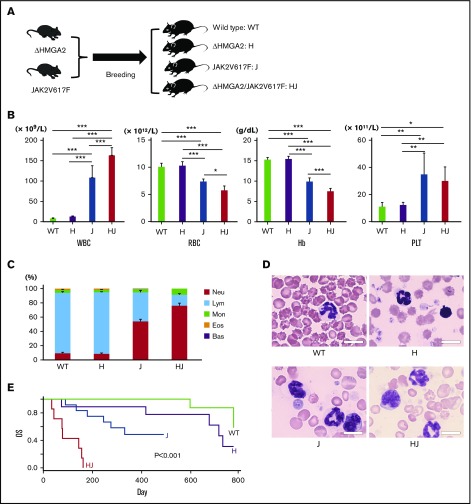
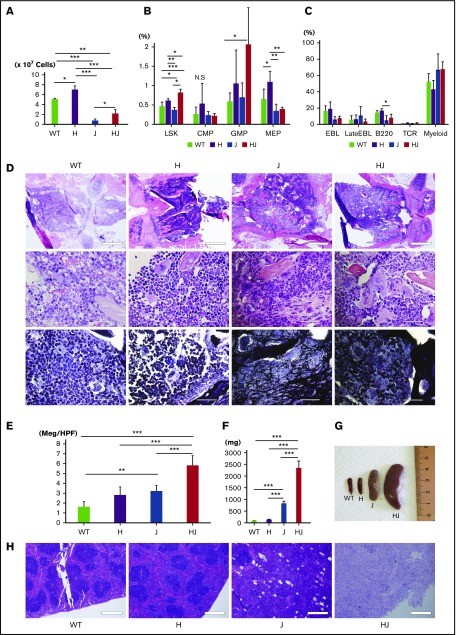
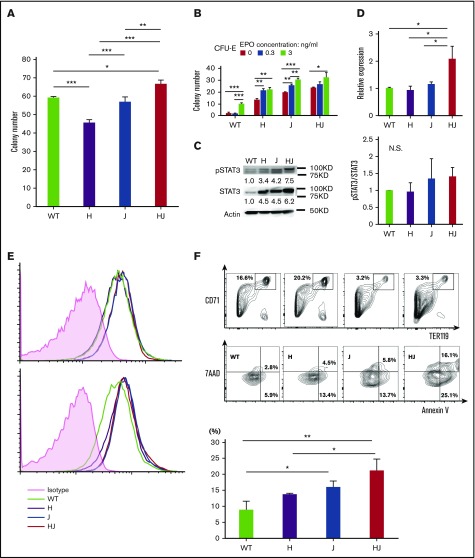
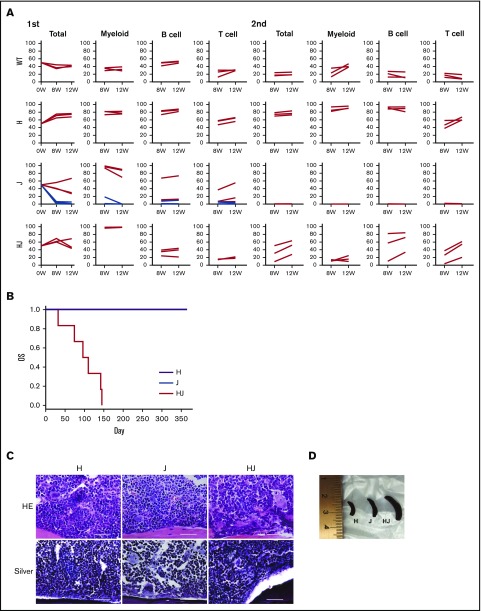
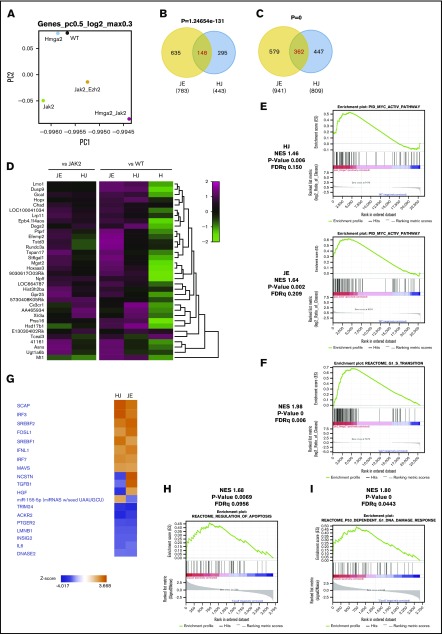
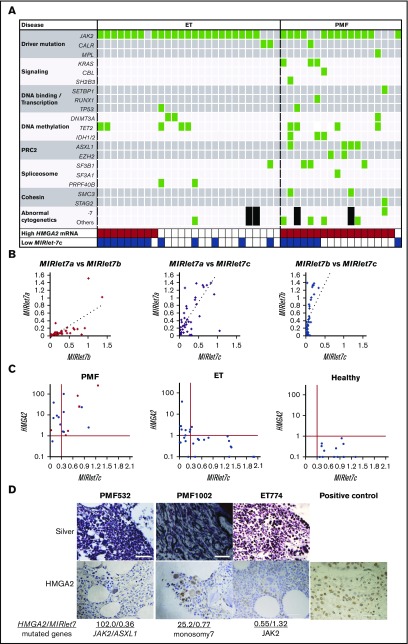
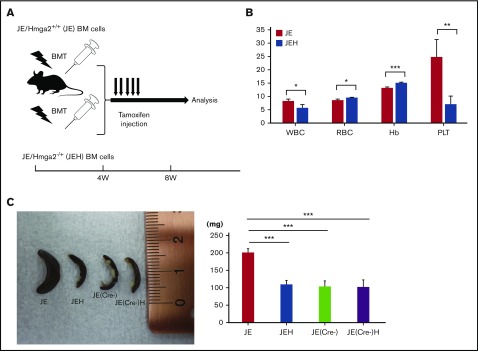
High-mobility group AT-hook 2 (HMGA2) is crucial for the self-renewal of fetal hematopoietic stem cells (HSCs) but is downregulated in adult HSCs via repression by MIRlet-7 and the polycomb-recessive complex 2 (PRC2) including EZH2. The HMGA2 messenger RNA (mRNA) level is often elevated in patients with myelofibrosis that exhibits an advanced myeloproliferative neoplasm (MPN) subtype, and deletion of Ezh2 promotes the progression of severe myelofibrosis in JAK2V617F mice with upregulation of several oncogenes such as Hmga2. However, the direct role of HMGA2 in the pathogenesis of MPNs remains unknown. To clarify the impact of HMGA2 on MPNs carrying the driver mutation, we generated ΔHmga2/JAK2V617F mice overexpressing Hmga2 due to deletion of the 3' untranslated region. Compared with JAK2V617F mice, ΔHmga2/JAK2V617F mice exhibited more severe leukocytosis, anemia and splenomegaly, and shortened survival, whereas severity of myelofibrosis was comparable. ΔHmga2/JAK2V617F cells showed a greater repopulating ability that reproduced the severe MPN compared with JAK2V617F cells in serial bone marrow transplants, indicating that Hmga2 promotes MPN progression at the HSC level. Hmga2 also enhanced apoptosis of JAK2V617F erythroblasts that may worsen anemia. Relative to JAK2V617F hematopoietic stem and progenitor cells (HSPCs), over 30% of genes upregulated in ΔHmga2/JAK2V617F HSPCs overlapped with those derepressed by Ezh2 loss in JAK2V617F/Ezh2Δ/Δ HSPCs, suggesting that Hmga2 may facilitate upregulation of Ezh2 targets. Correspondingly, deletion of Hmga2 ameliorated anemia and splenomegaly in JAK2V617F/Ezh2Δ/wild-type mice, and MIRlet-7 suppression and PRC2 mutations correlated with the elevated HMGA2 mRNA levels in patients with MPNs, especially myelofibrosis. These findings suggest the crucial role of HMGA2 in MPN progression.


Conflict of interest statement

Conflict-of-interest disclosure: The authors declare no competing financial interests.

Figures

None
Graphical abstract
Figure 1.
Figure 1.
Progressive MPN in ΔHmga2/JAK2V617Fmice. (A) Schematic diagram of the experiment. WT, ΔHmga2 (H), JAK2V617F (J), and ΔHmga2/JAK2V617F (HJ) mice were obtained in predicted Mendelian ratios. The analyses were performed at 12 weeks old. (B) Complete blood cell counts (means ± standard error of the mean [SEM]) and (C) fractions of white blood cells (%) in 5 WT, 7 H, 5 J, and 4 HJ mice. *P < .05; **P < .01; ***P < .001 calculated by the Tukey-HSD test. (D) May-Giemsa stains of peripheral blood samples (original magnification ×1000). Scale bars indicate 50 µm. (E) Survival periods. N = 9 for WT, 9 H, 12 J, and 7 HJ mice. The P values were calculated by a log-rank test. Bas, basophil; Eos, eosinophil; Hb, hemoglobin concentration (g/dL); Lym, lymphocyte; Mon, monocyte; Neu, neutrophil; OS, overall survival; PLT, platelet count (×1011/L); RBC, red blood cell count (×1012/L); WBC, white blood cell count (×109/L).
Figure 2.
Figure 2.
Hmga2 expression augments BM cells and HSCs with enhancing extramedullary hematopoiesis in JAK2V617F-induced MPN. (A) The total nuclear cell numbers from the ground right femur (×107). N = 3 for each. (B) The ratio of each fraction in BM by fluorescence-activated cell sorter (FACS; percentage in all gated cells) is shown. N = 5 for WT, 5 H, 4 J, and 3 HJ mice. (C) Ratios of differentiated cells in BM (percentage in all gated cells). N = 3 for each genotype. (D) Sternal BM histology. Hematoxylin and eosin (top and middle) and silver (bottom) stains. Scale bars indicate 500 μm (top; original magnification ×40) and 50 µm (middle and bottom; original magnification ×1000). (E) Mean megakaryocyte counts in high-powered field (Meg/HPF; ×400). Mean of 5 fields are shown in each genotype. (F) Spleen weight (N = 4, each genotype). (G) Representative picture of the spleens from the littermates. (H) Histology of spleens (hematoxylin and eosin stain). Scale bars indicate 500 µm (original magnification ×40). (A-C, E-F) Bars show the means ± SEM. *P < .05; **P < .01; ***P < .001 (Tukey-HSD test). B220, B220+ B cell; CMP, common myeloid progenitor cell; EBL, CD71+Ter119+ erythroblast; GMP, granulocyte-macrophage progenitor cell; H, ΔHmga2; HJ, ∆Hmga2/JAK2V617F; J, JAK2V617F; LateEBL/Ret, CD71+Ter119dim late erythroblast/reticulocyte; MEP, megakaryocyte-erythroid progenitor cell; Myeloid, Gr-1+ myeloid cell; N.S., not significant; T, TCR+ T cell.
Figure 3.
Figure 3.
Stat3 activation and apoptotic erythroblasts in ΔHmga2/JAK2V617Fmice. (A) Myeloid colonies from 1 × 10⁴ BM MNCs (N = 3 for each genotype, means ± SEM). *P < .05; **P < .01; ***P < .001 (Tukey-HSD tests). (B) Numbers of CFU-E colonies (means ± SEM) from 1 × 10⁵ of BM MNCs (N = 3 for each genotype). *P < .05; **P < .01; ***P < .001 (Tukey-HSD tests). The P values calculated by ANOVA were <.01 for both EPO concentrations and mouse transgenes. (C) Western blotting of Stat3 and pStat3 in BM MNCs without cytokine stimulation in each tg mouse. Left panel, A representative result; right panel, mean pSTAT3/STAT3 concentration (from 2 independent experiments) relative to WT. (D) Stat3 mRNA in BM MNCs by qRT-PCR (means ± SEM; N = 3 for each). *P < .05 (Tukey-HSD test). (E) FACS for pStat3 in BM MNCs incubated in the absence (top) and presence (bottom) of IL-3. The horizontal and vertical axes, respectively, indicate the brightness of pStat3 and the cell counts. (F) FACS for apoptosis of CD71+Ter119+ erythroblasts by Annexin V/7-Aminoactinomycin D (7AAD) staining. Top panel, A representative result; bottom panel, mean ratio of Annexin V+/7AAD apoptotic erythroblasts from 3 independent experiments. *P < .05; **P < .01; ***P < .001 (Tukey-HSD tests). (A-F) H, ΔHmga2; J, JAK2V617F; HJ, ΔHmga2/JAK2V617F.
Figure 4.
Figure 4.
Hmga2 expression promotes the repopulating ability and phenotypic reconstitution of JAK2V617F-induced MPN. (A) Competitive repopulations (N = 3-7). Ly5.2+ H, J, or HJ BM cells with competitor Ly5.1+ WT BM cells at the ratio of 1:1 were injected into lethally irradiated Ly5.1+ mice. The ratios (percentage; vertical axis) of Ly5.2+ cells in lineages at the indicated time points (horizontal axis) after the first (left) and second (right) BMT are shown. BM cells collected 12 weeks after first BMT were injected for recipients of the secondary BMT. Among J (JAK2V617F) mice (N = 7), BM cells from mice that achieved engraftment at the first BMT (red lines, N = 3) were exclusively referred to the second BMT. (B) Kaplan-Meier survival curves, (C) sternal BM histology, and (D) representative picture of the spleens of recipient mice at 12 weeks after the BMT, in BMT from the indicated transgenic mice without competitors (N = 6 for each). (B) P values were calculated by a log-rank test. (C) Hematoxylin-eosin (HE) and silver stains are shown (original magnification ×400). Scale bars indicate 50 µm. H, ΔHmga2; J, JAK2V617F; HJ, ∆Hmga2/JAK2V617F.
Figure 5.
Figure 5.
Hmga2 overexpression alters transcription of genes including the targets of Ezh2. (A) A Principal component (PC) analysis based on total gene expression in LSK cells (LSKs) isolated from WT, H, J, HJ, or JE recipient mice (5 for each and mixed for RNA-seq) 4 weeks after tamoxifen injection. (B) Venn diagrams showing upregulated genes between HJ and JE LSKs relative to J. (C) Venn diagrams showing upregulated genes between HJ and JE LSK cells relative to WT. (D) Heatmaps showing the expression of representative genes upregulated in panels B and C. (E) MYC pathway enriched in HJ (top) and JE (bottom) compared with WT. This pathway was not enriched in J (FDR = 0.389). (F) Enrichment plot of G1-S transition (HJ vs J), which represents frequent upregulations of gene sets associated with cell cycle and metabolism in ΔHmga2/JAK2V617F LSKs (shown in supplemental Tables 3 and 4). (G) Signal activation/inactivation in HJ and JE mice relative to J shown by an upstream analysis. Pathways with z score > |2| in both HJ and JE are shown. (H) CD71+Ter119+ erythroblasts sorted from BM of 12-week-old WT, H, J, and HJ mice (3 for each) were mixed for RNA-seq. Enrichment of gene sets for regulation of apoptosis (HJ vs J) is shown. (I) GSEA of RNA-seq data for p53-dependent G1 DNA damage response pathway in erythroblasts (HJ vs J). H, ΔHmga2; J, JAK2V617F; HJ, ΔHmga2/JAK2V617F; JE, JAK2V617F/Ezh2Δ/Δ; NES, normalized enrichment score.
Figure 6.
Figure 6.
High HMGA2 mRNA levels in patients with PMF are correlated with either repressed MIRlet-7 expressions or mutations in PRC2 components. (A) Mutations in the patients with ET (N = 27) and PMF (N = 18). Black squares indicate no metaphase cells in the chromosomal analysis. (B) Correlations in the expression of MIRlet-7a, -7b, and -7c in granulocytes of the patients with ET and PMF. MIRlet-7a vs -7b, R = 0.70 (left); MIRlet-7a vs -7c, R = 0.74 (center); MIRlet-7b vs -7c, R = 0.85 (right) (R indicates correlation coefficients). (C) Correlations in the expression levels of MIRlet-7c and HMGA2 mRNA in the granulocytes of individual patients. The red lines indicate the lower (MIRlet-7c) or upper (HMGA2) limit of the normal range determined according to the data of the healthy controls (see “Materials and methods”). Red circles indicate the patients with mutations in PRC2-related EZH2 and ASXL1, and a rhomboid denotes a patient with monosomy 7 involving EZH2. (D) Immunostaining of biopsied BM. The nuclei of megakaryocytes from 2 PMF patients with high expression of HMGA2 were positively stained by anti-HMGA2 antibody; those of the ET patient with low expression of HMGA2 were not stained. The tissue from breast cancer, in which the nuclei of neoplastic cells were positively stained, was used as a positive control. Scale bars indicate 50 μm.
Figure 7.
Figure 7.
Hmga2 inhibition ameliorates MPN in JAK2V617Fmice with Ezh2 KO. (A) Schematic diagram of Hmga2 KO (Hmga2−/+) in JAK2V617F/EZH2fl°x/WT/CRE-ERT (JE). BM cells were collected from JE with HMGA2−/+ (JEH) or HMGA2+/+ (JE) mice and transplanted. Conditional Ezh2 KO was initiated by tamoxifen 4 weeks after transplantation. (B) Complete blood cell counts (means ± SEM). N = 5 for each. *P < .05; **P < .01; ***P < .001 (Student t test). (C) Spleens at 8 weeks after transplantation with JE, JEH, JE without Cre [JE(Cre−)], and JEH without Cre [JE(Cre−)H] cells. Left, Representative figure. Right, Mean spleen weight. N = 3 for each; ***P < .001 (Turkey-HSD test).

References

    1. Tefferi A. Pathogenesis of myelofibrosis with myeloid metaplasia. J Clin Oncol. 2005;23(33):8520-8530. - PubMed
    1. Levine RL, Gilliland DG. Myeloproliferative disorders. Blood. 2008;112(6):2190-2198. - PMC - PubMed
    1. Tam CS, Nussenzveig RM, Popat U, et al. . The natural history and treatment outcome of blast phase BCR-ABL- myeloproliferative neoplasms. Blood. 2008;112(5):1628-1637. - PMC - PubMed
    1. Kralovics R, Passamonti F, Buser AS, et al. . A gain-of-function mutation of JAK2 in myeloproliferative disorders. N Engl J Med. 2005;352(17):1779-1790. - PubMed
    1. James C, Ugo V, Le Couédic JP, et al. . A unique clonal JAK2 mutation leading to constitutive signalling causes polycythaemia vera. Nature. 2005;434(7037):1144-1148. - PubMed

LinkOut - more resources