. 2017 Jul 21;1(17):1324-1334.
doi: 10.1182/bloodadvances.2017007260. eCollection 2017 Jul 25.

Th17 immune microenvironment in Epstein-Barr virus-negative Hodgkin lymphoma: implications for immunotherapy

Affiliations

Th17 immune microenvironment in Epstein-Barr virus-negative Hodgkin lymphoma: implications for immunotherapy

Amy S Duffield et al. Blood Adv. .

Abstract

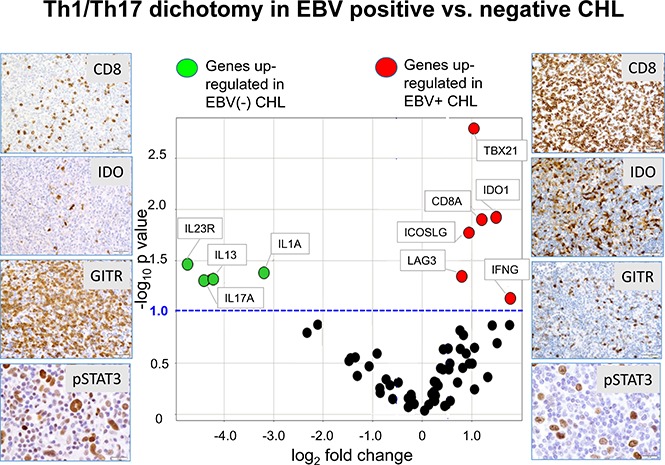
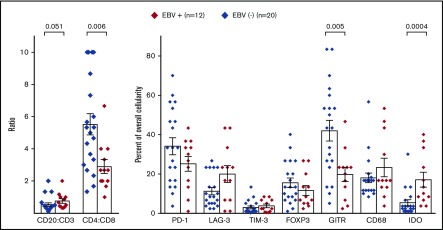
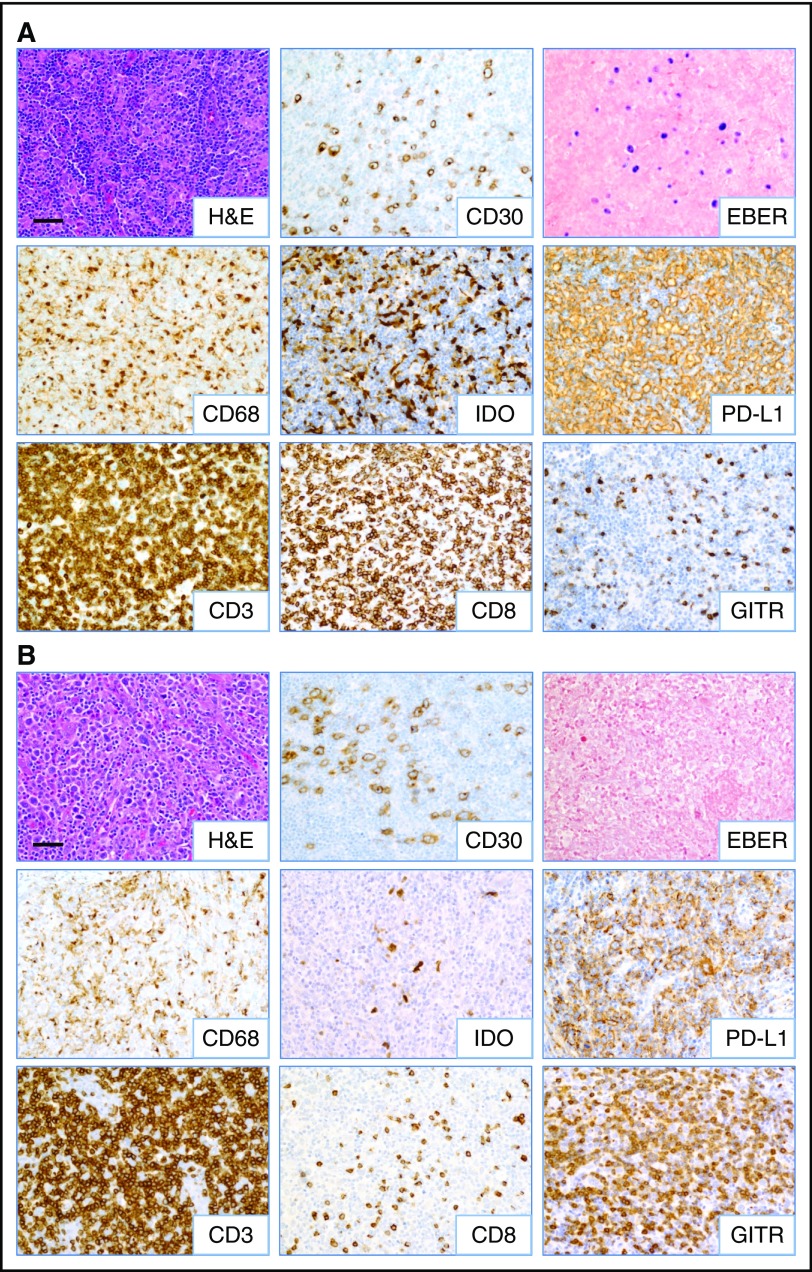
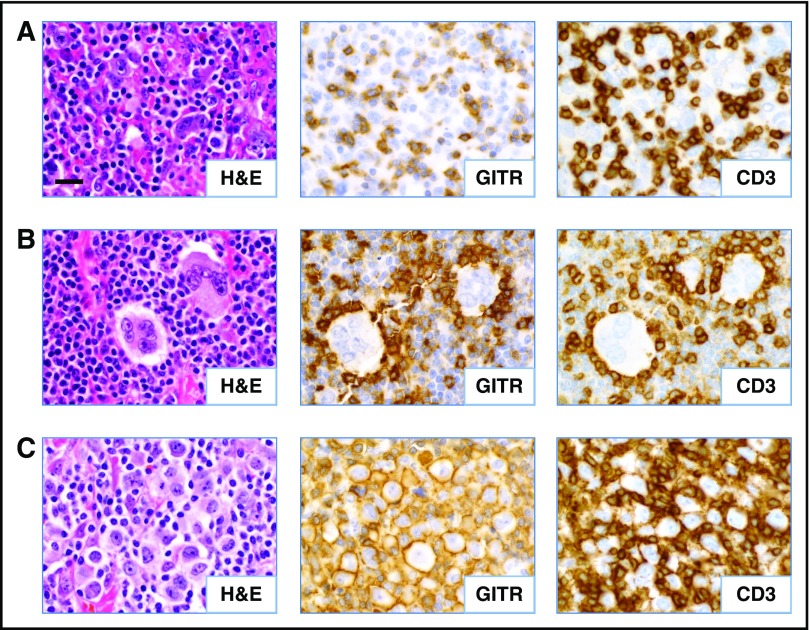
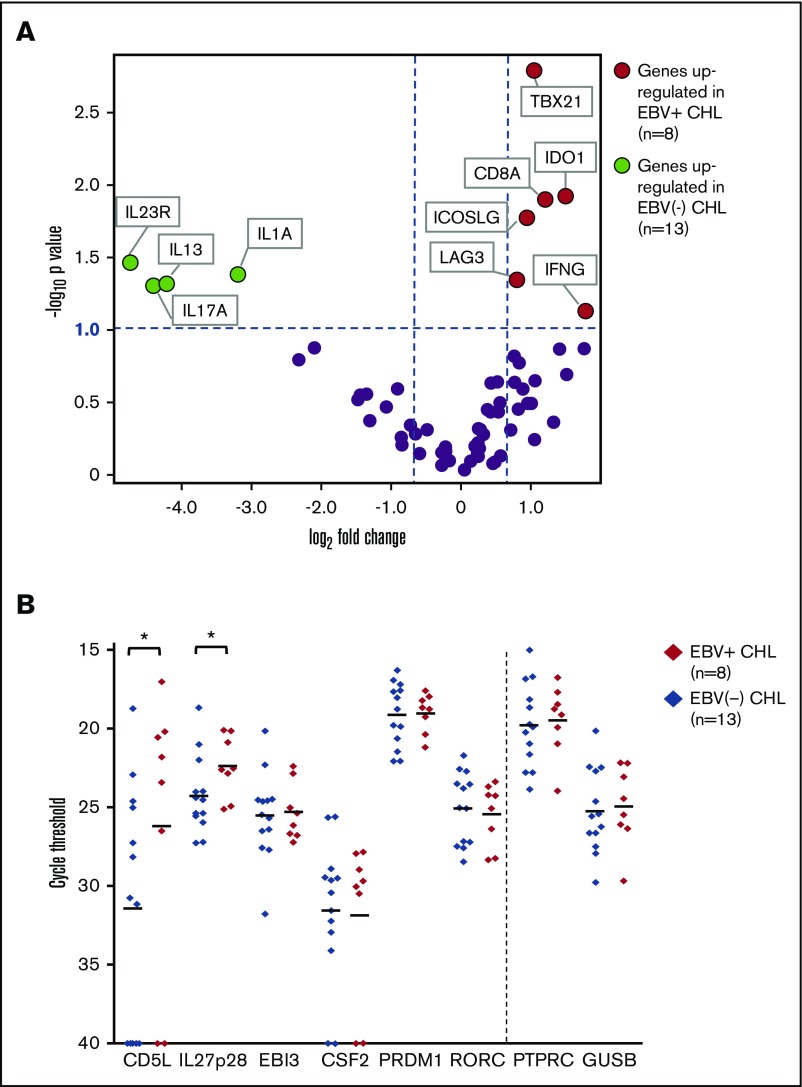
Classical Hodgkin lymphoma (CHL) is a neoplasm characterized by robust inflammatory infiltrates and heightened expression of the immunosuppressive PD-1/PD-L1 pathway. Although anti-PD-1 therapy can be effective in >60% of patients with refractory CHL, improved treatment options are needed for CHLs which are resistant to anti-PD-1 or relapse after this form of immunotherapy. A deeper understanding of immunologic factors in the CHL microenvironment might support the design of more effective treatment combinations based on anti-PD-1. In addition, because the Epstein-Barr virus (EBV) residing in some CHL tumors is strongly immunogenic, we hypothesized that characteristics of the tumor immune microenvironment in EBV+ CHL would be distinct from EBV- CHL, with specific implications for designing combination treatment regimens. Employing immunohistochemistry for immune cell subsets and checkpoint molecules, as well as gene expression profiling, we characterized 32 CHLs from the Johns Hopkins archives, including 12 EBV+ and 20 EBV- tumors. Our results revealed a dichotomous cellular and cytokine immune milieu in EBV+ vs EBV- CHL. EBV+ tumors displayed a T helper 1 (Th1) profile typical of effective antitumor immunity, with increased infiltration of CD8+ T cells and coordinate expression of the canonical Th1 transcription factor Tbet (TBX21), interferon-γ (IFNG), and the IFN-γ-inducible immunosuppressive enzyme indoleamine 2,3-dioxygenase. In contrast, EBV- tumors manifested a pathogenic Th17 profile and ongoing engagement of the interleukin-23 (IL-23)/IL-17 axis, with heightened phosphorylated signal transducer and activator of transcription 3 expression in infiltrating lymphocytes. These findings suggest that drugs blocking the IL-23/IL-17 axis, which are already in the clinic for treating certain autoimmune disorders, may enhance the therapeutic impact of anti-PD-1 therapy in EBV- CHL.


Conflict of interest statement

Conflict-of-interest disclosure: R.A.A. receives research support from Bristol-Myers Squibb and Five Prime Therapeutics and serves on an advisory board for Merck. J.M.T. receives research funding from Bristol-Myers Squibb and serves on advisory boards for Bristol-Myers Squibb, Merck, and AstraZeneca. A.K.M. receives research funding from Bristol-Myers Squibb. D.M.P. receives research grants from Bristol-Myers Squibb; consults for Five Prime Therapeutics, GlaxoSmithKline, Jounce Therapeutics, MedImmune, Pfizer, Potenza Therapeutics, and Sanofi; holds stock options in Jounce and Potenza; and is entitled to receive patent royalties through his institution from Bristol-Myers Squibb and Potenza. S.L.T. receives research funding from Bristol-Myers Squibb. R.F.A. serves on an advisory board for Bristol-Myers Squibb. The remaining authors declare no competing financial interests.

Figures

None
Graphical abstract
Figure 1.
Figure 1.
Immune cell subsets and expression of immunoregulatory molecules in EBV+compared with EBVCHL specimens. Markers were detected by IHC and quantified as detailed in “Methods.” Diamond symbols indicate average values for triplicate scores for an individual tumor specimen (see “Methods”). Bars indicate mean values and standard error of the mean. P values from the Wilcoxon rank sum test were >.1 unless indicated.
Figure 2.
Figure 2.
Inflammatory composition of EBV+and EBVCHL. Representative images from (A) EBV+ and (B) EBV CHL (specimens CHL-23 and CHL-12, respectively; see Table 1) are shown. HRS tumor cells are identified by anti-CD30 IHC and EBER ISH. A predominance of CD8+ T cells and IDO+ histiocytes was observed in EBV+ cases, whereas increased GITR+ lymphocytes were seen in EBV cases. Robust CD3+ T-cell infiltrates and PD-L1 expression on HRS cells and infiltrating immune cells were observed regardless of EBV status. Slides were imaged on an Olympus BX46 microscope with an Olympus DP72 camera at ×200 magnification with an aperture of 0.5, and Olympus cellSens Standard 1.5 image acquisition software was used. Bar, 50 μm. H&E, hematoxylin and eosin.
Figure 3.
Figure 3.
Patterns of GITR expression observed in CHL. Serial FFPE tumor sections were stained as indicated. (A) Diffuse GITR expression on infiltrating T lymphocytes (case CHL-2). (B) Rosettes of GITR+ T cells surrounding HRS tumor cells (case CHL-19). (C) GITR expression on the plasma membrane of a subset of the HRS cells (case CHL-7). All cases shown are EBV specimens. Slides were imaged at ×500 magnification with an aperture of 0.9. Bar, 20 μm.
Figure 4.
Figure 4.
Analysis of expression of selected immune genes in EBV+vs EBVCHL. (A) Expression of 60 candidate immune-related genes, assessed with multiplex qRT-PCR. Horizontal dotted line, P value = .10, determined with a 2-sided Welch t test. Vertical dotted lines, 1.7-fold difference in expression magnitude, comparing EBV+ vs EBV Hodgkin lymphomas (n = 8 and n = 13, respectively). Data are normalized to PTPRC (CD45, pan leukocyte marker). Similar results were obtained with GUSB normalization (see supplemental Table 1). (B) Expression of select genes involved in the Th17 pathway, detected with qRT-PCR in EBV+ and EBV CHL specimens. The y-axis represents cycle threshold (Ct); lower values indicate greater gene expression. Gene expression values with Ct = 40 were considered to be undetectable. Each symbol identifies the average of triplicate PCR reactions for a distinct tumor specimen. Horizontal bars, mean values. *Genes with P value ≤.10 and fold change ≥2 when Ct results were normalized to expression of either PTPRC or GUSB (see supplemental Table 2). P values determined with a 1-sided Welch t test. Results visualized with GraphPad software (La Jolla, CA). CD5L and IL27p28 were significantly overexpressed in EBV+ CHL.
Figure 5.
Figure 5.
Effects of IL-1a, IL-17A, IL-23, and IL-27 on PD-L1 expression by human immune cells. Enriched cell populations were cultured in the presence of cytokines for 2 days; then, PD-L1 cell-surface protein expression was detected by flow cytometry (see “Methods”). (A) Monocytes were exposed to cytokines in the absence or presence of IFN-γ. IL-1a- and IL-27–enhanced PD-L1 expression in the absence of IFN-γ. IL-1a, but not IL-27, further increased PD-L1 expression in the presence of IFN-γ. In contrast, no cytokine significantly affected expression of CD86 (B7.2) on monocytes. Results are representative of 4 of 4 normal donors. (B) DCs were exposed to cytokines in the absence or presence of IFN-γ. IL-27 increased PD-L1 expression in the absence of IFN-γ, but did not further augment expression in the presence of IFN-γ. In contrast, no effects were seen on CD86 expression in the same experiment. Results are representative of 2 of 2 donors. (C) CD3+ T cells that were resting or activated with anti-CD3/CD28 were exposed to cytokines. IL-27 increased PD-L1 expression on both resting and activated T cells. Expression of CD69, an early T-cell activation marker, was also increased by exposure to IL-27. Results are representative of 2 of 2 donors. MAX, % of maximum cell count; MFI, mean fluorescence of intensity; ∆MFI, MFI of isotype control was subtracted from that of specific staining.
Figure 6.
Figure 6.
Expression of phosphorylated STAT3 in EBV+vs EBV CHL. Nuclear pSTAT3 expression was detected with IHC. HRS tumor cells in both EBV+ and EBV specimens expressed pSTAT3 robustly at equivalent levels (P value not significant). (A) However, infiltrating lymphocytes in EBV specimens overexpressed pSTAT3, consistent with gene expression profiling results (P = .037, by a 1-sided Wilcoxon rank sum test). Horizontal black lines indicate the mean and the mean ± standard error of the mean. (B) Representative photomicrographs from EBV+ and EBV CHL specimens stained with anti-pSTAT3. Black arrows, HRS tumor cells; red arrows, lymphocytes. Slides were imaged at ×500 magnification with an aperture of 0.9. Bar, 20 μm.

References

    1. Glaser SL, Lin RJ, Stewart SL, et al. . Epstein-Barr virus-associated Hodgkin’s disease: epidemiologic characteristics in international data. Int J Cancer. 1997;70(4):375-382. - PubMed
    1. Mathas S, Hartmann S, Küppers R. Hodgkin lymphoma: pathology and biology. Semin Hematol. 2016;53(3):139-147. - PubMed
    1. Cohen JI. Epstein-Barr virus infection. N Engl J Med. 2000;343(7):481-492. - PubMed
    1. Cohen JI. Primary immunodeficiencies associated with EBV disease. Curr Top Microbiol Immunol. 2015;390(Pt 1):241-265. - PMC - PubMed
    1. Crane GM, Powell H, Kostadinov R, et al. . Primary CNS lymphoproliferative disease, mycophenolate and calcineurin inhibitor usage. Oncotarget. 2015;6(32):33849-33866. - PMC - PubMed

LinkOut - more resources